
I was hours from sending you a newsletter with a false number in the first paragraph.

The number was zero. The claim was that my agent fleet, five-plus agents running on Claude Code against a self-hosted Langfuse instance, had never recorded a single quality score in its entire history. Fully instrumented on the activity side. Completely dark on whether any of the work was good. I had the queries, the tables, the framework, and a title I liked.
Then I re-ran the query before publishing, because the data was seven weeks old and I did not want to ship a stale figure.
It came back 42.
Forty-two quality scores, sitting on my own fleet’s traces, every one of them stamped inside the same 48 hours: January 30 and 31, 2026.
Those dates are the part that actually hurt. January 31 is the day I published I Built an Observability Layer for Claude Code. I wired up an LLM-as-judge hallucination eval, pointed it at one of my agents, watched it produce scores, wrote a post about building observability, and then never ran it again. Not once in the following six months.
And I should be straight with you about something worse than a near miss. I did not almost publish the wrong number. In June I already published it, on LinkedIn: “It came back empty. Zero scores, fleet-wide.” That post is still up. It was wrong the day I wrote it, and the evidence proving it wrong was already four months old and sitting in my own database.
That is the first of two things I got wrong this week. The second is the one in the title, and it is worse: when I finally rebuilt the eval, it accused my working agents of fabricating, fluently and specifically, and I nearly believed it.
By the end you will have a re-measurement routine that catches this in your own estate, a framework for the five layers most teams never measure, the context contract that stops a judge from lying to you, and (for paid subscribers) the exact queries I ran, plus the report spec to put them on a schedule.
I had a tidy story ready. It went: most teams instrument activity and never instrument quality, and I am one of them, and here is how to fix it.
The real story is worse and more useful. I did instrument quality. It worked. And then the measurement quietly stopped, and no part of my very well-instrumented system noticed or told me.
Look at what the eval actually found in January. The overwhelming majority came back 0 on a hallucination scale where 0 means clean, with a handful between 0.1 and 0.6. One comment praised the output for “not introducing any inaccurate or implausible information.”
The eval passed. That is almost certainly why I stopped looking at it.
Nothing failed loudly. There was no red dashboard, no alert, no broken build. The eval returned good news once, I felt fine, and the job never ran again. Six months later the absence of scores looked exactly like the absence of a system, even to me, and I had to be talked out of that conclusion by my own database.
This is the most common production-AI mistake I see, including in my own house: teams treat instrumentation as a project with a completion date instead of a loop with a heartbeat. A dashboard that is not re-read is a screenshot. An eval that is not re-run is a memory.
I named this failure a few weeks ago in the governance piece: Silent Failure, where the agent keeps producing and quality degrades with no alarm attached. What I missed is that it happens one level up too, to the measurement itself.
Here is the correction that matters for your fleet, not just mine.
“Do we have quality scores” is the wrong question, because it has a yes/no answer and mine was technically yes. The right question is what fraction of your traffic carries a quality signal.
Run that on my estate and the picture snaps into focus.

(The 42 scores land on at most 39 traces, because a few traces caught more than one.)
Under 1/5 of one percent, lifetime. Zero across the last month. (Both of those numbers are now out of date, because of something I did while writing this issue. I will come back to that.)
That is the difference between “we have evals” and “we have an eval signal.” I had evals. I did not have a signal. And from the dashboard, at that coverage level, I genuinely could not tell the two apart, which is why I nearly published the wrong number in the wrong direction.
If you take one thing from this issue: stop asking whether quality scores exist and start reporting score coverage as a percentage, on the same dashboard as your activity metrics, with the same refresh cadence. A count answers a question nobody should be asking. A percentage answers the one that matters.
The draft I nearly sent contained a confession. It said that my traces carried a fleet tag and an agent tag but no host tag, that I therefore could not tell whether the same agent behaved differently on the Mac Studio than on the MacBook, and that you should add the host tag on day one because you cannot recover a dimension you never recorded.
Good advice. Also obsolete. The re-mine returned this:
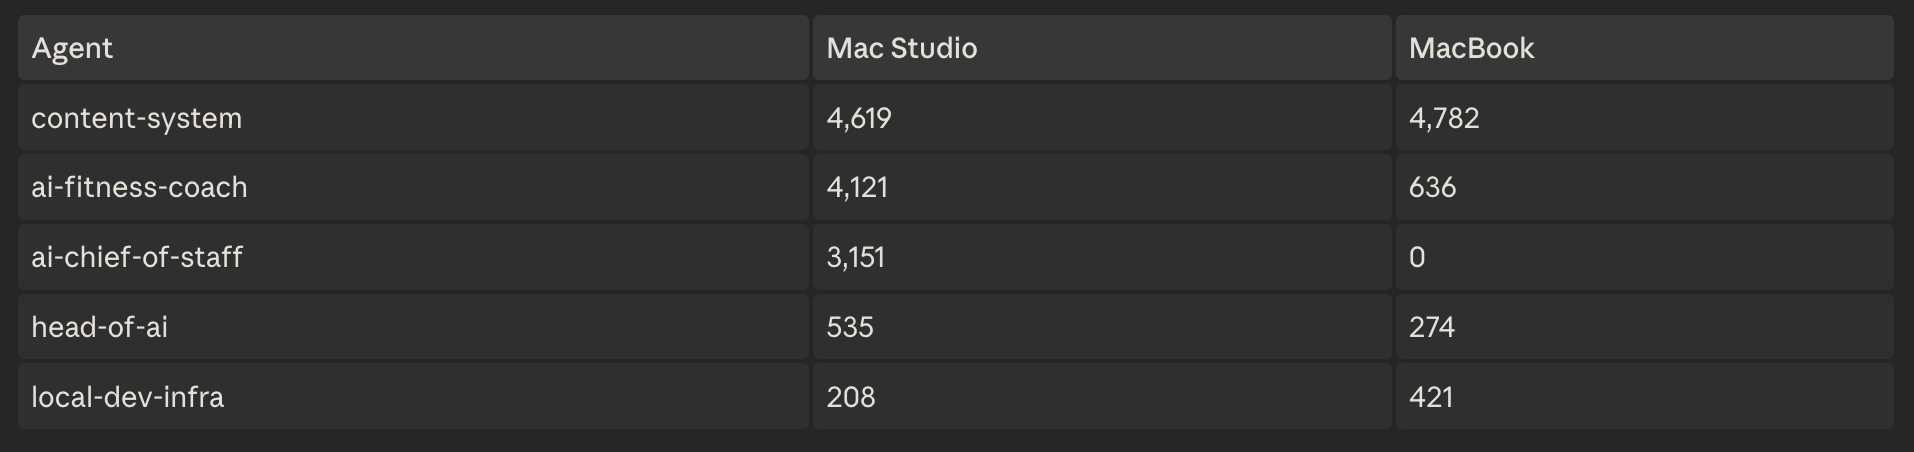
The host tag is there. It has been there for a while. I fixed the gap at some point, did not write it down, and then wrote a confession about a limitation I no longer had.
So in seven weeks my observability posture drifted in both directions at once. Something I had built decayed without telling me (the eval stopped running). Something I had complained about got fixed without telling me (the host dimension appeared). I knew about neither, because between June 11 and July 28 I never re-ran the check.
That is the actual thesis of this issue, and it is not the one I set out to write. Your observability stack has its own drift, and it moves in both directions.
For grounding, here is the current 30-day window, mined today. My fleet is a set of agents running on Claude Code across two machines, reporting into a self-hosted Langfuse instance backed by ClickHouse, reachable over Tailscale. That is the setup I described last week in why sovereign AI starts with your traces, not your GPUs. Owning your telemetry and reading it turn out to be different projects.
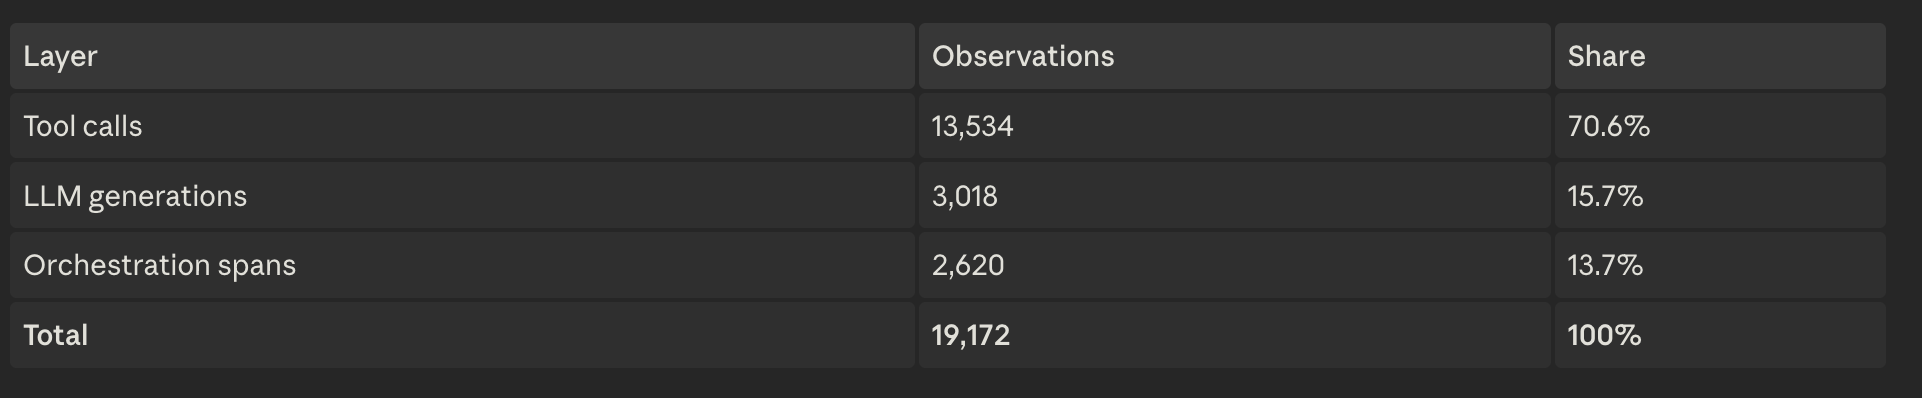
2,207 traces across 1,726 sessions. 4.5 tool calls for every LLM generation. 382 subagent spawns.
The headline holds even though every number moved: the generation layer, the only layer most teams watch, is under one sixth of what my system does. If you are monitoring model calls, you are monitoring 15.7% of your fleet and calling it observability.
Two details from the window that are worth more than the averages.
Activity registered on 27 of 31 days, with a four-day hole from July 14 through 17. Daily trace volume ranges from 1 to 360. Bursty, not steady. Any threshold alert tuned to a daily average would fire constantly or never.
The behavioral spread between agents is roughly 30x. ai-fitness-coach runs 9.2 tool calls per generation. ai-chief-of-staff runs 0.3, because it is a scheduled job that mostly thinks and rarely touches anything. Those two are the same “agent” only in the sense that a forklift and a bicycle are both vehicles. One blended fleet average describes neither.
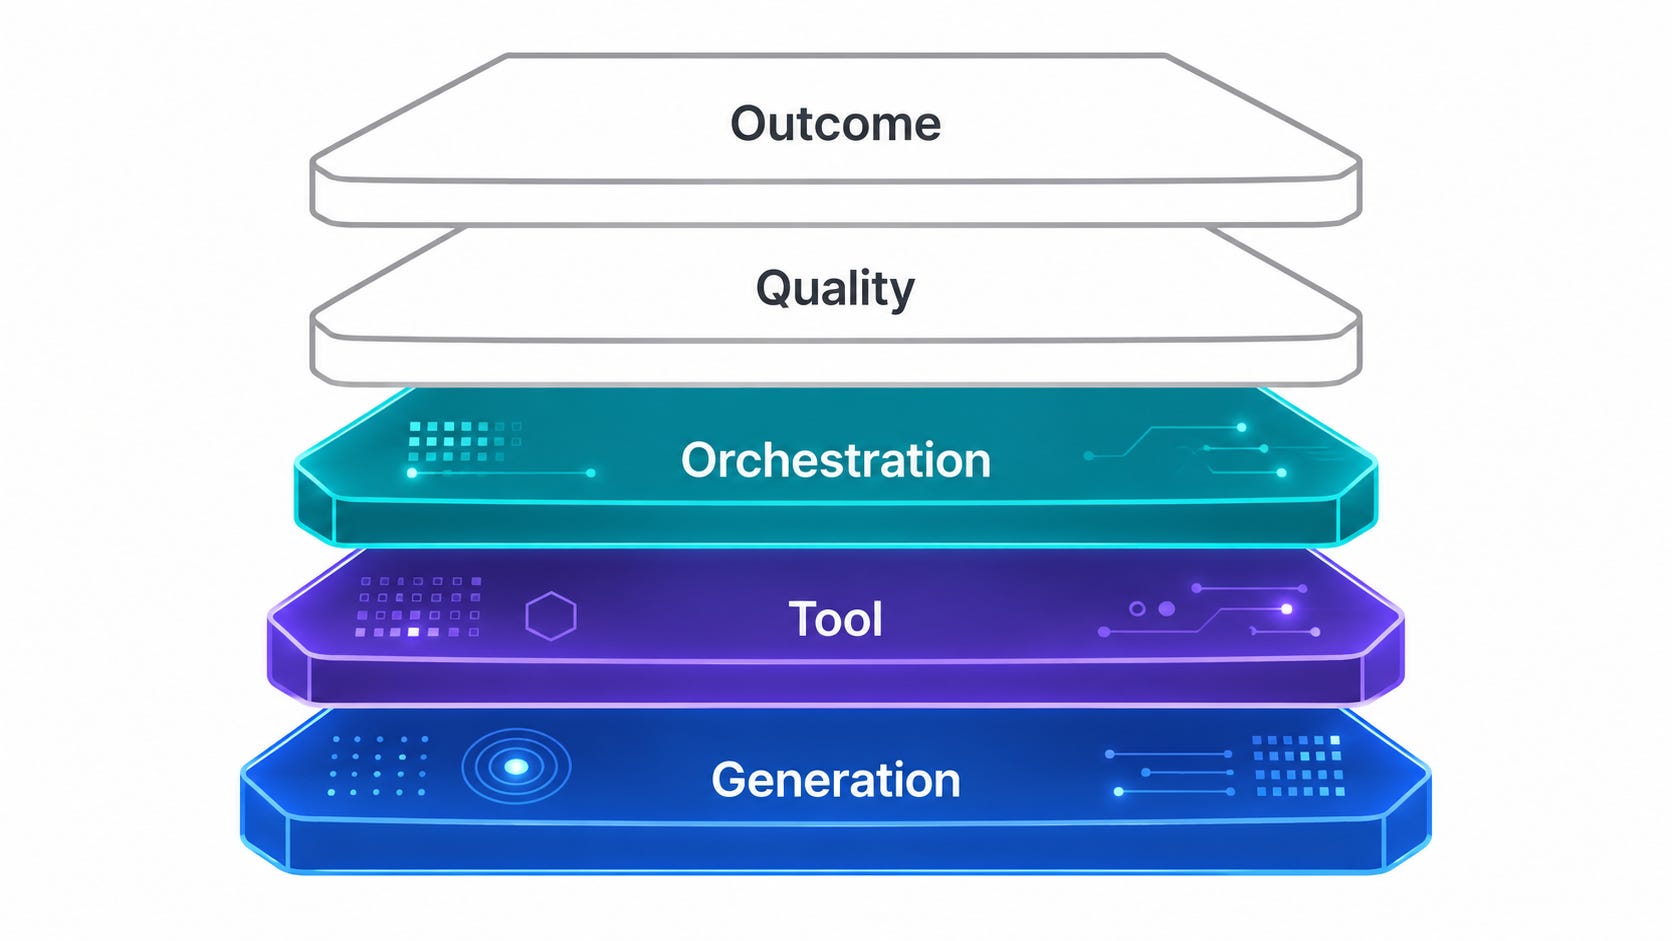
Five layers. Most teams instrument one and a half.
Layer 1: Generation. The LLM calls. Model, tokens, cost, prompt, completion. In my fleet, 15.7% of all activity. This is the layer every vendor dashboard shows you by default, and it is the smallest one.
Layer 2: Tool. What the agent actually did to the world. Files read and written, commands run, browsers driven, APIs hit. 70.6% of my activity. This is your real operational and security surface, and it is where the blast radius lives.
Layer 3: Orchestration. Turns, sessions, subagent spawns, retries. 13.7%, including 382 subagent spawns in thirty days. This is where cost and latency compound invisibly.
Layer 4: Quality. Did the output meet a standard. Scores, evals, judgments, thumbs. My coverage: under 0.17% lifetime, 0% this month.
Layer 5: Outcome. Did the work matter. Task completed, decision shipped, human accepted it without rewriting it. My coverage: zero. I am not going to pretend otherwise.
You do not audit a factory by monitoring one station and calling it full visibility. Layers 1 through 3 tell you the machine is running. Layers 4 and 5 tell you it is producing something worth the electricity. Most agent programs I see, and mine until this week, measure the running and infer the worth.
If you are a CTO reviewing an agent program this quarter, the question is not “is it instrumented.” Ask for score coverage as a percentage, and ask when the number was last refreshed. Both answers should be on one screen. If nobody can produce them in the meeting, the program is measuring activity and hoping.
Writing all of the above and then sending it without fixing anything would have made me exactly the person this issue is about. So before finishing, I rebuilt the eval: an LLM-as-judge scoring recent fleet turns for hallucination on the same 0-to-1 scale as the January run, where 0 means grounded.
Twelve traces from today. The first pass came back mean 0.517, with eight of twelve turns flagged at 0.6 or above. The comments were specific and damning: one said an agent had invented deleted worktrees and fabricated verification steps. Another said an agent had invented an entire email, complete with a named sender and the file they were calling about.
For about ten minutes I believed I had found something much worse than a coverage gap.
Then I pulled the tool calls for the worst-scoring trace. It had forty-five of them. Bash, Edit, Read, in sequence, doing precisely the work the response claimed to have done. The agent was not fabricating anything. My judge simply could not see any of it, because I had fed it the input and the output and nothing in between.
I added the tool observations and re-ran. The false positives collapsed: 0.75 became 0.10, 0.75 became 0.05.
The email-inventing scores did not move, so I went and looked at those too. Those traces carry no tool calls at all, which had looked like proof. It was not. Those prompts run 9,000 to 16,000 characters, the email sits inside them, and my harness had truncated the input at 2,000 characters before handing it to the judge. The judge was scoring a summary of a document it had been shown the first eighth of.
Third pass, full input and tool evidence together:

The fleet was fine the whole time. My eval was not.
That is the same failure as the rest of this issue, one level up. I built an activity ledger and never measured quality. Then I built a quality measure and starved it of the activity ledger. Layer 4 has to consume Layer 2, or it is guessing with confidence.
And confidence is the part that should worry you. A judge missing critical context does not return “insufficient evidence.” It returns 0.85 and a fluent paragraph explaining why. My eval hallucinated hallucinations, and every single one of its accusations read as credible until I checked. If I had wired pass one to an alert instead of to a spreadsheet, I would have spent this week debugging agents that were working correctly.
I wrote the pass-three scores back. That is the thing I promised to come back to: the coverage table above is now wrong, and my 30-day figure has moved from 0% to 0.53%. Twelve traces out of 2,246, scored by hand on a Tuesday because I was writing about it. (The denominator grew from 2,207 while I worked, which is another reason a percentage beats a count.) I am not going to dress that up as a fix. Whether it means anything depends entirely on whether it happens again next month without me.
Paid subscribers get the complete build: the tag scheme, the exact metrics API calls that produced every table above, the pricing-coverage trap that silently broke my cost data, the judge context contract that turns a lying eval into a working one, the GitHub template repo, and the report spec that keeps your numbers from going seven weeks stale. The framework and the findings above are free. The working implementation is below.
Comments
Nothing yet. Say the first thing.
Sign in to join the conversation.