
Kelly Partners Group hit an all time high of $13.60 in February 2025. By June of this year it was under $4, down more than 70%. A fall like that usually puts a company on my radar.
This one though is a pass. Even after the fall, and even granting management some very generous assumptions, the return at today’s price sits below my hurdle. The reason is not the business, which is genuinely good. It is a structure that decides how much of this company’s success actually belongs to you, and it is the part that is easy to get wrong.
I know, because I got it wrong too. I first wrote about KPG back in October 2024, and I have to laugh at that article today. I had clearly not done enough work to understand the ownership structure and how the profits get divided. This time we are going to walk through it properly.
* All figures are in Australian Dollars
Welcome to 📉DeepValue Capital📈
I’m Kyler Johnson, a husband, dad, and self taught investor of 7 years.
25K+ subscribers and 259% returns from Jan 2024 to June 2026. I buy turnarounds and good companies at great prices.
Ticker: KPG.AX
Market Cap: ~$180M
TTM Revenue: $147M
Reported P/FCF: ~6.3x
The business itself is very simple. They charge fees for accounting, tax, and wealth services. Small businesses that need their books put together. Owners that need tax planned. Individuals that need wealth advisory and estate work. About 95% of revenue is tax and accounting. Roughly 85% is earned in Australia, with the US at 14% and growing.
Brett Kelly founded the firm in 2006 and has run it since. The model is straightforward. Acquire small accounting practices doing $1M to $5M in revenue, occasionally a larger one at $5M plus, and pull them into Kelly Partners. Layer their operating model on top, move the back office into the group. Then do it again.
63 partnerships since inception. About one a year before the 2017 IPO, about five a year since, and six in the first half of FY26 alone. That approach took revenue from $30M in FY17 to $135M in FY25. About 20% a year, up roughly 350% since the IPO, running at $147M today. The underlying firms grow organically around 4 to 5% a year, about what the industry gives you. The rest has been bought.
And the tailwinds behind the deal flow are real.
Tax codes keep getting more complex, and globalization keeps adding filings.
The accountants who own these small practices are aging into retirement, and AI has added one more reason to sell to a bigger platform. Management says inbound demand for partnerships has been overwhelming, which lets them pick the best fits rather than chase deals.
The deals are structured with some cash up front, some debt, and contingent payments tied to revenue. That last line is important.
Accounting is a relationship business, and tying that payment to revenue makes the selling partner responsible for walking every client relationship through the transition. If clients leave, the seller pays for it. A great structure to keep the books of business they buy intact.
Management’s stated goal is $500M in revenue by 2031, from $147M today. Whether that goal is already in the price, or the market is giving them no credit for it, is what the rest of this article works out.
Here is where my 2024 article fell short, and where most coverage of this company still does.
Most of the time KPG does not buy 100% of these firms. It buys the slimmest possible majority, 50.1%, and leaves 49.9% with the operators running the practice. That is the Partner-Owner-Driver model, and it is a genuinely smart retention structure. The people doing the work stay owners.
But follow what it means for you as a shareholder. KPG reports 100% of revenue and profit at the top line, then splits it later. Right off the bat, the profits of every operating business divide roughly 50/50 between you and the partners.
Then the group layer sits on top of your half, and the group bears three large costs the partners do not.
Interest on the debt, because debt is largely what funds the acquisitions
The back office of running a public company and integrating all these firms
Capex
Stack it up and the numbers change character completely. The group converts about 22 cents of every revenue dollar into operating cash flow. My software looks at that and shows free cash flow margins in the high teens to low 20s. That number is real. It is also not shareholders’.
Walk the actual FY25 cash, straight off the statutory cash flow statement.
Net cash from operating activities came in at $31.3M, already net of interest paid
Subtract lease repayments of $6.4M and you are at $24.9M
Subtract capex of $2.4M, leaving $20.4M
Subtract distributions to the partners of $19.1M, and what remains for shareholders is $3.4M
$135M of revenue in. $3.4M out to you. That is the bridge, and you can run it for every year since the IPO.
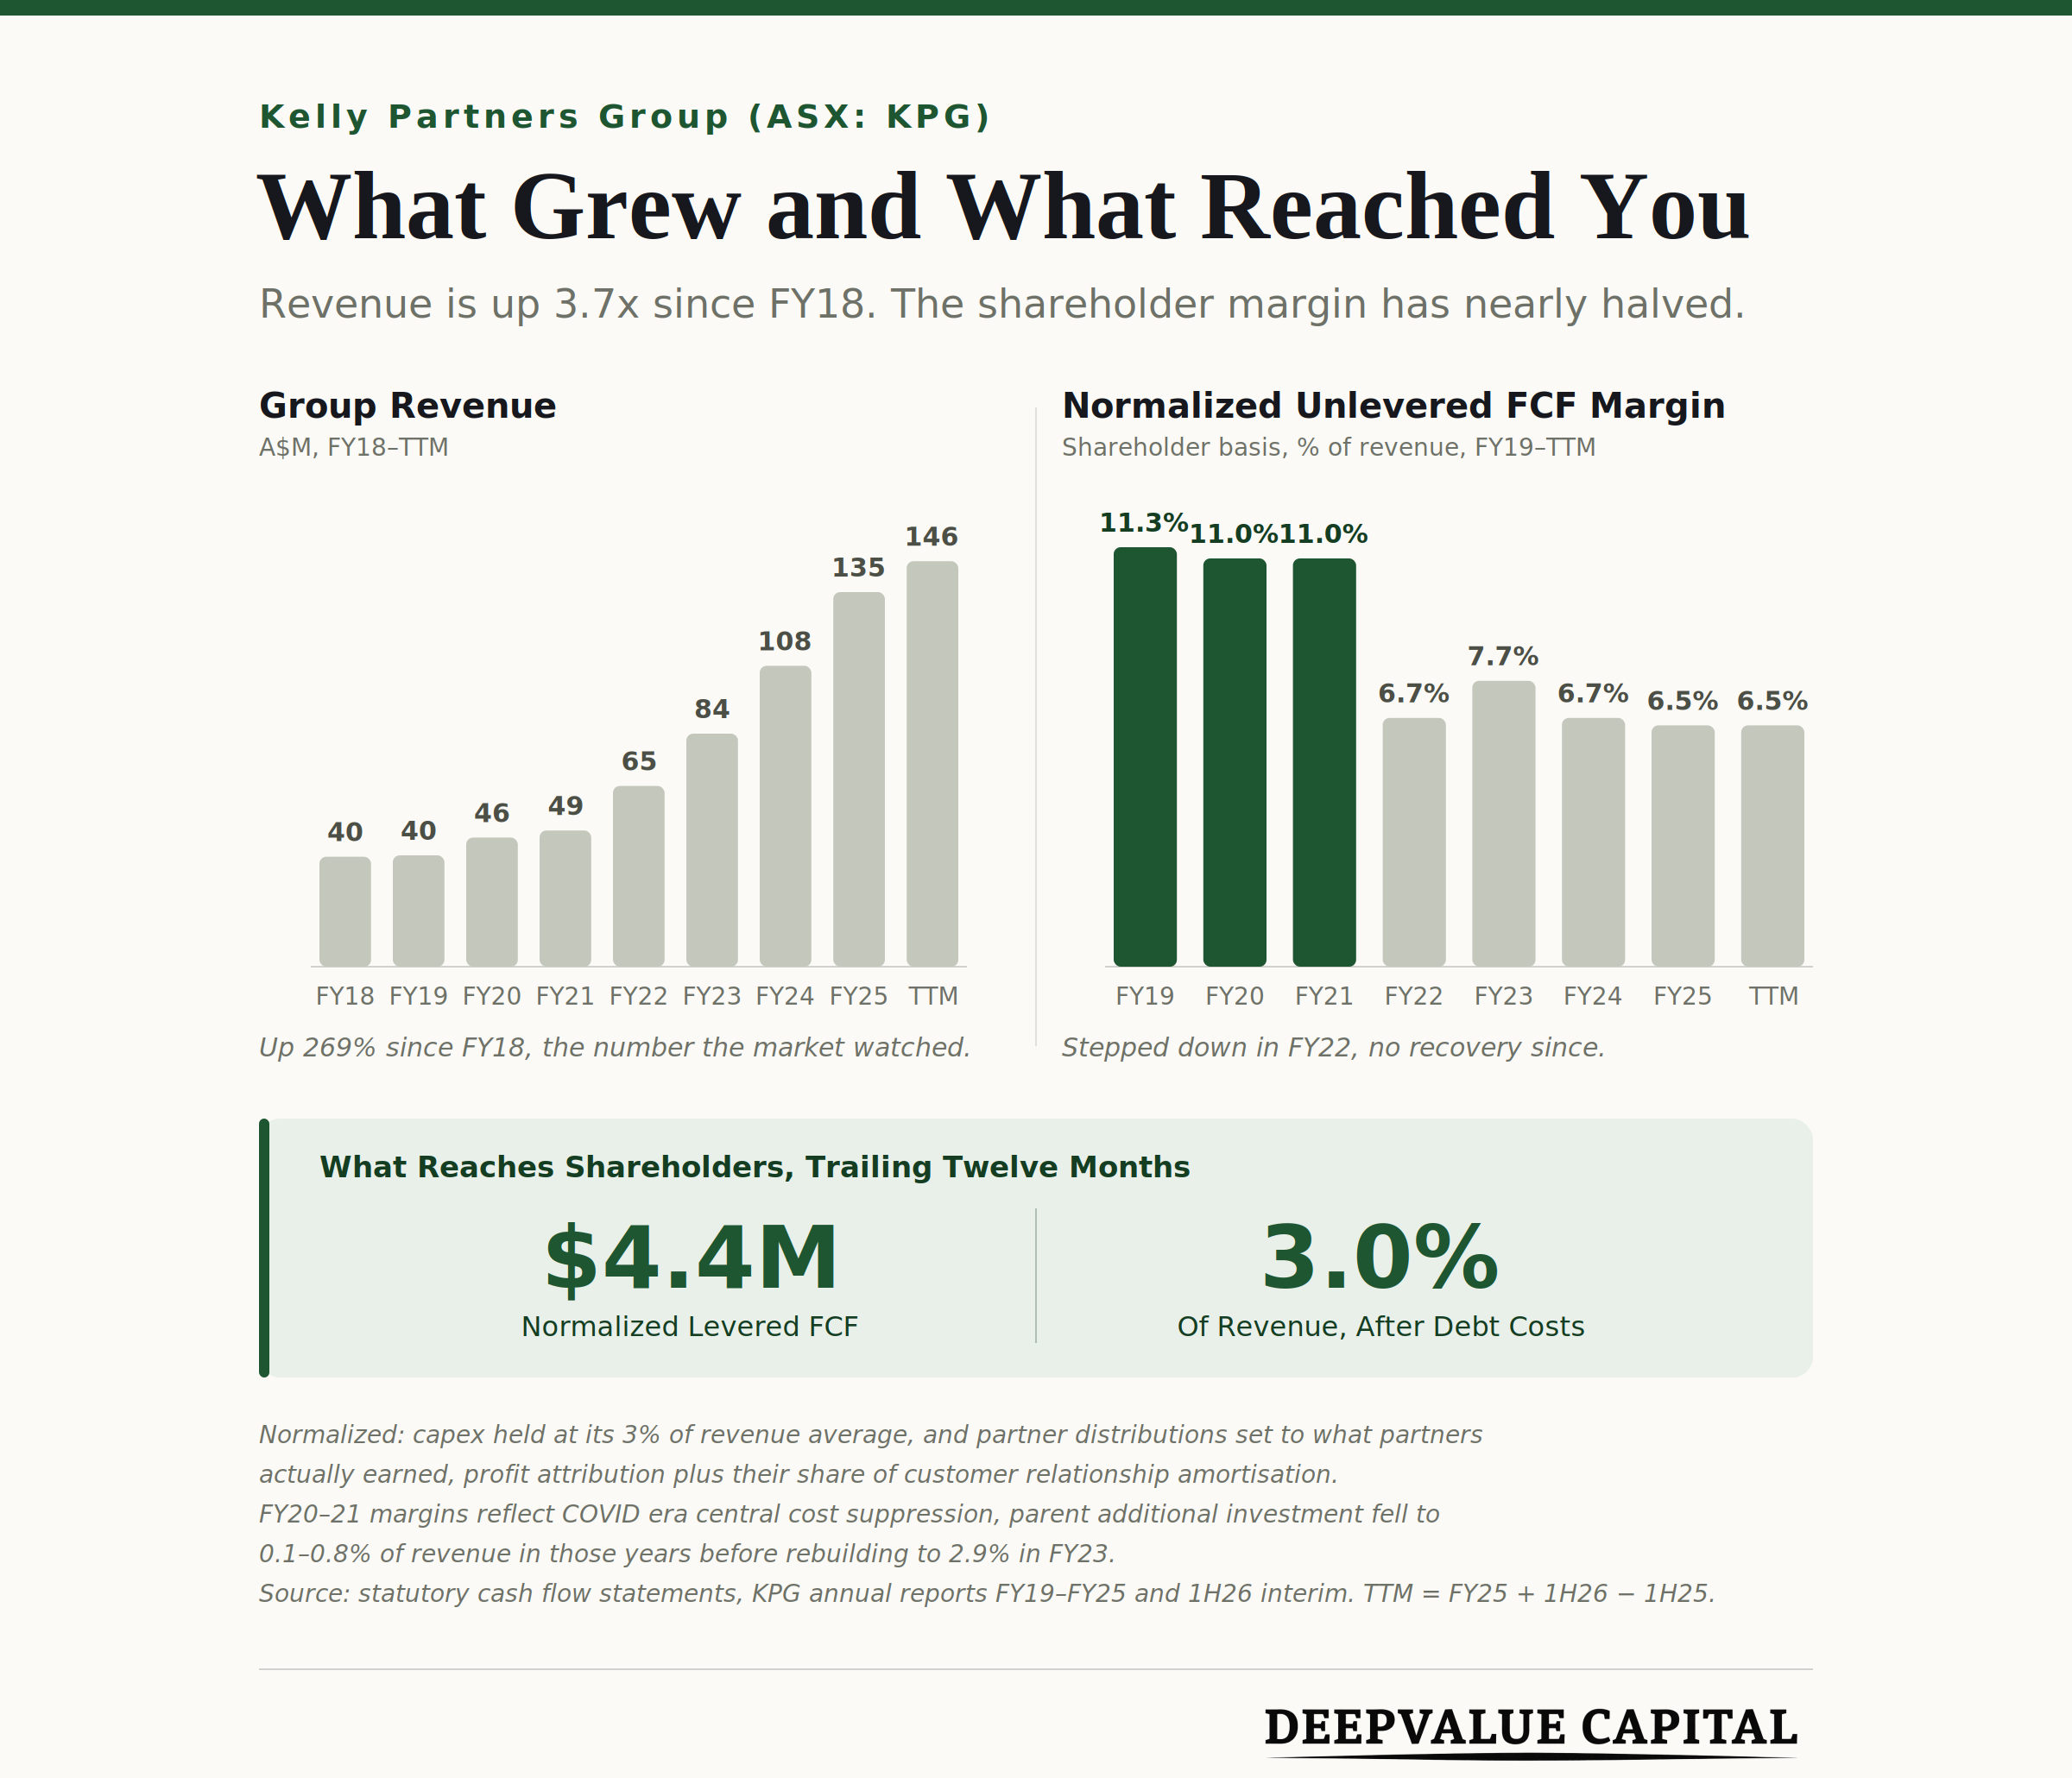
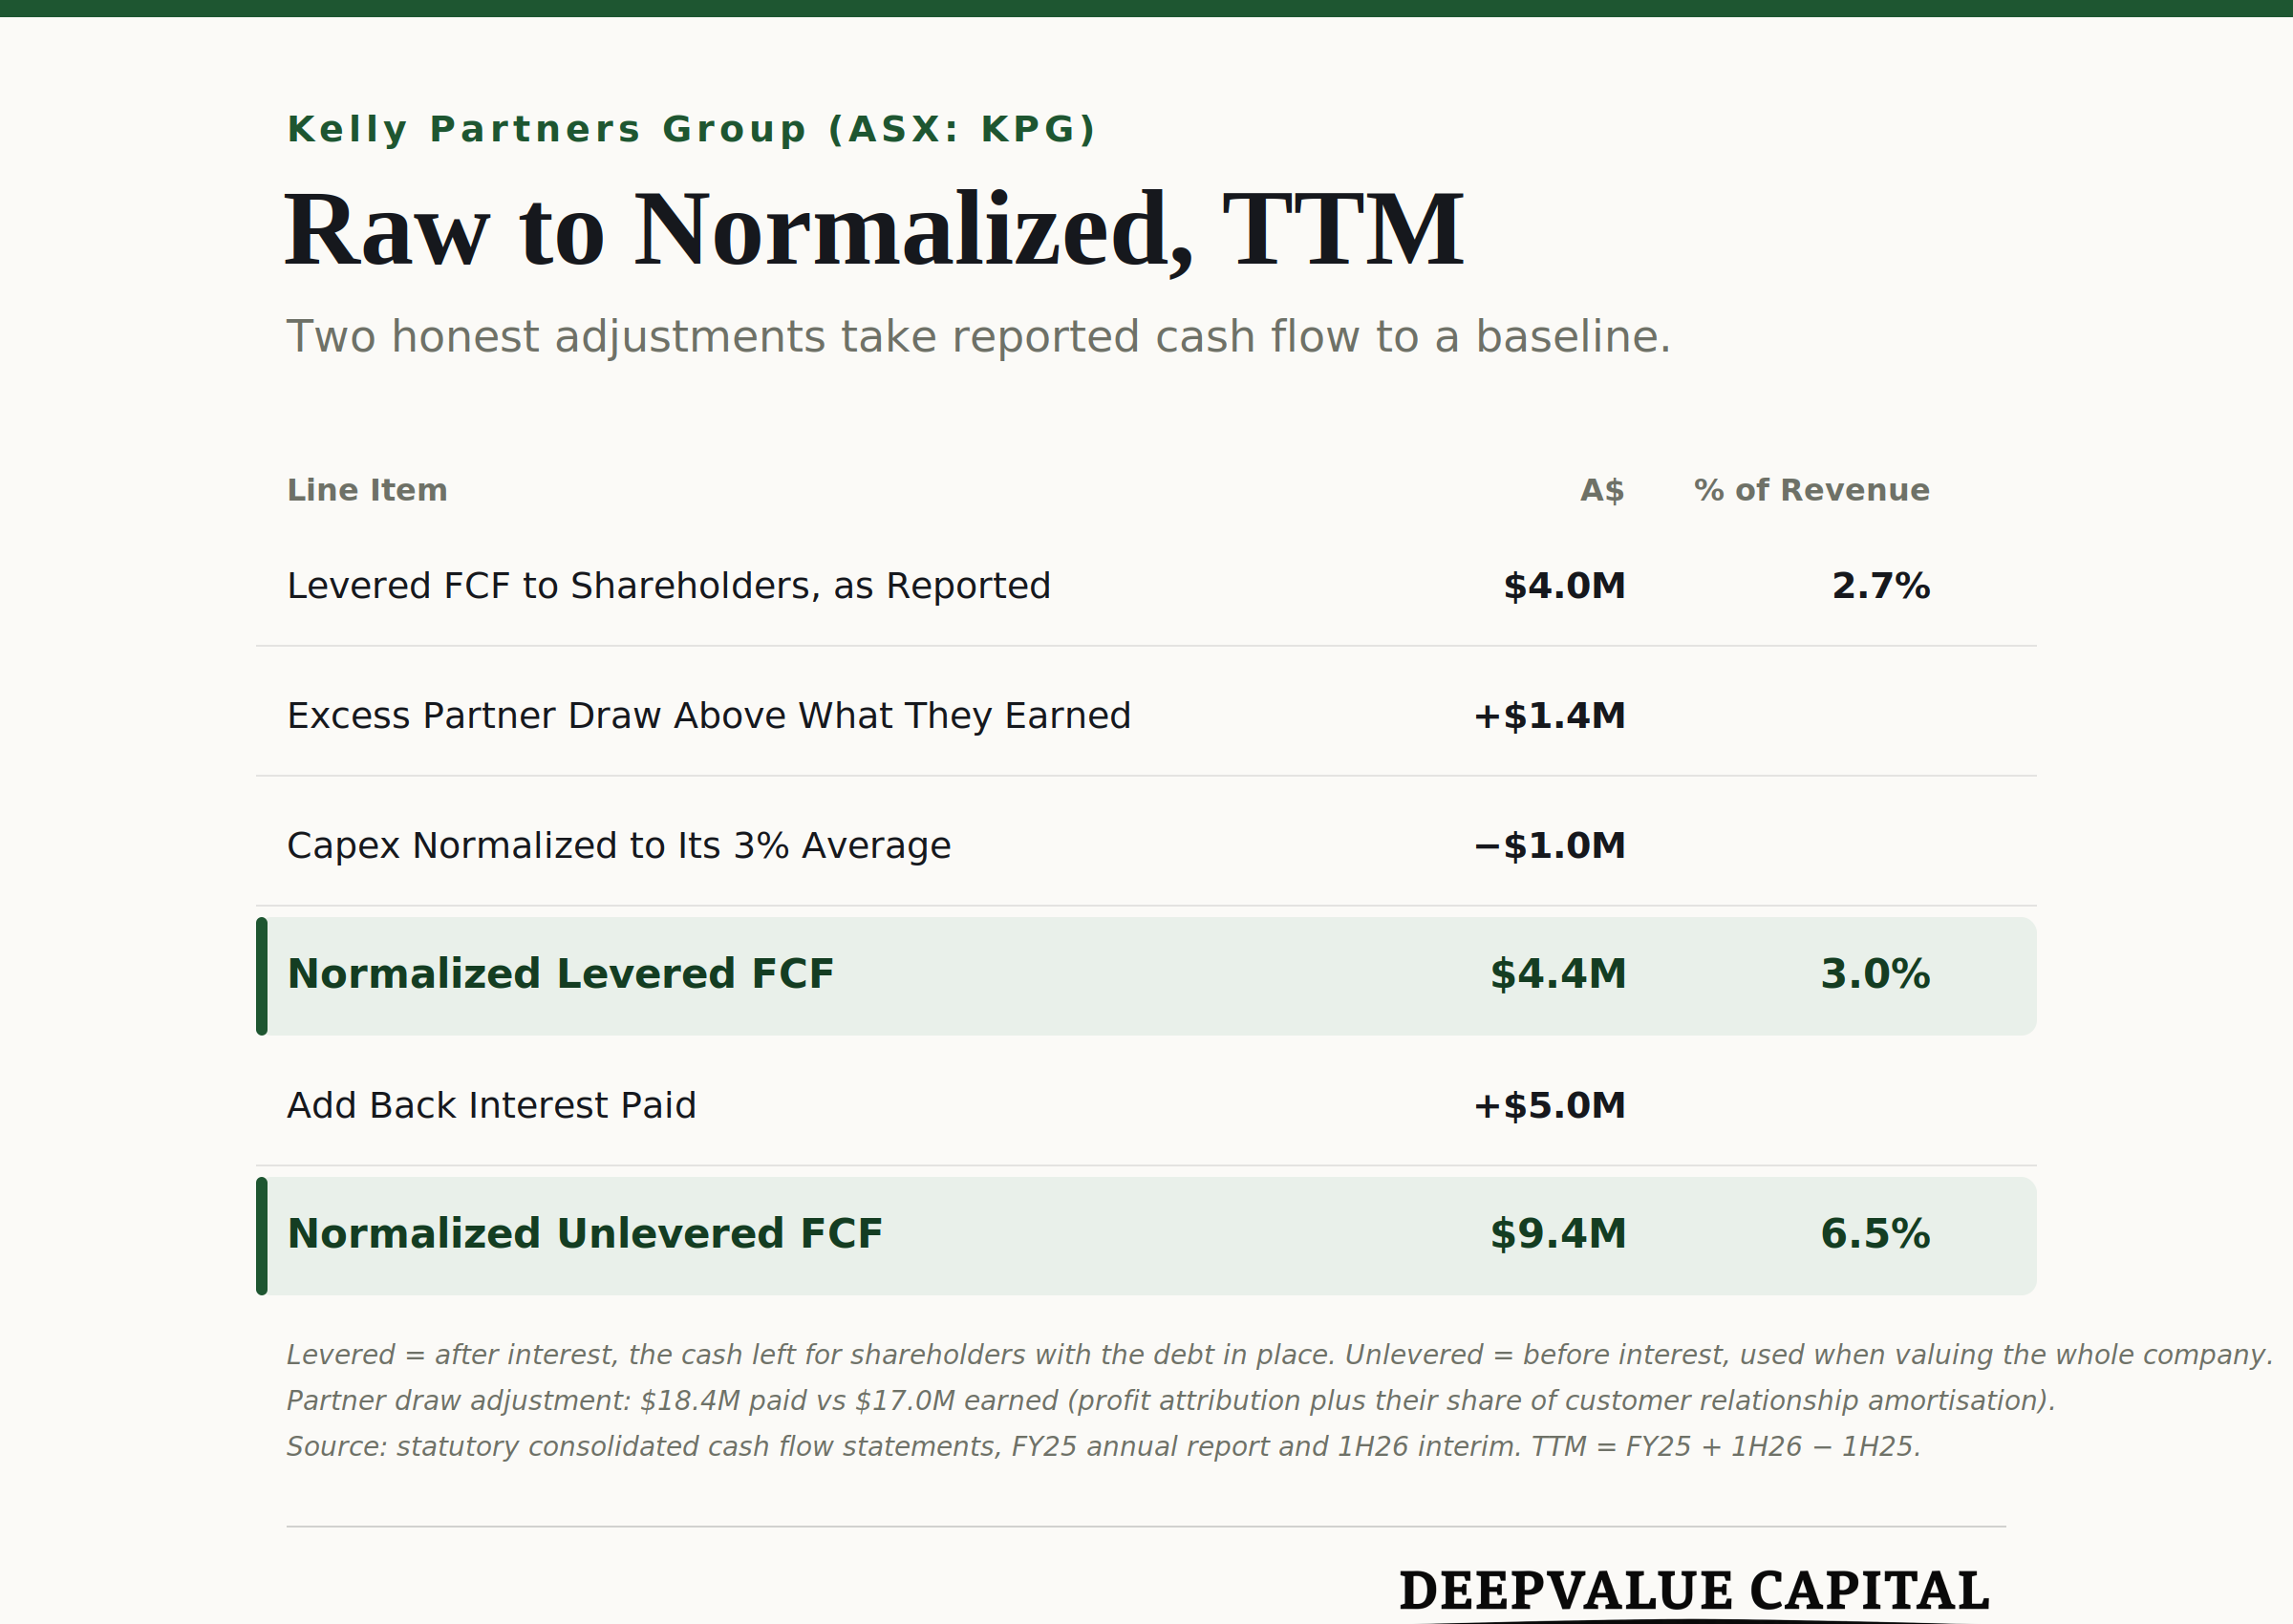
Two lines swing that bridge around from year to year. Partner distributions are a budgeted draw rather than a profit share, so they lump, and FY25 paid partners 115% of what they actually earned. Capex has bounced between 1% and 11% of revenue, averaging a touch under 3%. Normalize both and here is the trailing twelve months.
Run that for every year and the picture stabilizes into something you can actually read. From FY19 through FY21, the unlevered margin ran about 11% of revenue. From FY22 onward it has printed 6.5% to 7.7% every single year. Averaged over FY22 to FY25, the normalized margins are 4% levered, meaning after interest, and 6.9% unlevered, before interest.
The natural read is that something broke in FY22. The honest read is the opposite. FY20 and FY21 were the anomaly, flattered by COVID era cuts to central costs, and when that spending came back, margins went back to what the model produces while acquiring at this pace.
To be fair, the playbook does work at the unit level. The margins of individual firms demonstrably improve after they join. But the group’s own earning power slides sketch operating margins of 30% to 35%, the actual figure has run several points below that for years, and management has called margins strong the whole way. The gap only closes if the deal pace slows relative to the base. Brett Kelly has shown zero intention of slowing down.
So what are you paying today? At the normalized 4% levered margin, $146M of trailing revenue produces $5.8M of levered free cash flow, against a market cap of $177M. Over 30x.
Now, in fairness, expensive is allowed when the returns are exceptional. This company has grown 20% a year for seven years, and management’s own return on invested capital calculation has run between 20% and 31% for nine years, call it mid 20s.
For a normal company at that price, the question is simple. Can they keep it going? For KPG the question is twofold. Can they keep it going, and how much of it actually belongs to you? For now I am going to set the first question aside and give them the benefit of the doubt. The second question is where this company has been misunderstood, including by me.
Management publishes two return numbers, and the gap between them is the most important thing in this article.
The first is Group ROIC, 24.8% in FY24 and 23.0% in FY25. The group number is calculated on everything at once. It includes the profits that belong to the partners, and it is earned on capital that is substantially borrowed.
The second number is new in the FY25 presentation. Parent ROIC, the return on the capital that belongs to ASX shareholders specifically. 21.5% in FY24. 16.6% in FY25.
Why is the shareholder’s return lower than the group’s? Their own disclosures answer it. In FY25, operating profit before group costs split almost exactly down the middle. $13.1M to the partners, $13.9M to the parent. Proportionate, just as the 50/50 ownership suggests.
Then the parent’s half, alone, paid the interest, the additional investment in the back office, the deal and review costs, the tax, and the depreciation. $10.5M of costs the partners never touch. What reached shareholders was $3.4M.
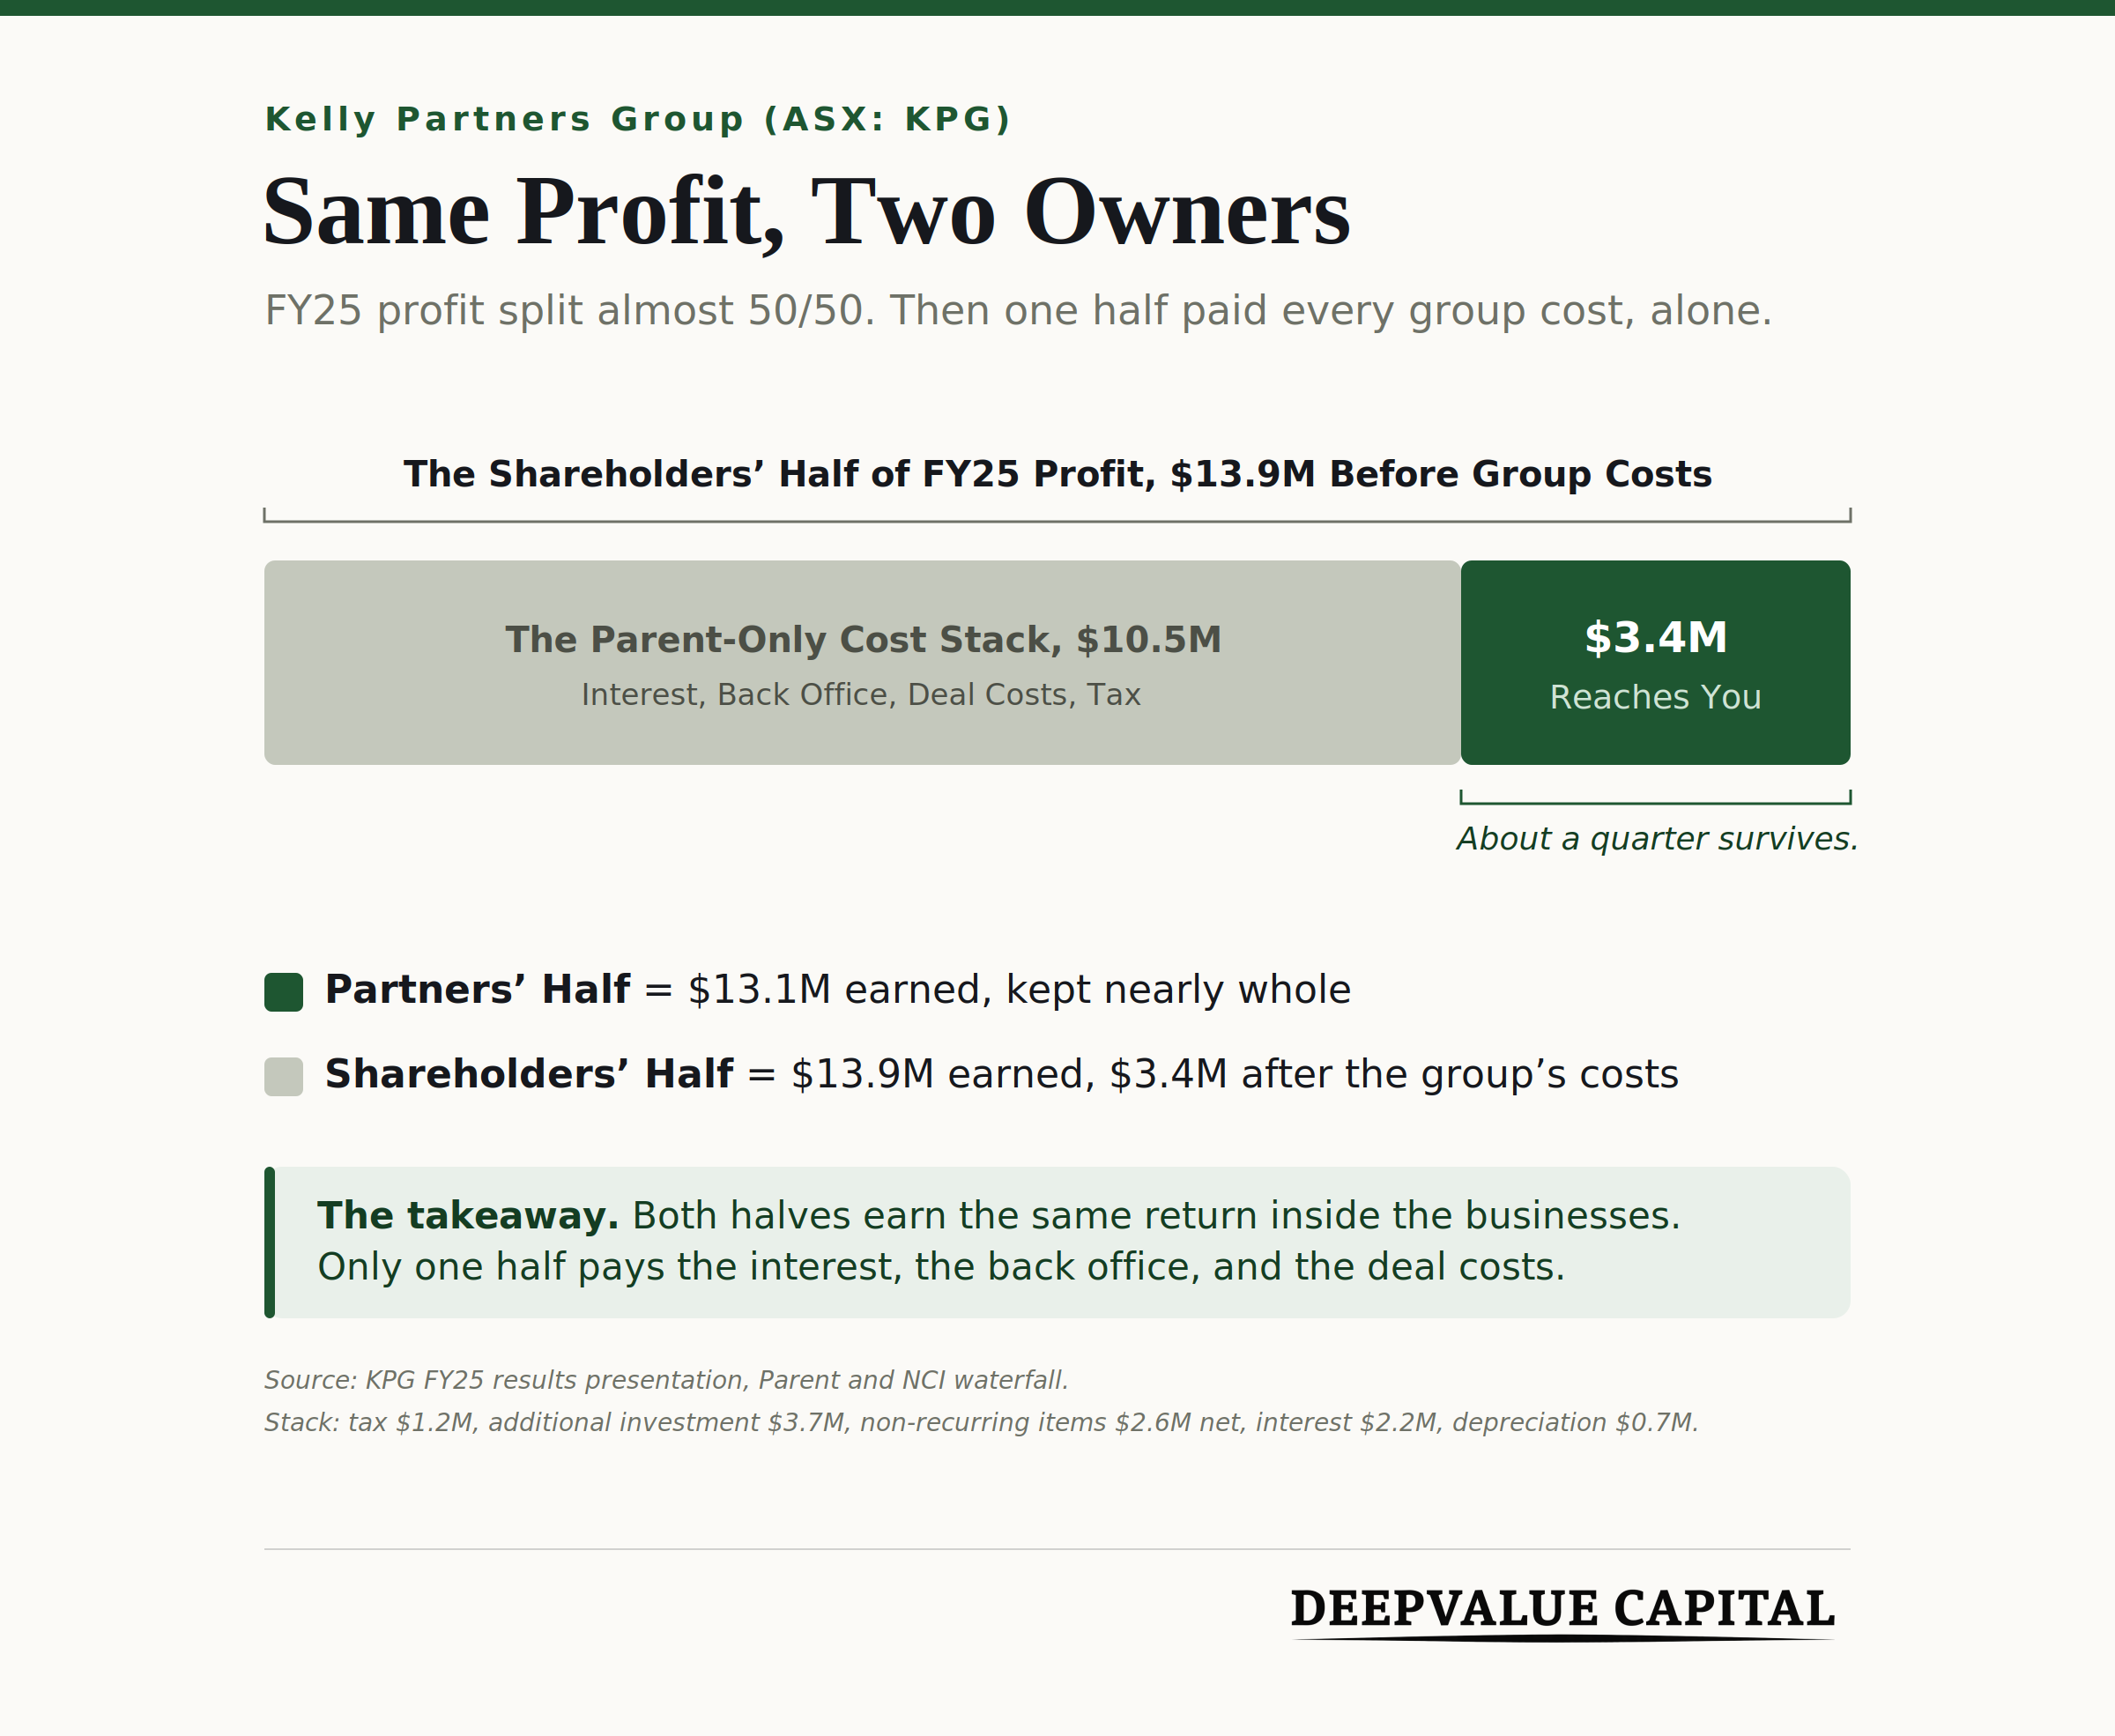
Both halves earn the same return inside the operating businesses. Only one half pays the group’s bills. That is the entire gap between the company’s return and yours.
Two fair caveats push that 16.6% in opposite directions, part year timing on new deals flatters it downward, generous add backs flatter it upward, so call the honest return on shareholder capital mid teens.
Mid teens on shareholder capital, plus 4 to 5% organic growth that costs almost nothing to achieve, is a genuinely good business. It is not the 27.5% a year you get by adding the group's 23% return to organic growth, which is how their own deck frames it. Keep that number in hand, because it decides what the growth is worth paying for.
So let me hand management every assumption and see what today’s buyer earns.
Grant all of the following.
They hit $500M of revenue by 2031. That means maintaining the pace they have run since 2020 for another five years. Brett Kelly owns roughly 39% of this company, has hit the targets he set before, and has real prowess. It is possible. It is certainly not easy.
Margins normalize on schedule. At a 7% unlevered free cash flow margin to shareholders, the 2031 business produces about $35M.
The buildout stays debt funded, as it has been. Net debt grows to roughly $280M.
A buyer in 2031 pays 20x unlevered free cash flow for the whole company.
Why 20x? Think about what a buyer of the whole company is doing. They pay off the $280M of debt and own the business outright. With the debt gone, the debt funded acquisition engine goes with it, and what they are left holding is the organic business, sticky compliance work growing 4 to 5% a year. 20x unlevered free cash flow is a full price for that, and it is not a stingy grant. Measured against the levered cash flow with the debt still in place, the same equity price works out to about 32x. Plenty of credit for growth is already inside it.
Run the math. 20 x $35M is $700M for the whole company. Subtract the $280M of debt and the equity is worth about $420M in 2031. Today’s market cap is $177M. That is 2.4x your money over five and a half years, or about 17% a year.
Seventeen percent a year is a solid return. Nothing to scoff at. But look at what it took to get there. The full $500M, the normalized margins, a full multiple at the end, and a path that runs through a single founder, a growing debt load, and five more years at a pace that is hard to sustain. A solid return for everything going right is below my hurdle, with no cushion for anything going wrong.
Pass at today’s price. The business is good, but the return is clearly below my hurdle rate, even after giving them the benefit of the doubt on some lofty assumptions.
Around $2.50 a share is where I would start to get interested. At that price the same give-them-everything math pays about 27% a year, and the harder questions become worth digging into. Whether they can actually hit those targets. What AI does to a business built on compliance work. I am not sure we get there.
Until then, this one is a pass, worth keeping an eye on margins and growth. A great collection of businesses, a founder with conviction, and a structure that hands the public shareholder a few cents of every revenue dollar. The market fell more than 70% and still prices this company for a lot of things going right.
You just read a breakdown of a new idea, free, with nothing held back. What members get is the portfolio itself, the names I actually own with full deep dives, the buy and sell calls, and updates as each thesis plays out.
If that's the kind of work you want in your inbox, that's what a paid membership is.
To read my full disclaimer click here.
Comments
Nothing yet. Say the first thing.
Sign in to join the conversation.