July 2026: New bottleneck finder tool and better data export
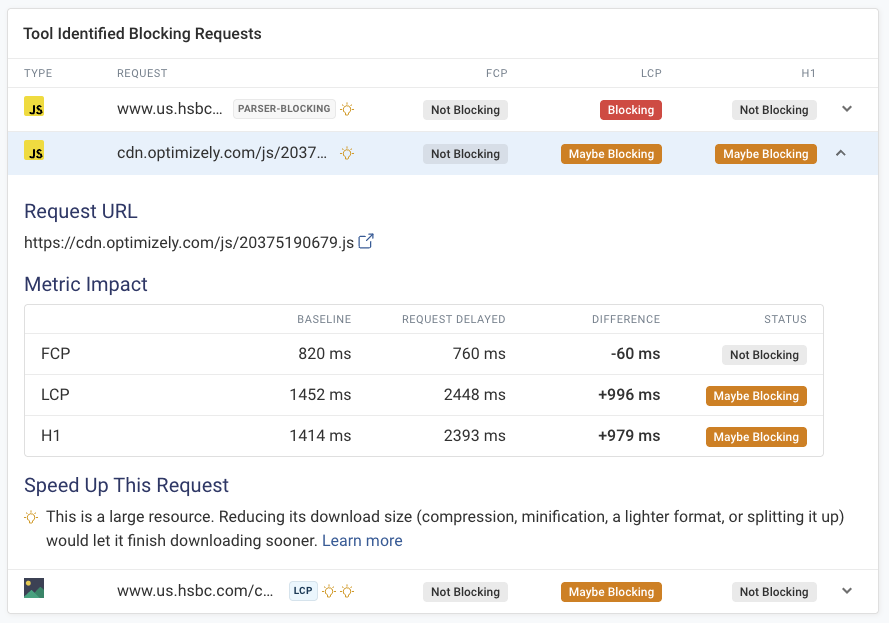
Introducing our new bottleneck finder tool, individual chart exports for custom dashboards, improved comparison data, bulk region editing, and HAR waterfall exports.

DebugBear Blog
Live Last read · last published · next check
Introducing our new bottleneck finder tool, individual chart exports for custom dashboards, improved comparison data, bulk region editing, and HAR waterfall exports.
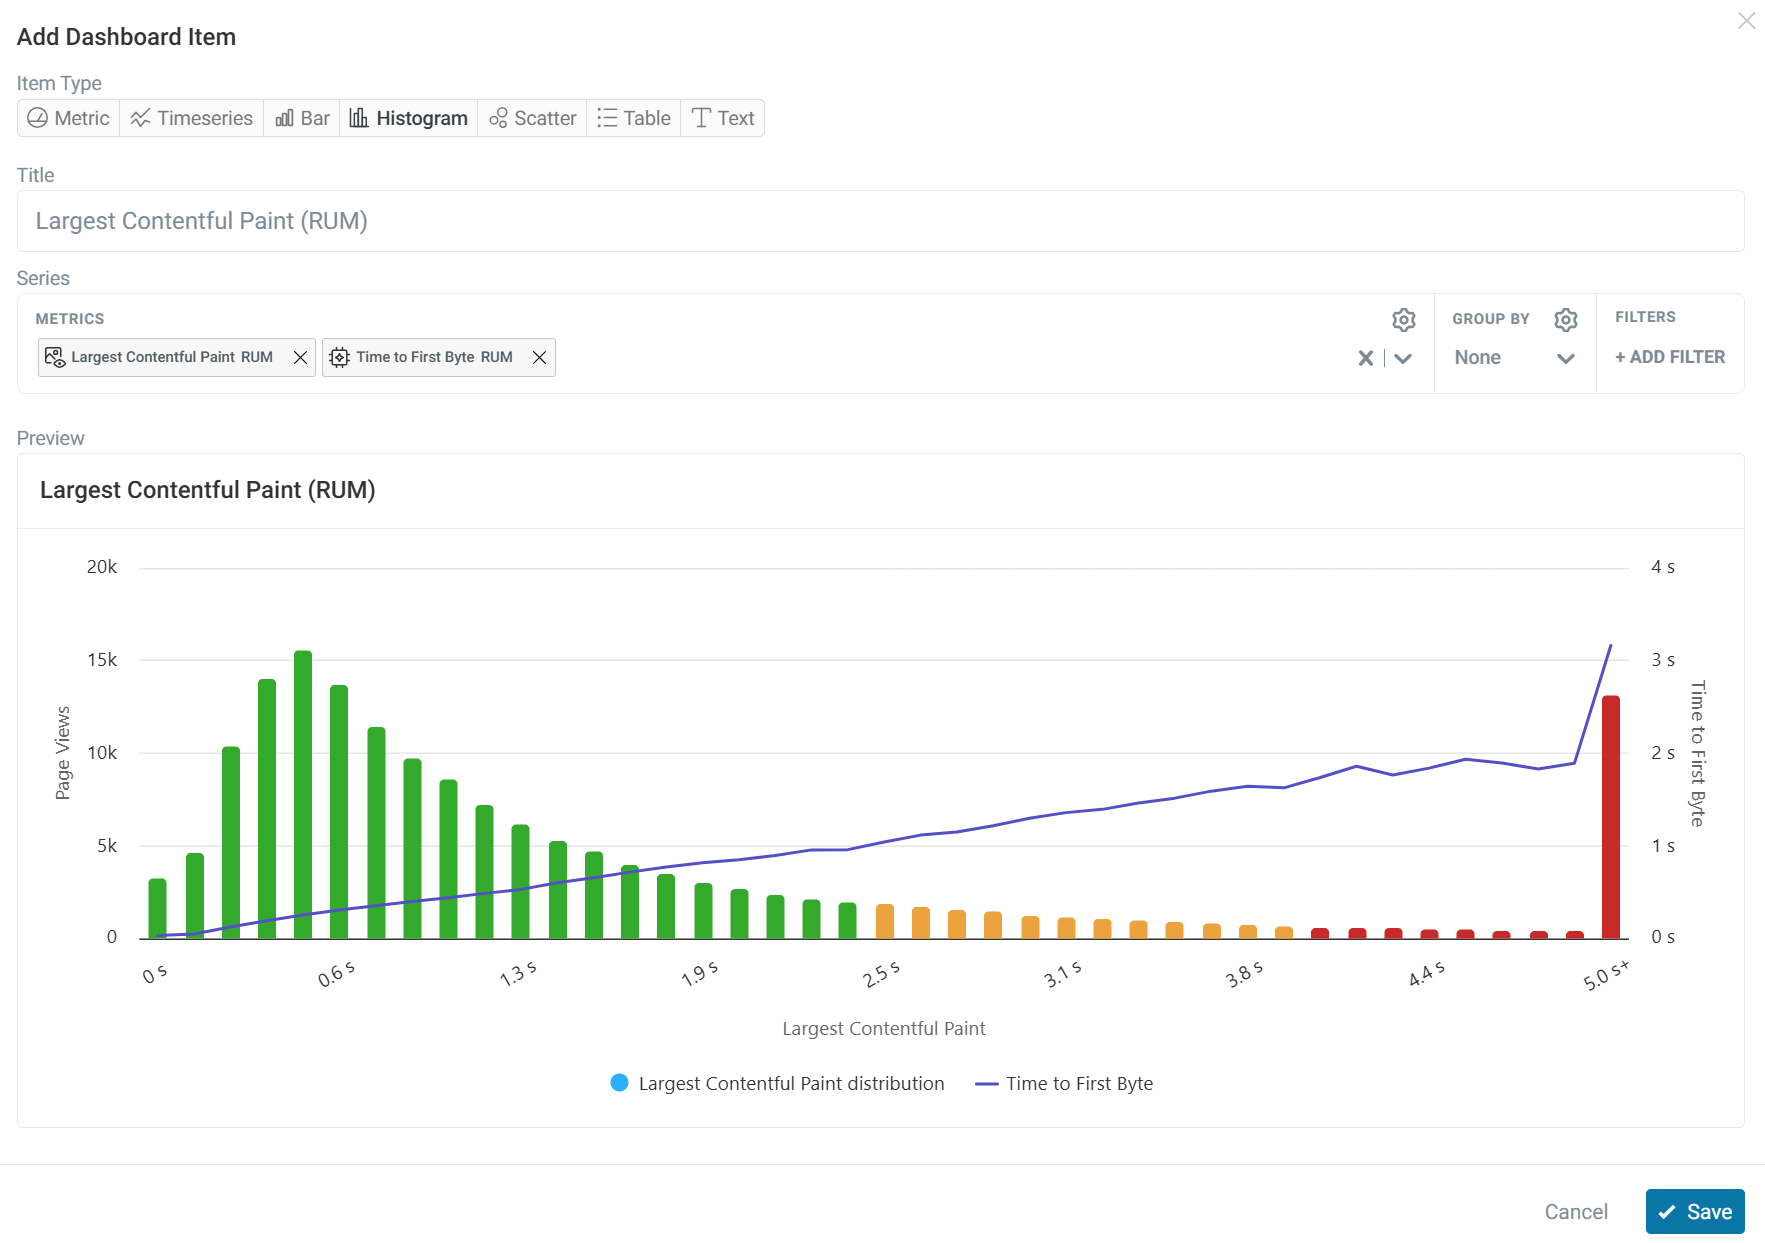
Introducing histogram and scatter plot charts for custom dashboards, plus a new DebugBear MCP server for Claude, ChatGPT, and Cursor.
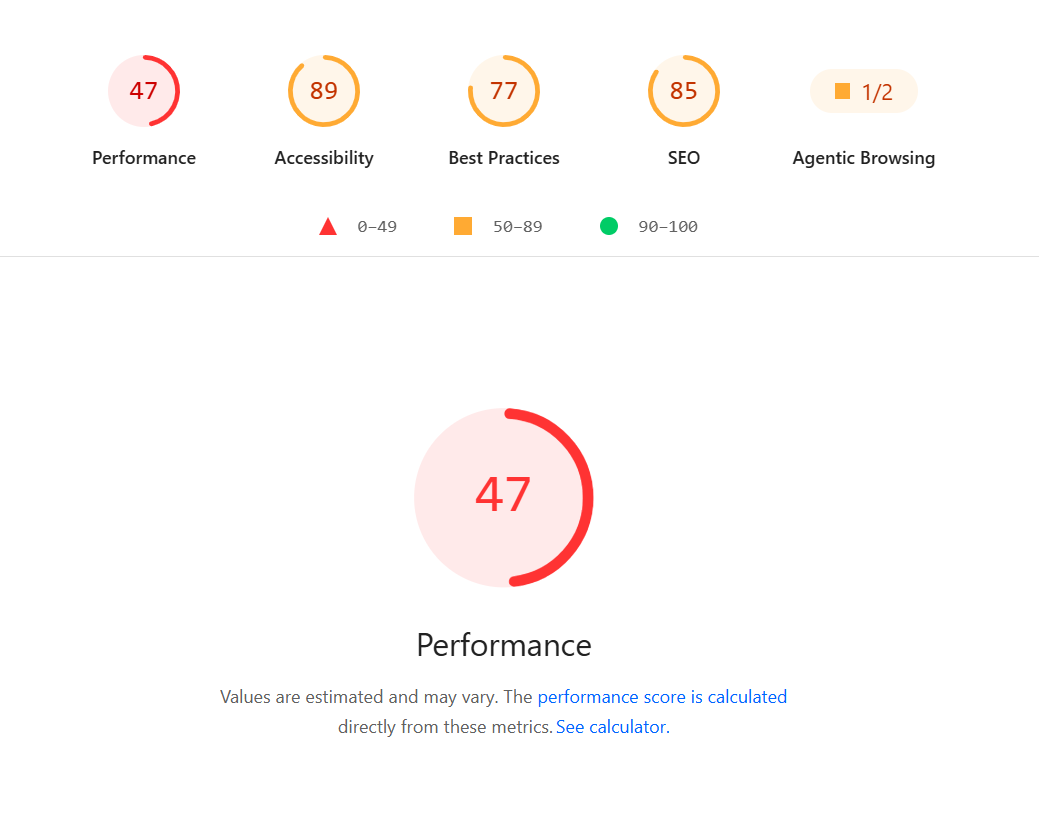
A new Lighthouse category for agentic browsing, quick tests for one off analysis, AI agent prompts, custom DNS mappings, and dashboard filters.
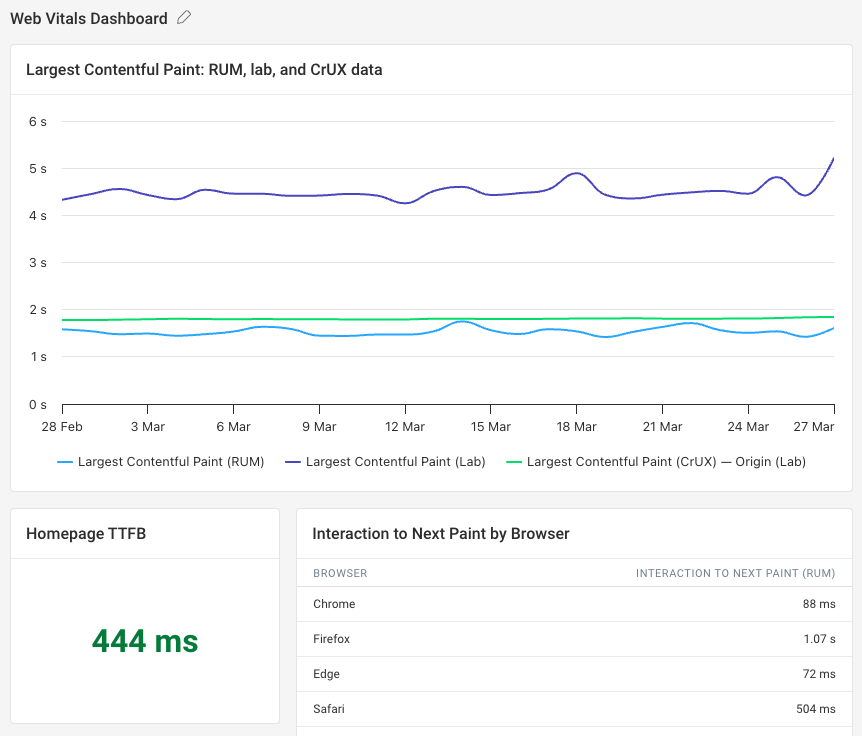
Custom dashboards are now available, along with Lighthouse and Chrome upgrades and a new CLS tool.
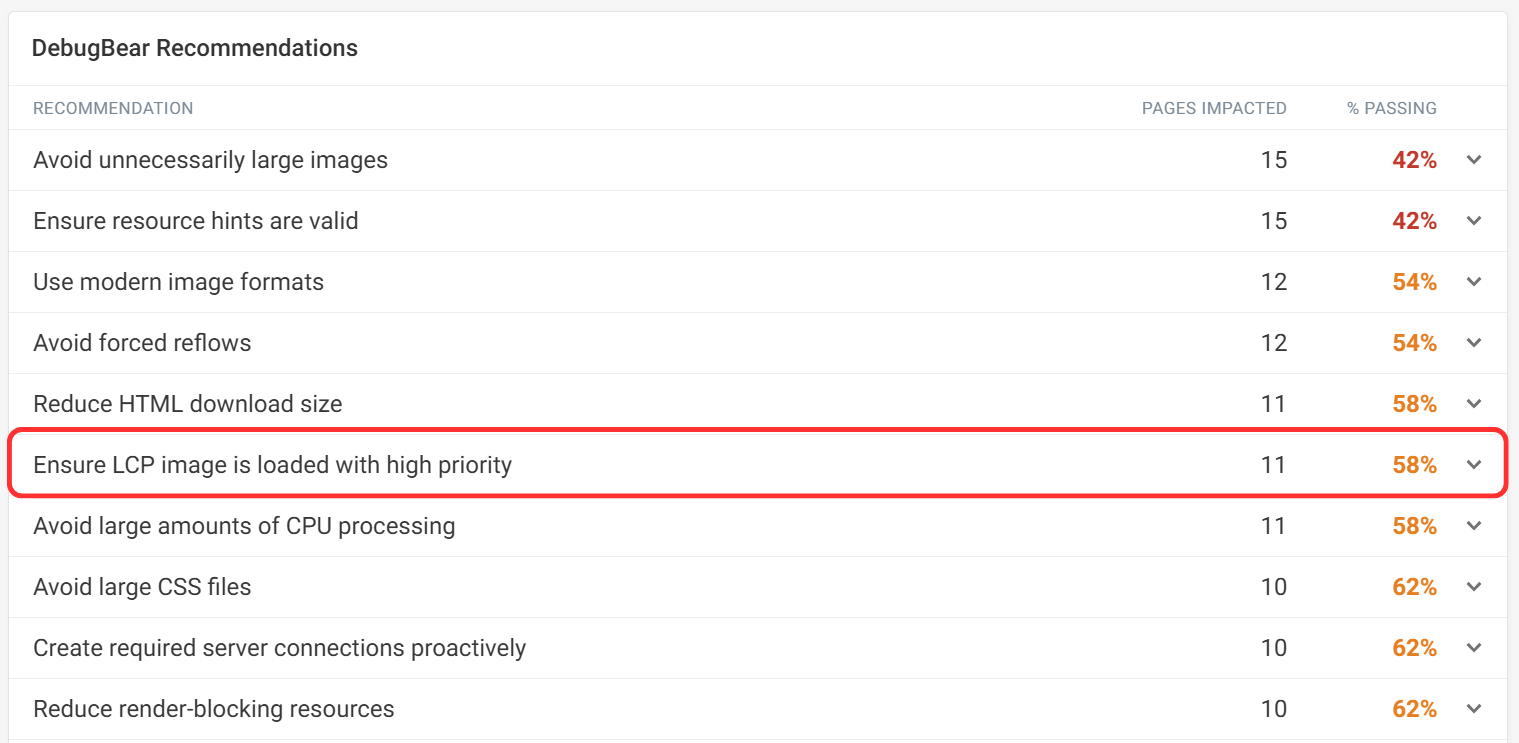
Aggregate audits tab, categorized free tools, and Lighthouse code coverage in the request waterfall.
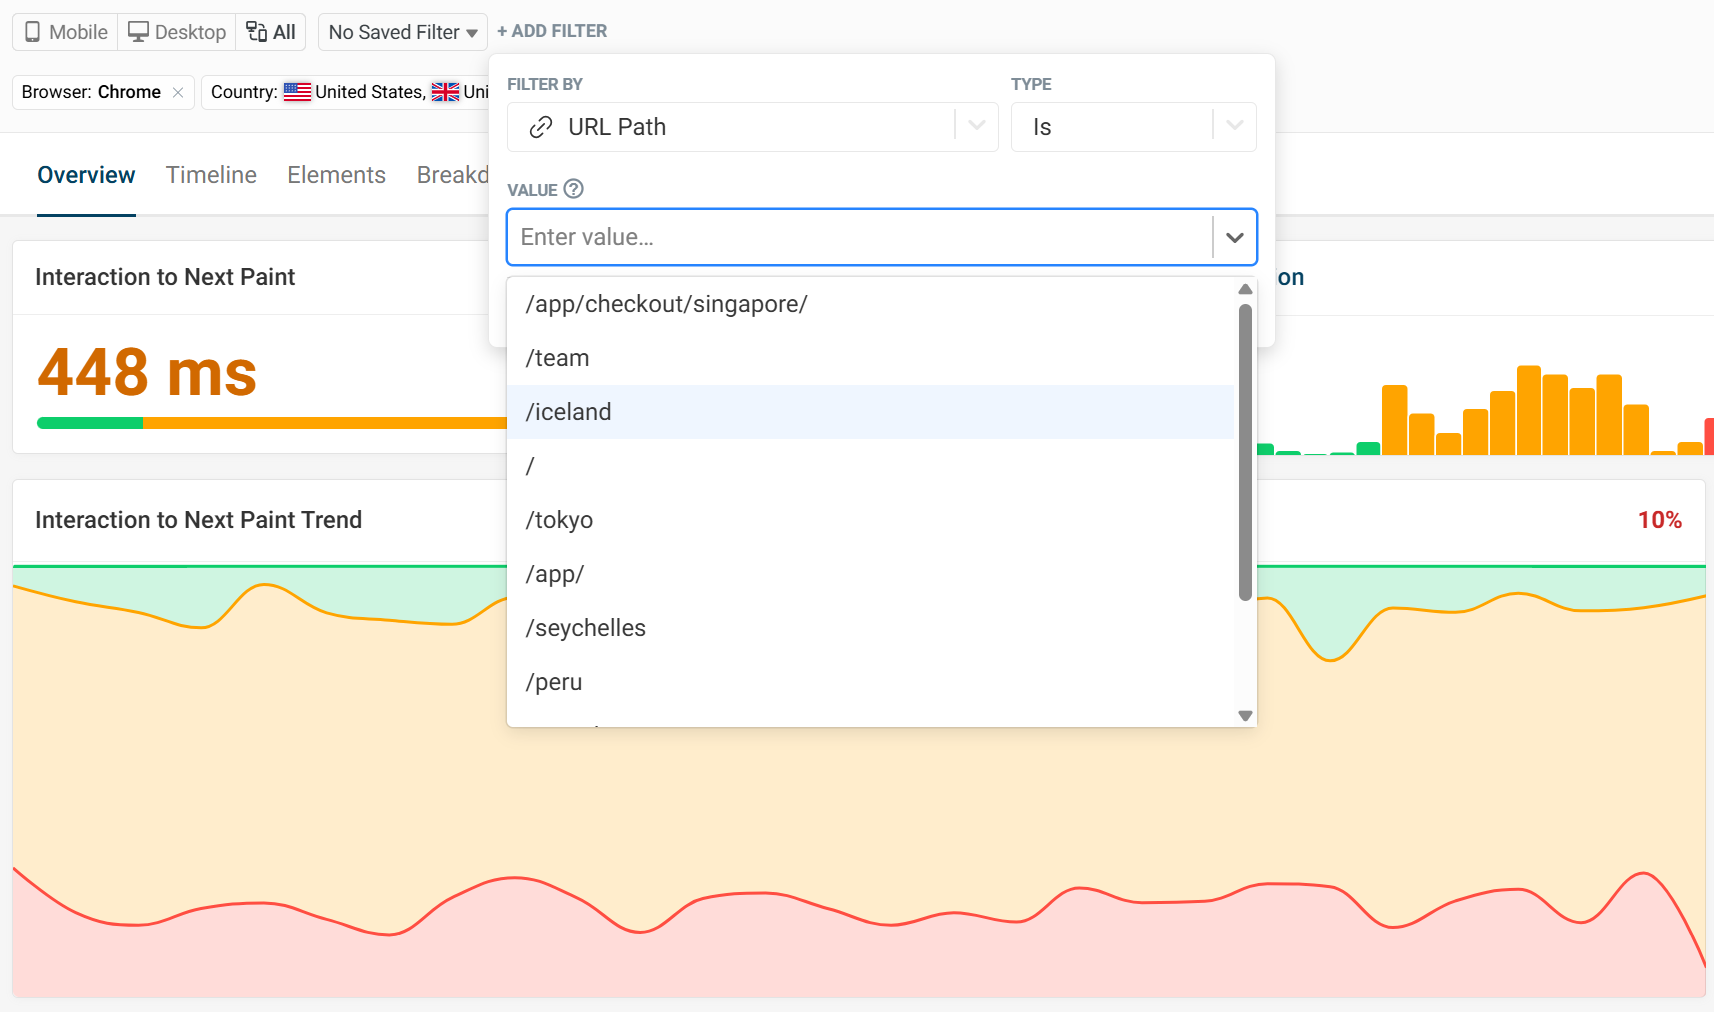
Improved lab and RUM filters, new dashboard table view, and enhanced website scan reports.
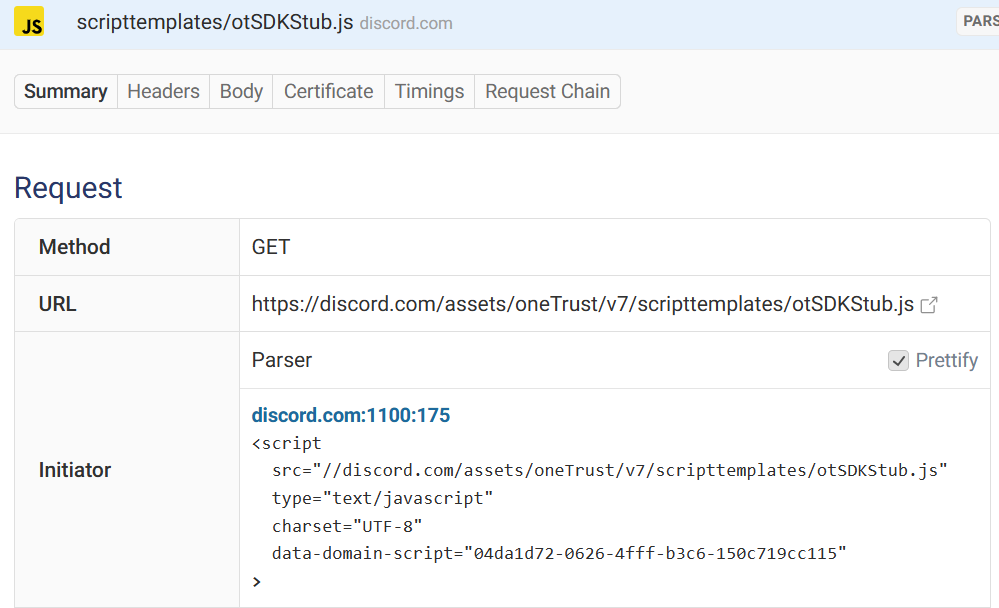
Improved request initiators, as well as request waterfall exports and API improvements.
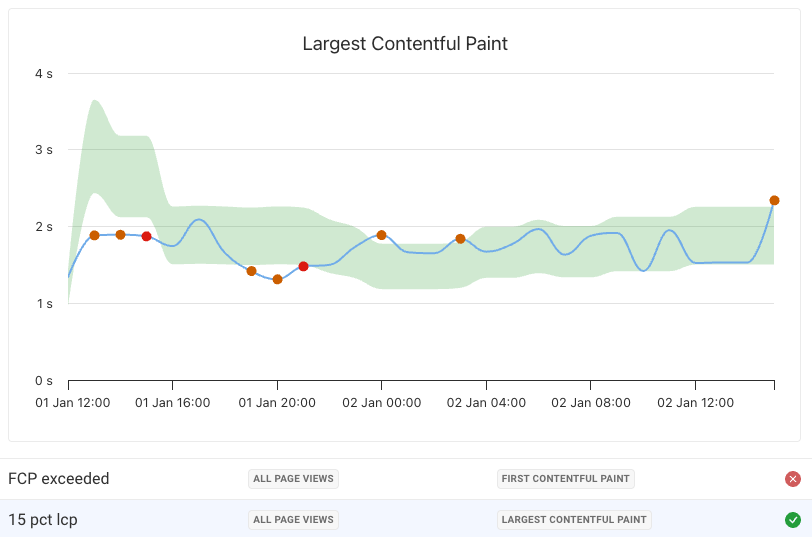
Improved RUM alerting, better synthetic notifications, network request statistics, and session tracking updates.
We've been working on making it easier to measure the business impact of performance, and analyze your synthetic test results.
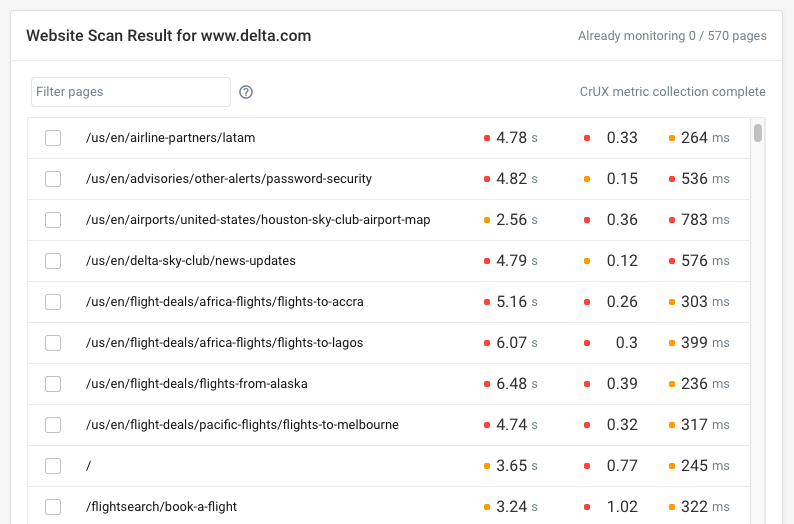
New features including CrUX website scanning, INP measurement in synthetic tests, oversized font detection, 5 new test regions, RUM API improvements, and LoAF data in the INP Debugger.