
Here we are at the fifth edition. I keep a running note on my phone of charts that stop me mid-scroll, and when I get to about a dozen, I know it’s time to write another one of these posts. These are visuals I encounter in news articles, social media, or books. Many are counterintuitive or surprising in some way. Sometimes they challenge what I thought I knew. Sometimes they confirm something I’d felt but hadn’t seen in the data.
Great visualizations make the invisible visible. They help us see patterns too slow or too large to notice in daily life. And sometimes, they make me rethink something I was sure I already understood.
If you want to explore the earlier ones, here are the previous editions:
Here’s what caught my attention over the past few months.
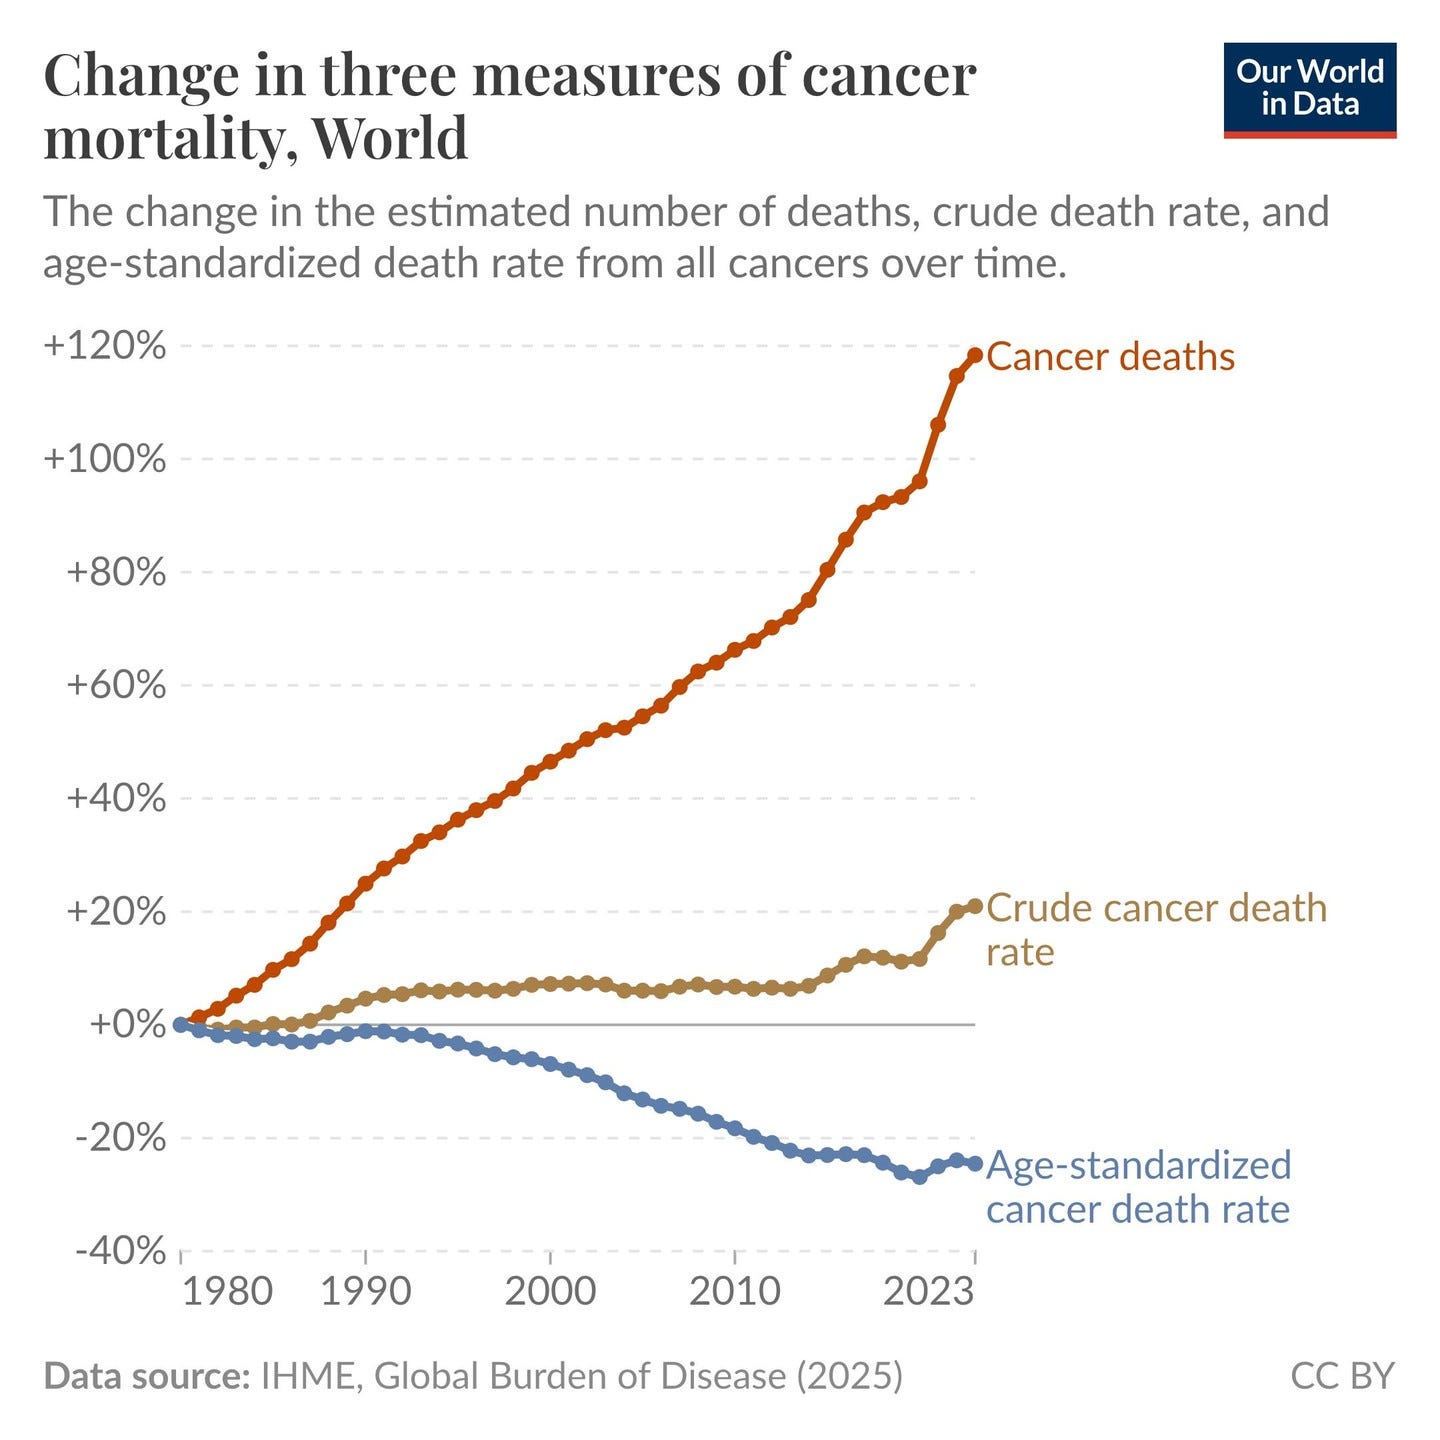
At first glance, the red line is alarming: cancer deaths worldwide have more than doubled since the 1980s. It looks like we are losing the fight against cancer. But the story is more complicated and hopeful than it appears.
The raw number doesn’t account for the fact that the world’s population has grown enormously over this period, and that people are living longer. When you adjust for both population growth and age, the age-standardized cancer death rate has actually declined.
This chart stopped me because it’s a perfect illustration of how the same data can tell completely different stories depending on how you frame it. Raw numbers without context can mislead us, and it’s important to understand that context.
Source: World Happiness Report 2025
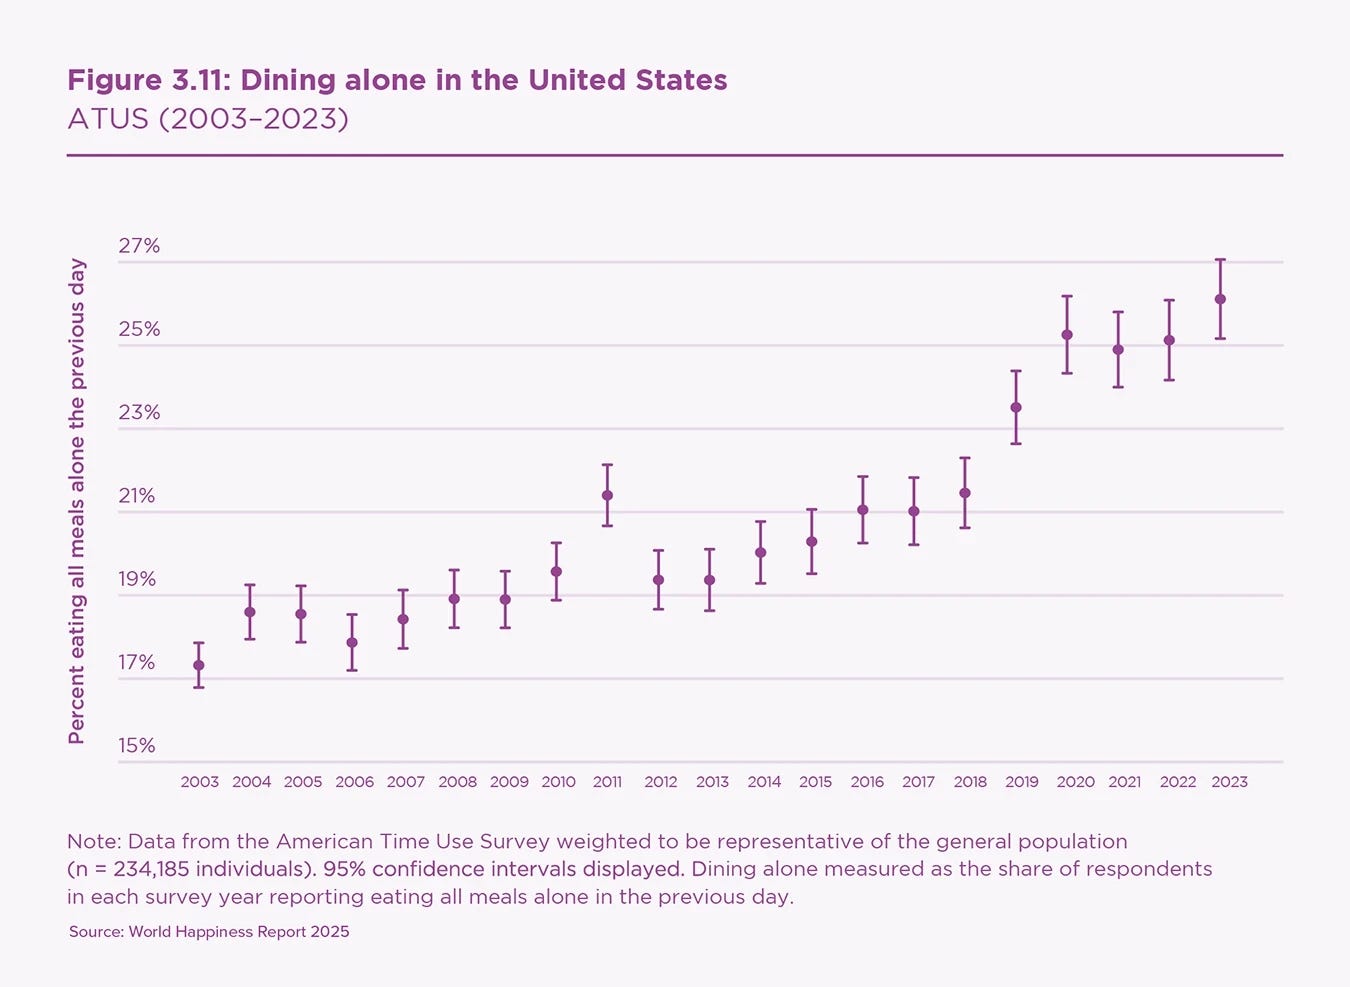
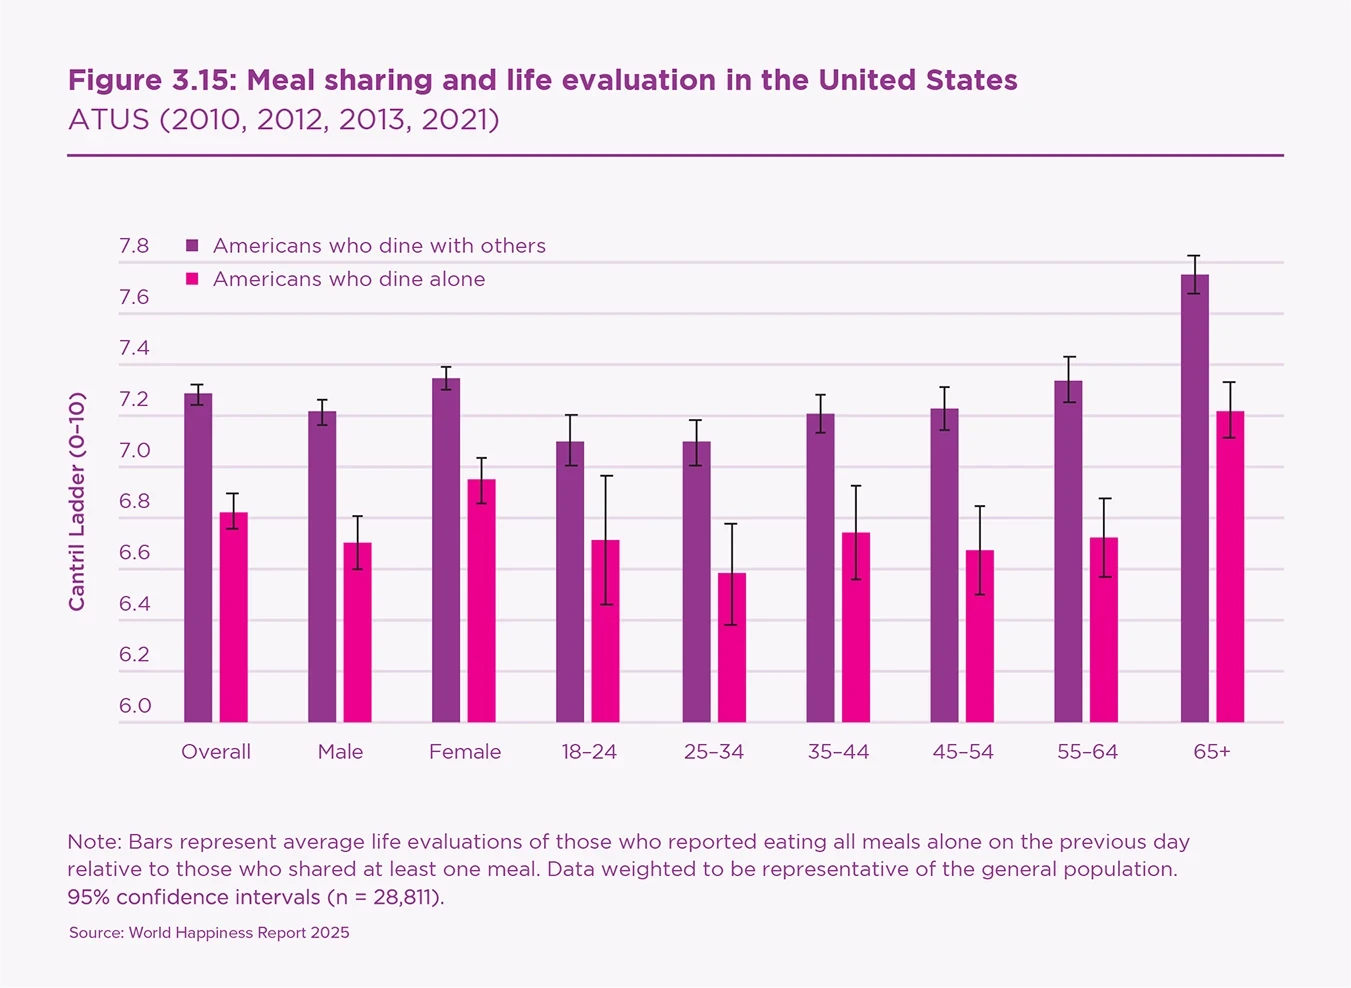
According to the American Time Use Survey, Americans are eating all their meals alone 53% more than they did 20 years ago. Research shows that sharing eight or more meals a week with other people provides the same happiness boost as doubling your income. Those who eat with others rate themselves much higher on life satisfaction.
I think about my own life and how many of my closest relationships were built around a table: family dinners, team lunches, breaking bread with friends. Food is how we slow down long enough to connect and spend time together. As more people live alone, it becomes harder to find connection and community with others.
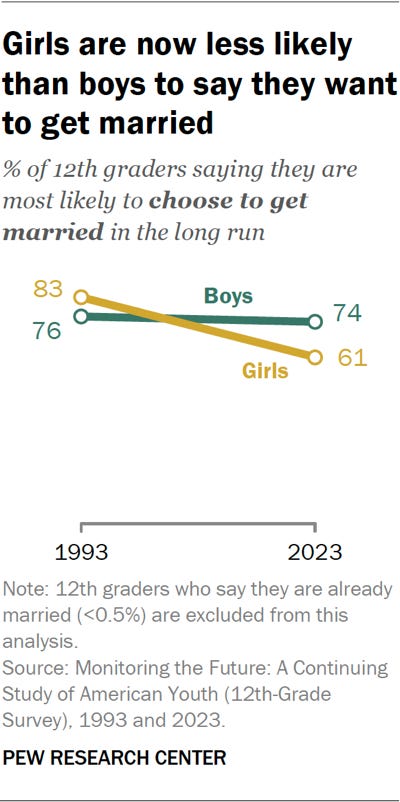
In the fourth edition, I shared a chart showing that young men are becoming less supportive of gender equality. This chart shows the other side of that shift: girls are now less likely than boys to say they want to get married. In the 1970s, girls were more eager to marry than boys. That has reversed.
These two charts speak to a larger trend. When one group signals that it doesn’t value or respect the other, it changes what the other group wants. Women are increasingly financially independent, educationally ahead, and less willing to enter relationships where they aren’t treated as equals. These aren’t disconnected trends.
What I find so important about data like this is that it makes visible something that has been quietly building for years. Culture is changing what people want, and what people want is changing the landscape.
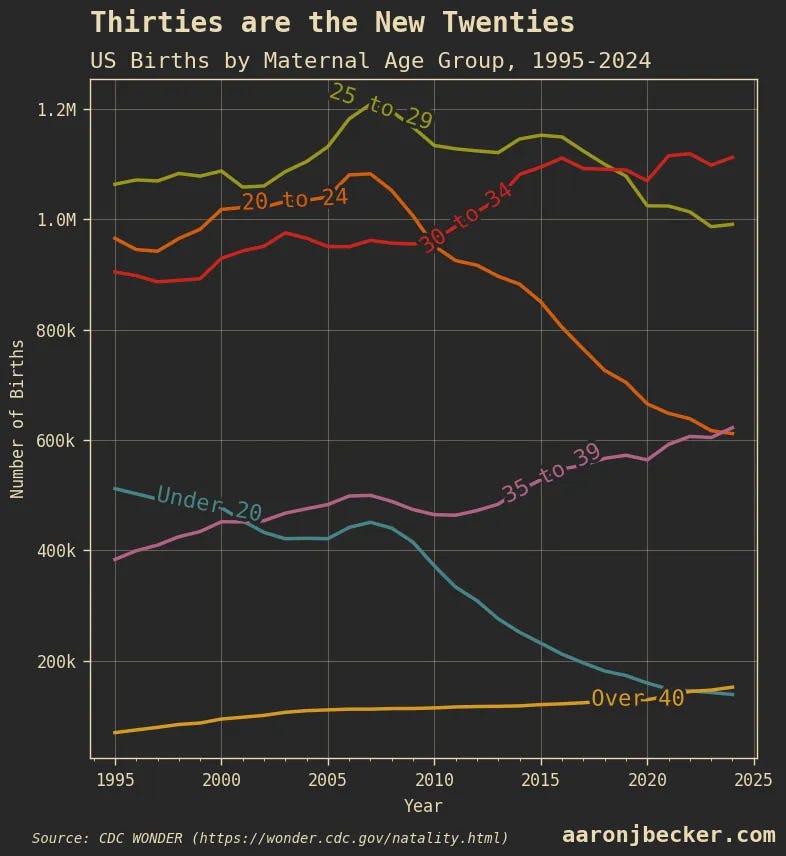
Since 2022, women over 40 have had more children each year than women under 20. That crossover point would have been unimaginable a generation ago.
This is a convergence of two long-running trends: teen pregnancy rates falling dramatically thanks to better education and access to contraception, and more women choosing to have children later in life, often after establishing their careers and financial footing.
In the fourth edition, I wrote about young people hitting major life milestones later. This chart is the most concrete expression of that shift. The decision of when to have children, if at all, has changed fundamentally in one generation. For those of us who had children young, it’s a reminder that our path is no longer the default.
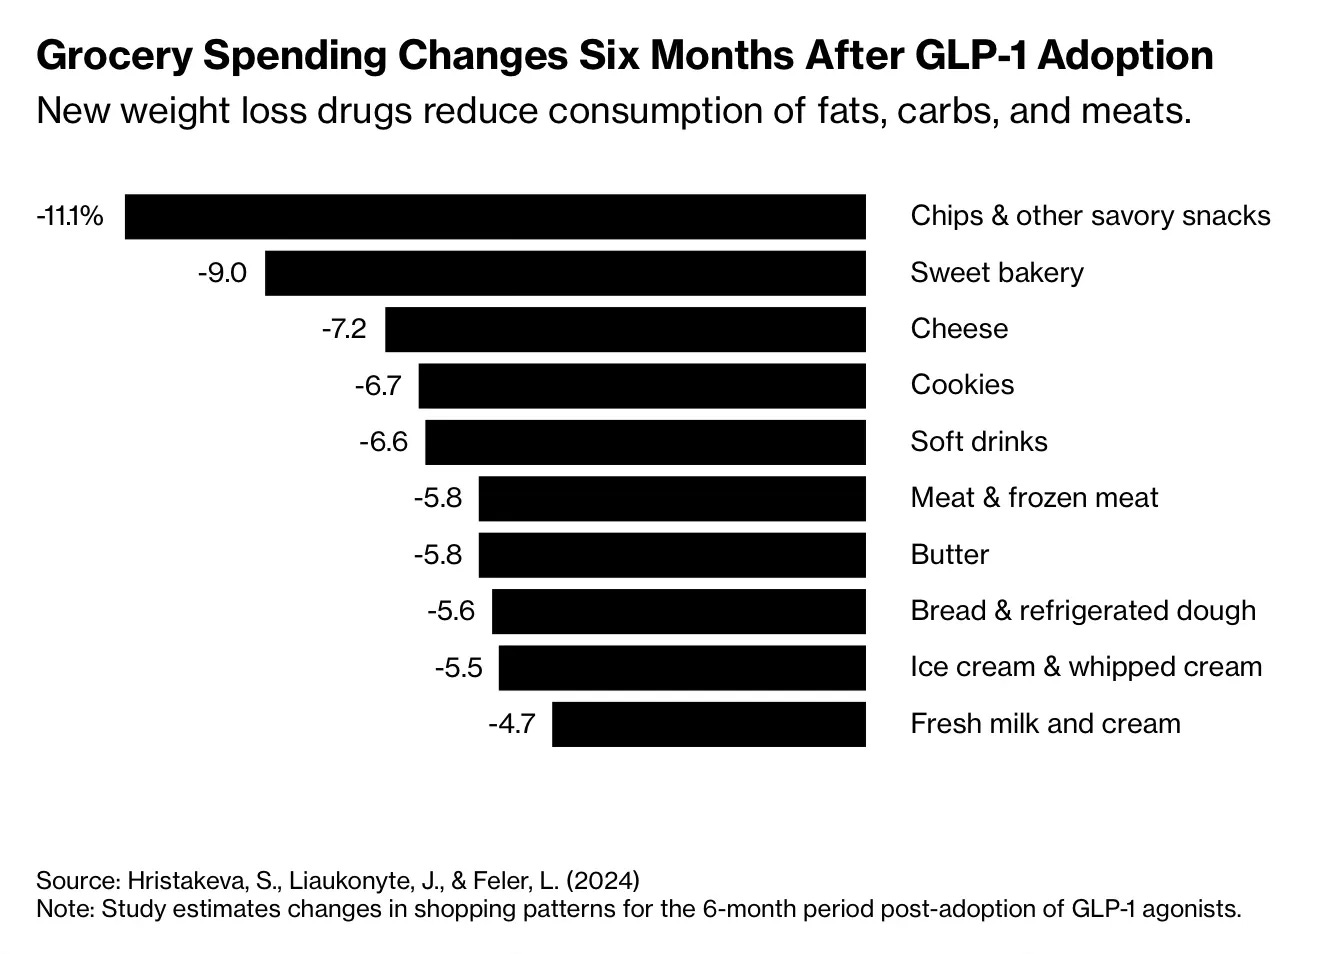
Source: Bloomberg via Killer Charts
There are always second-order effects, but they aren’t always obvious at the start. Six months after adopting a GLP-1 medication, people spend significantly less on chips and savory snacks (down 11%), sweet bakery items (down 9%), and cheese (down 7%). Cookies, soft drinks, meat, butter, bread, and ice cream are all down between 4 and 7 percent.
These drugs are changing more than weight; they’re changing grocery carts. Scale that out to the tens of millions of people affected, and you’re looking at a real shift in what a country eats. With 12% of the US now taking GLP-1s, things are evolving quickly.
I think about the ripple effects of big behavioral changes more than most people do. This one is worth watching closely.
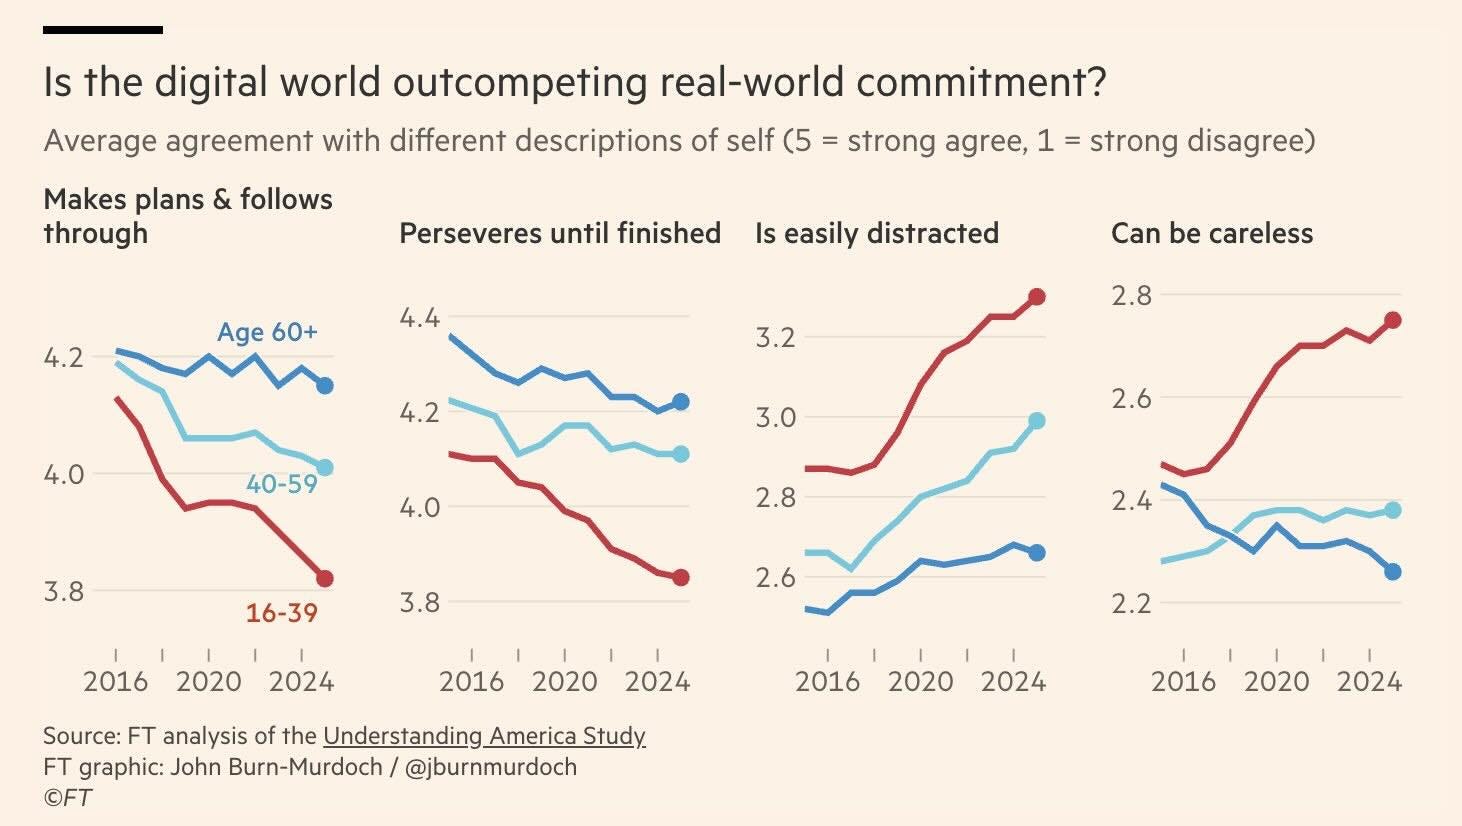
This chart gave me pause in a way I didn’t expect. Among adults aged 16 to 39, there has been a sharp drop in commitment and perseverance, and a marked increase in distraction and carelessness. Older adults (60+) have stayed relatively stable.
I think about this in the context of being the parent of three teens and also managing teams. Over the years, I’ve seen how much of career growth comes down to showing up fully, following through, and taking ownership. Careers are built over long periods of commitment, and this level of distraction could work against that. Building good habits early sets young people up for success.
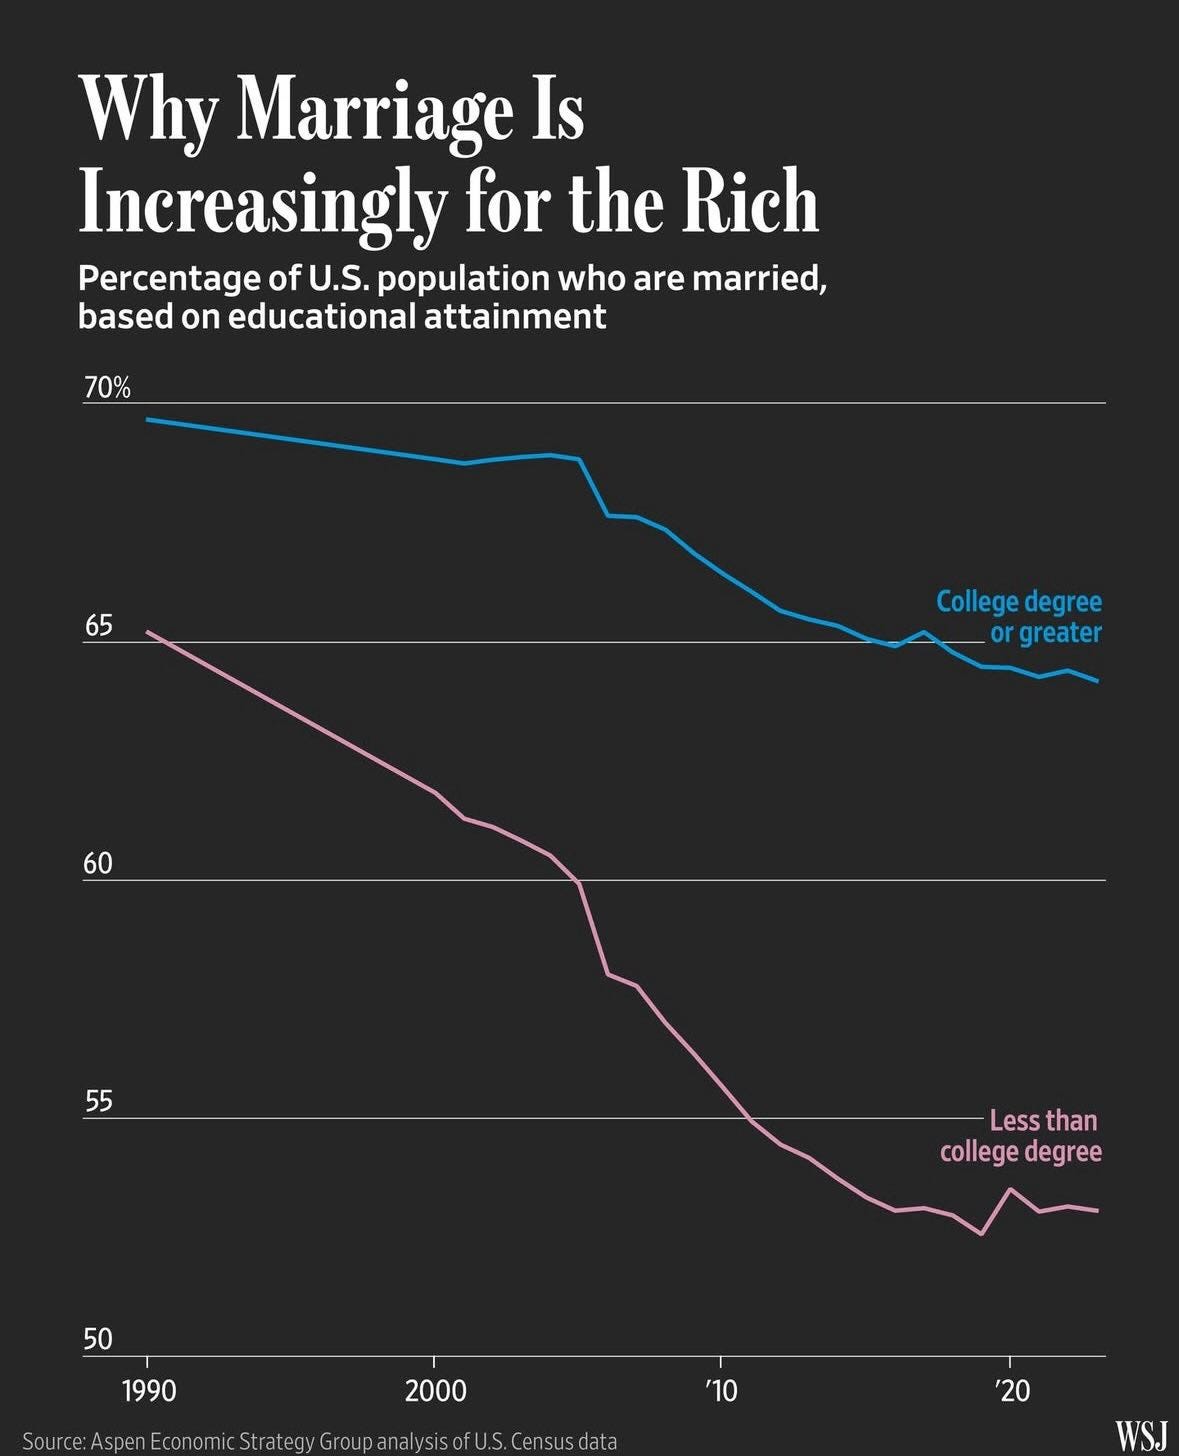
Source: Wall Street Journal via @profgalloway
This chart is blunt. Among Americans with college degrees, marriage rates have declined modestly. Among those without a college degree, the decline is steep, nearing 50%.
Marriage used to be the default for most Americans, regardless of education or income. Now it’s increasingly the domain of the economically secure. This has profound implications, because the data consistently shows that stable two-income households build wealth more effectively, and the gap between those who can afford to build them and those who can’t is widening.
This has wide economic implications. When economic precarity makes it harder to commit, it compounds over time: in finances, in family stability, and in the opportunities available to the next generation born of these relationships.
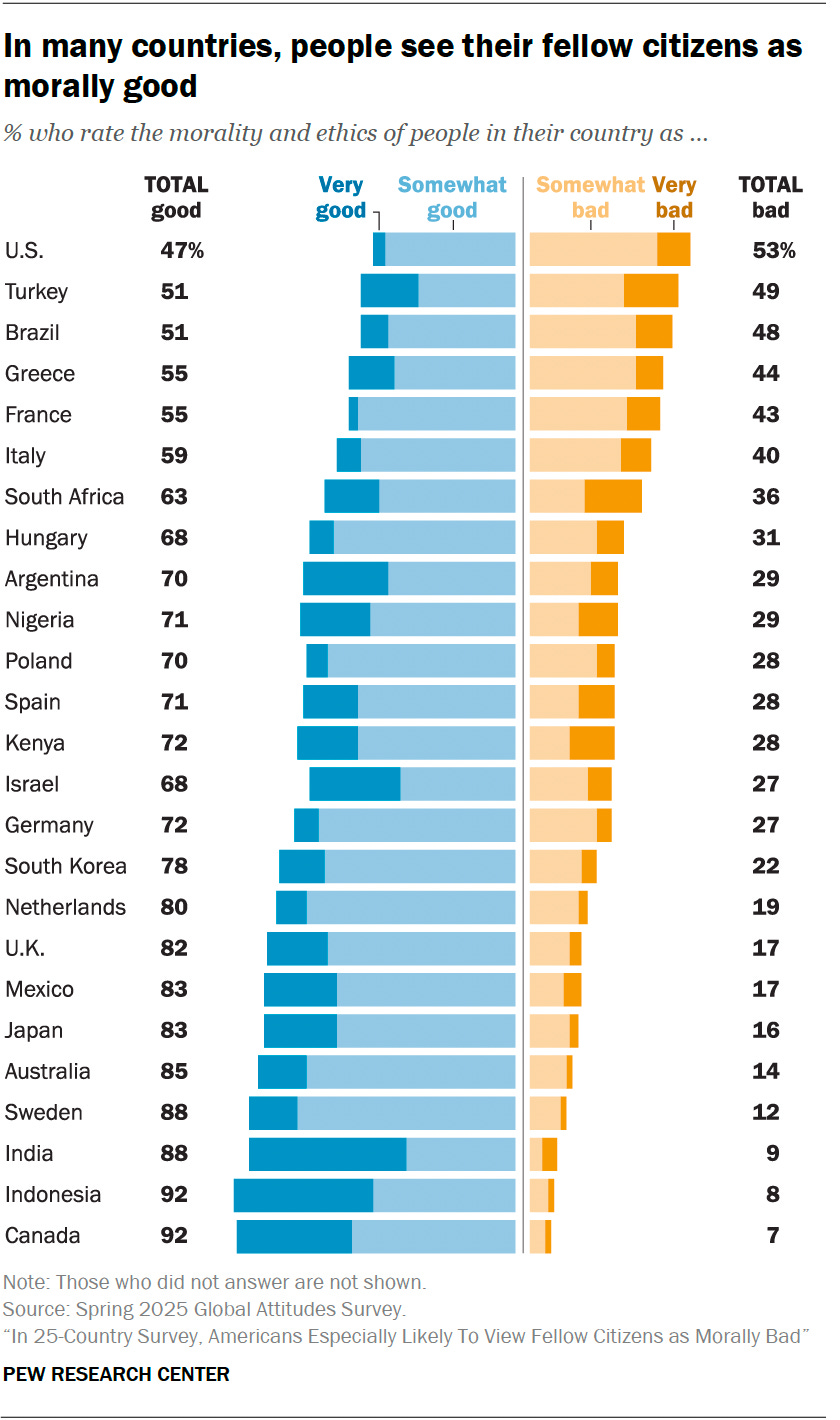
Polarization has real effects on how we view one another. In a 27-country survey, Americans were the most likely to think their fellow Americans were morally bad. That’s an alarming statistic. When half a country believes the people they interact with are immoral, they’re more likely to want to restrict the rights of others, impose their worldview, and support drastic actions that align only with their own values.
In contrast, just across the border in Canada, only 7% of people think their fellow citizens are morally bad. High-trust and low-trust societies function very differently, and we’re now at a place where many of us feel like we can’t trust half the people in our own country. Something to think about.
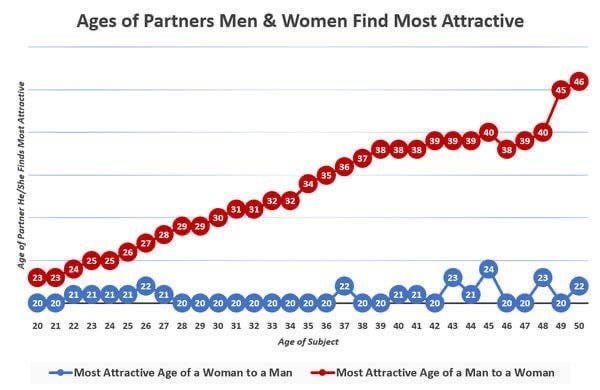
I included this one because I laughed out loud when I saw it. Women tend to prefer men of their own age, but men basically find 20-year-old women most attractive. Men in their late 40s actually have kids the age of those they find attractive. It’s such an odd mismatch.
Interestingly, while men expressed a preference for women around 20, they actually messaged women closer to their own age on the dating app OKCupid. Expressed and revealed preference deviated. A worthwhile lesson in human nature, and in how markets actually behave versus how people say they’ll behave.
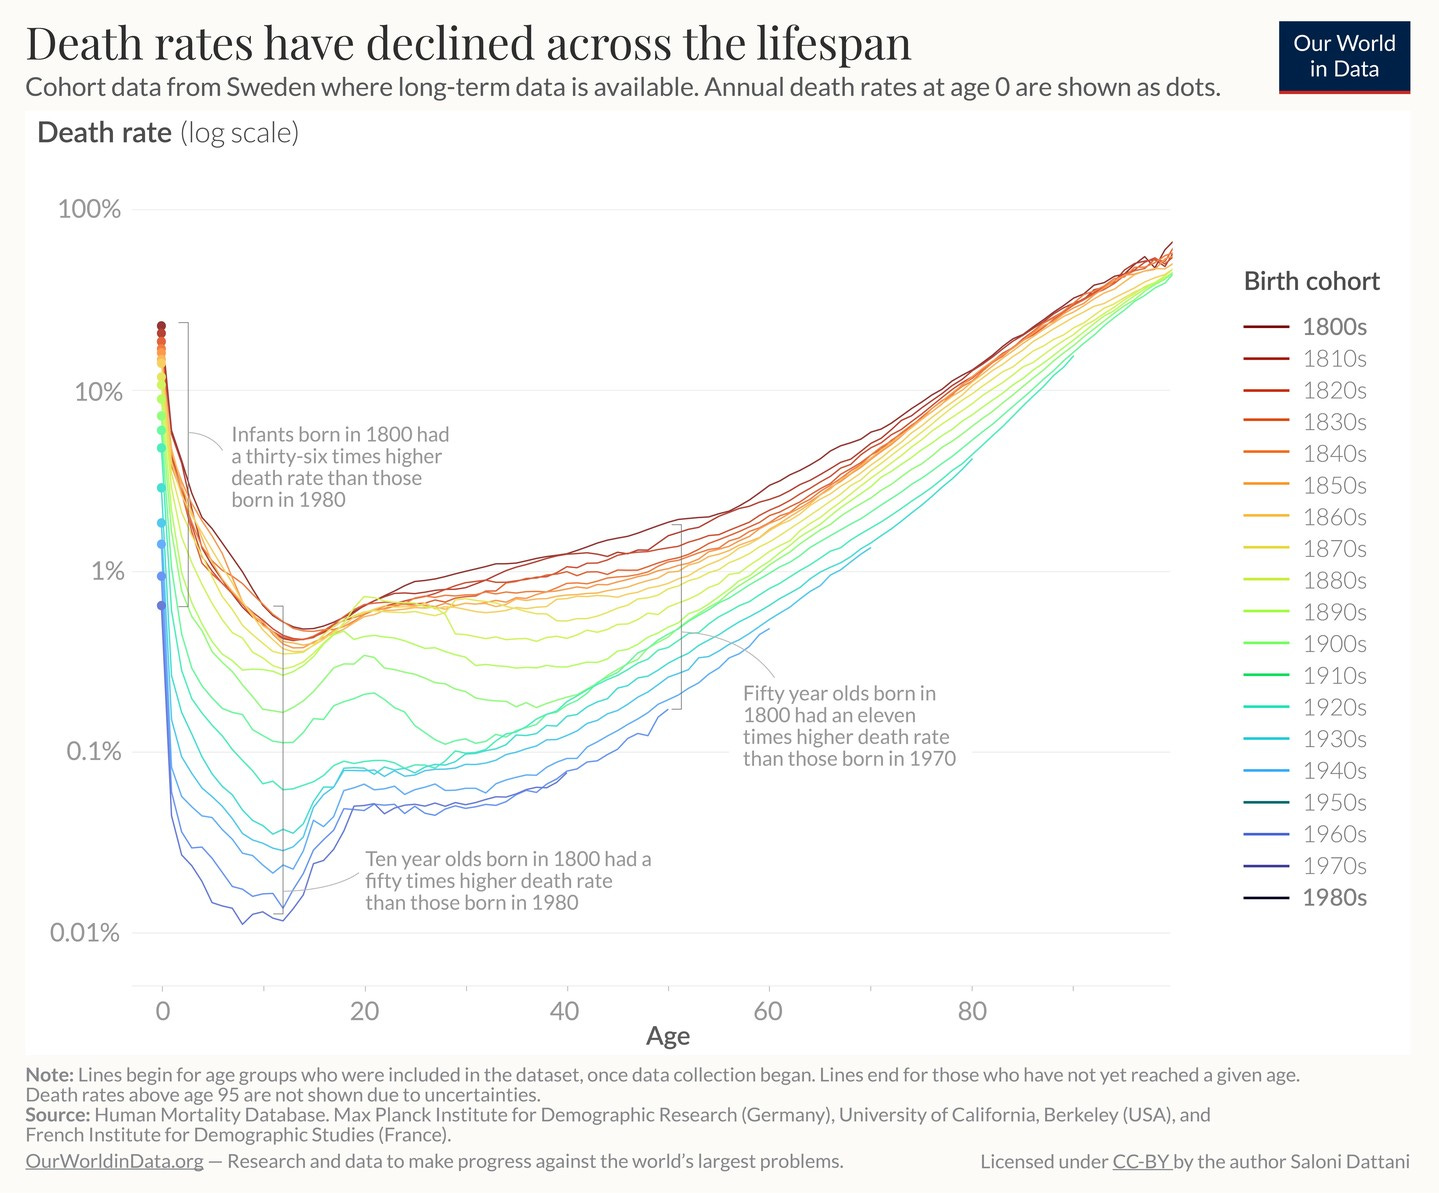
It’s easy to be pessimistic about the world, but the data tells a different story. Life expectancy has climbed for people of nearly every age, and the improvement is staggering when you look at the details.
Infants born in 1800 had a death rate thirty-six times higher than those born in 1980. Ten-year-olds born in 1800 were fifty times more likely to die than ten-year-olds born in 1980. Even fifty-year-olds saw an eleven times higher death rate in 1800 than in 1980. Overall infant mortality, which was above 10% in the 1800s, has fallen below 1% today.
This isn’t an accident. Clean water, antibiotics, vaccines, and better cancer treatments didn’t just add years to our lives. They gave us the chance at a longer, richer one.
If you see a chart that makes you think, share it with me! I love seeing data visualizations that open up our minds to new ways of thinking.
No posts
Comments
Nothing yet. Say the first thing.
Sign in to join the conversation.