
This article is being written on Friday morning before the close so prices will fluctuate.
The stock market is posed for a strong August before a possibly volatile September.
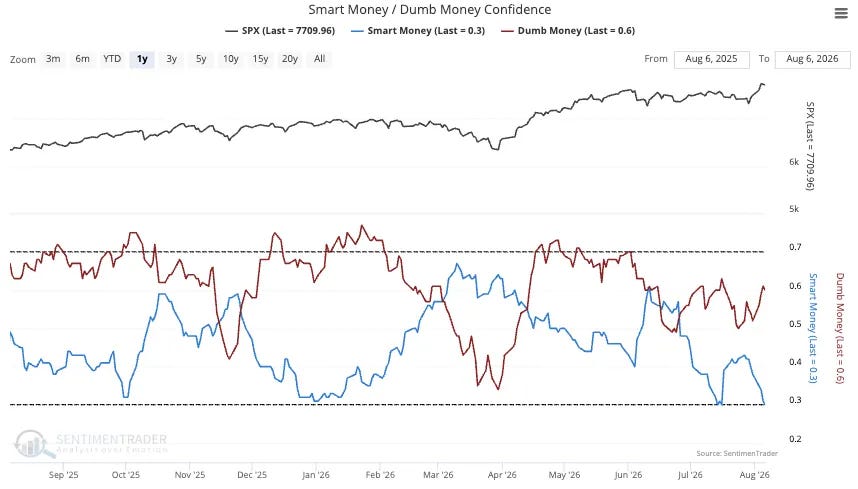
Dumb Money is pouring back into the stock market and this momentum usually continues until it gets overbought. There is a way to go before that point is hit.
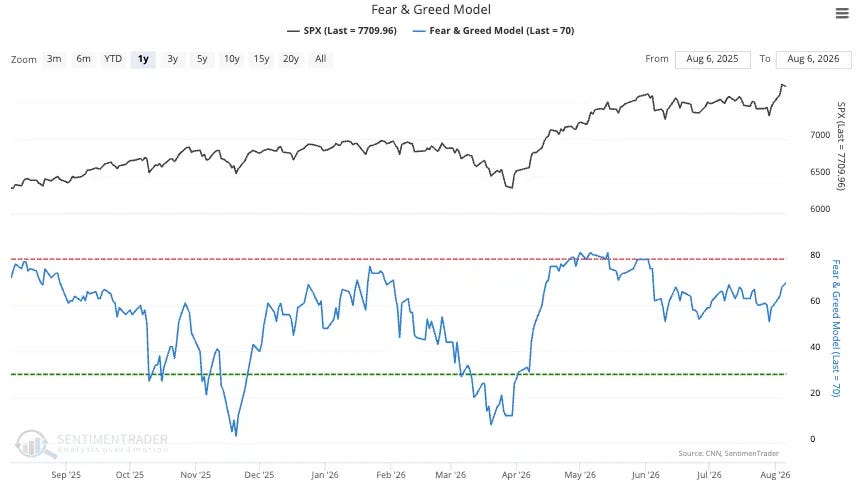
The Fear and Greed Model shows that the market is on a Greed run once again. Again, this can continue for some time before it gets overbought.
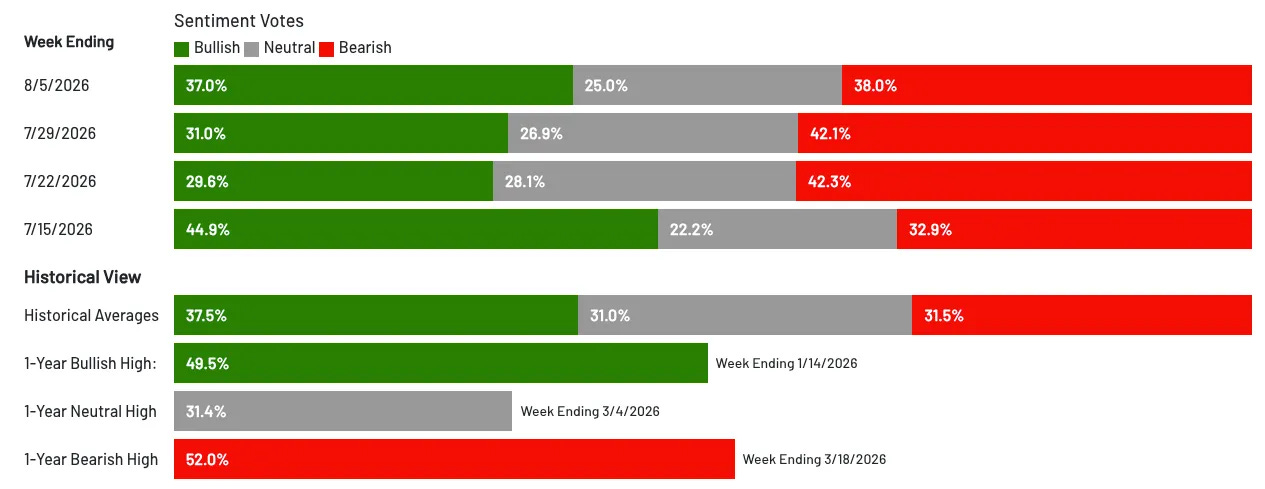
Sentiment is still quite balanced as Bullish and Bearish sentiment is close to even. Bullish sentiment is only at 37% and the 1-year high is 49.5%. Again the bulls have a way to run before the trade gets crowded.
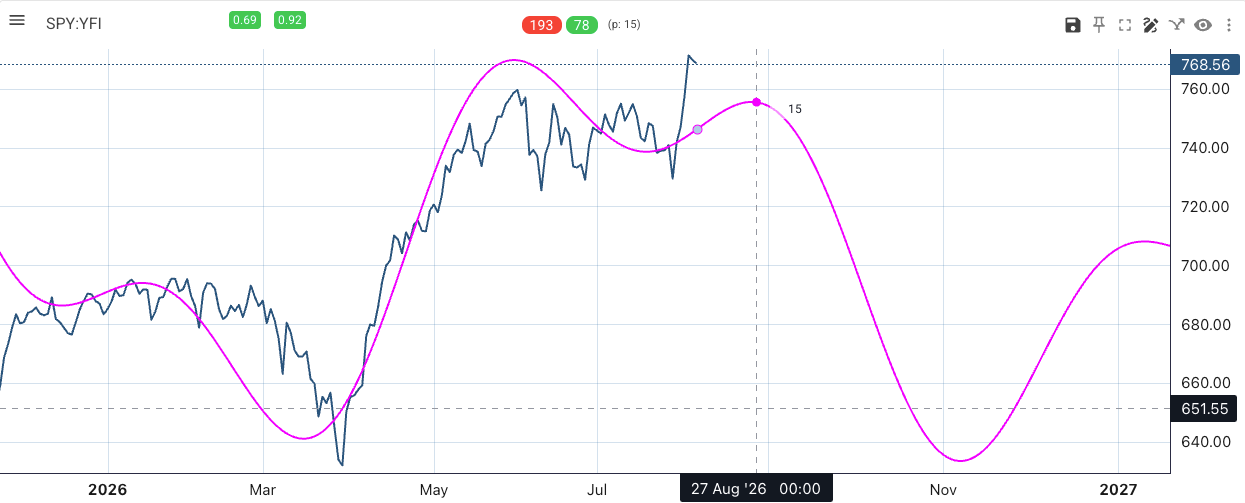
As a conclusion, we think this bull market will run some more, but by the end of August to early September, the market may run into a down-cycle. The Cycles APP from The Foundation for the Study of Cycles shows that the S&P 500’s two strongest cycles point up until around August 27th, before a down-cycle lasting until November 6th.
The Keltner Channels (blue) are a way to easily see trends. When the Upper, Lower and Middle Keltner Channel lines point up you can assume that an uptrend is in play (and vice versa). We will also observe the following charts with the 8-day Exponential Moving Average which catches powerful uptrends. Finally we will use the Webby RSI 2.0 indicator, made by Mike Webster who was a protege of the legendary William O’Neil. Here is a description of this indicator.
Webby’s RSI 2.0
Measures how stretched a stock is from its 21-day moving average
Expressed in units of the stock’s own typical daily range (50-day ATR), not raw percentages — so a reading means the same thing on a quiet index as on a fast-moving growth name
Above the average, it uses the day’s low: did even the weakest moment hold up?
Below the average, it uses the day’s high: how close did the tape come to reclaiming it?
The key insight is counterintuitive: too much extension is a warning, not a strength
S&P 500 (SPY):
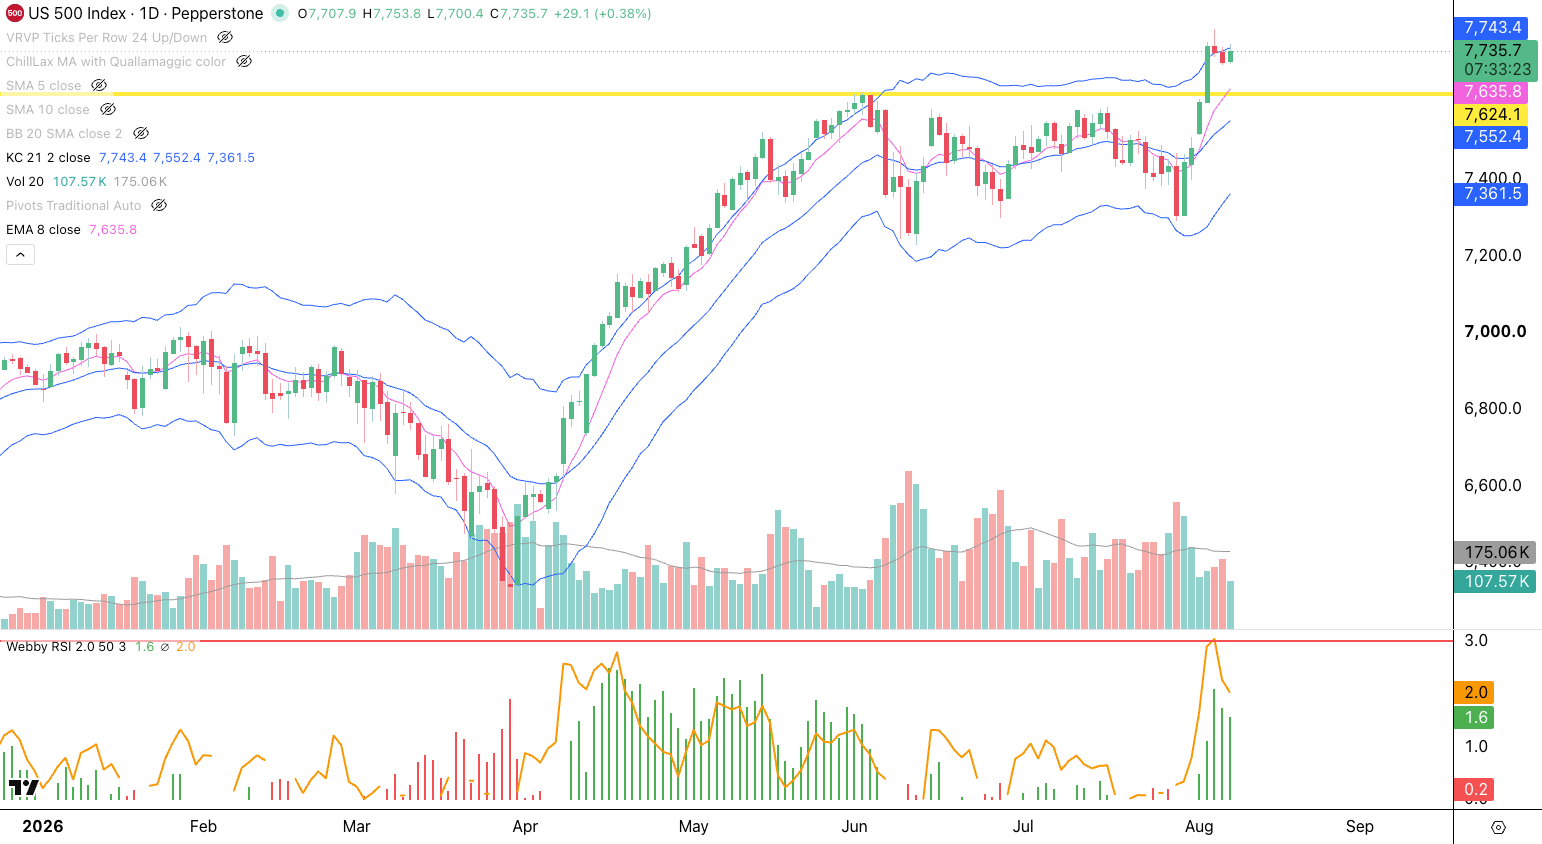
The SPY in a new uptrend as it broke above the June 2nd high (yellow line). If this is retested, it will coincide with support from the 8 EMA (pink).
Notice that the July 29th bottom coincided with the Lower Keltner Channel. Now price is pushing the Upper Keltner Channel higher, which is a signal that an uptrend is still in the early phase and can continue.
The Webby RSI 2.0 is green confirming the uptrend. Price is a bit extended from the 21 EMA so some pause or backfill would be completely normal before the uptrend continues.
This is essentially a 2-month base, which provides an excellent opportunity. A measured more of the depth of the base provides an upside target of $800.
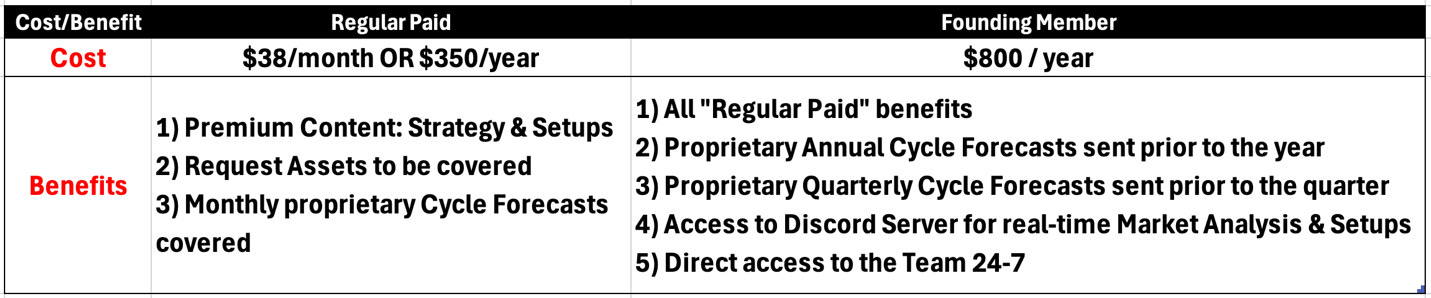
For more ETF investment opportunities, become a Paid Subscriber:
Comments
Nothing yet. Say the first thing.
Sign in to join the conversation.