
The 7-Year Cycle is a market-timing tool built from two repeating cycles that run back-to-back and together span roughly seven years.
Each stretch is labeled either “Favorable” or “Unfavorable” based on how stocks have historically performed during that window.
The idea behind cycle analysis like this is that markets don’t move in a straight line.
Instead, prices tend to move through recurring phases shaped by things like investor sentiment, credit conditions, and economic momentum.
Just as the 4-year presidential cycle or the 10-year decennial pattern are used by some analysts, the 7-year cycle offers another lens for gauging whether the odds currently favor a stronger or weaker stretch for stocks.
The aim of this article is to understand where we are in this 7-Year Cycle and get a True Timing Edge to position for what’s to come!
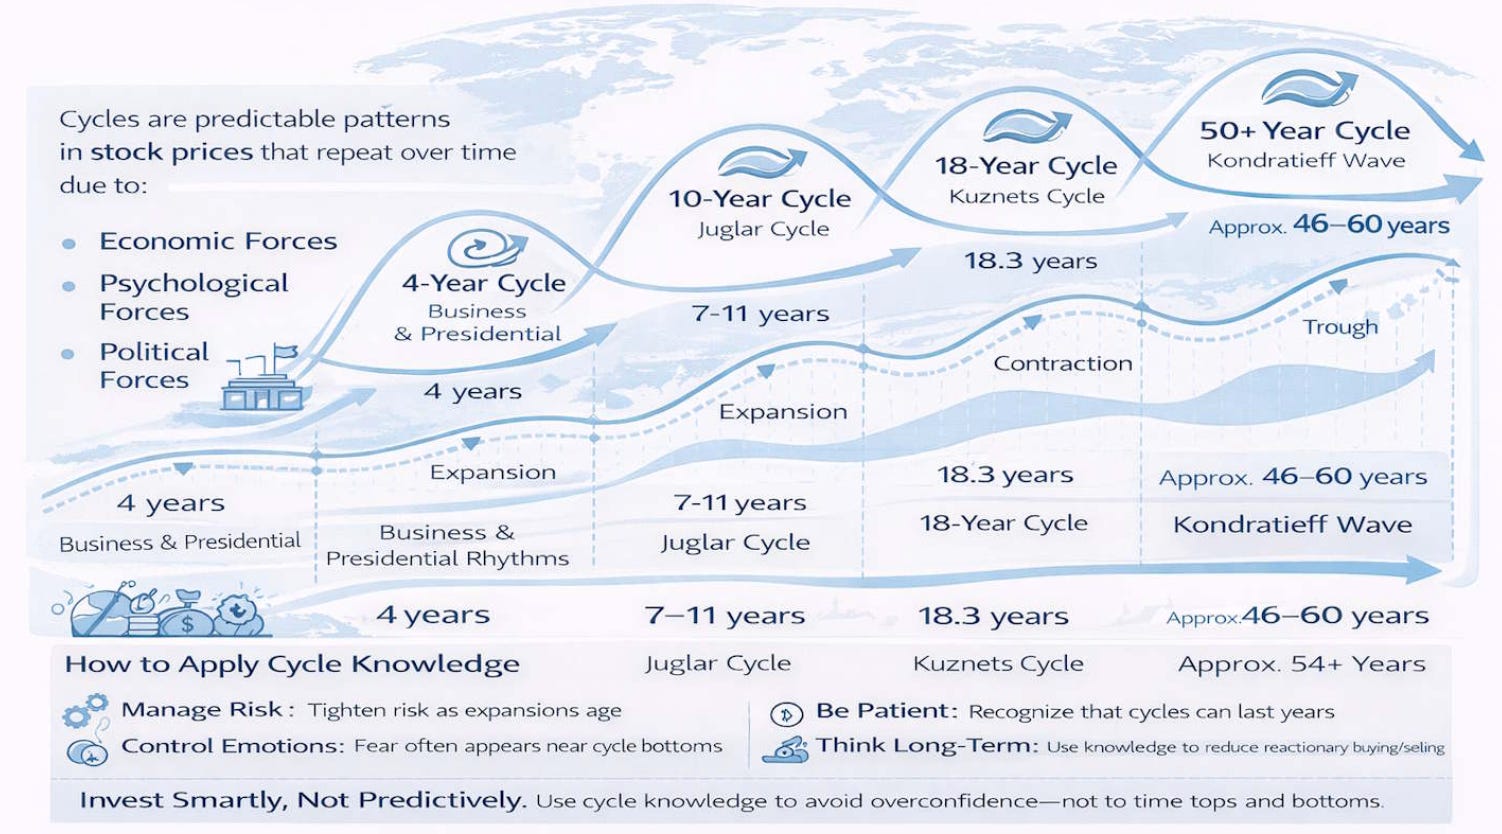
The full 7-year cycle is made up of two smaller cycles that run one after another:
The first cycle lasts 1,248 calendar days (about 3.42 years) and contains its own Favorable and Unfavorable stretch.
The second cycle lasts 1,308 calendar days (about 3.58 years) and also contains its own Favorable and Unfavorable stretch.
After the second cycle ends, the pattern starts over with the first cycle again.
Added together, the two cycles run 2,556 calendar days, which works out to 7.0027 years — so it isn’t an exact 7-year cycle, but close enough to treat as one.
Each 7-year cycle contains two Favorable periods and two Unfavorable periods:
Cycle 1 (1,248 calendar days / 3.42 years):
• First 654 days: Favorable
• Next 594 days: Unfavorable
Cycle 2 (1,308 calendar days / 3.58 years):
• First 684 days: Favorable
• Next 624 days: Unfavorable
Once Cycle 2 finishes, the pattern repeats starting with Cycle 1 again.
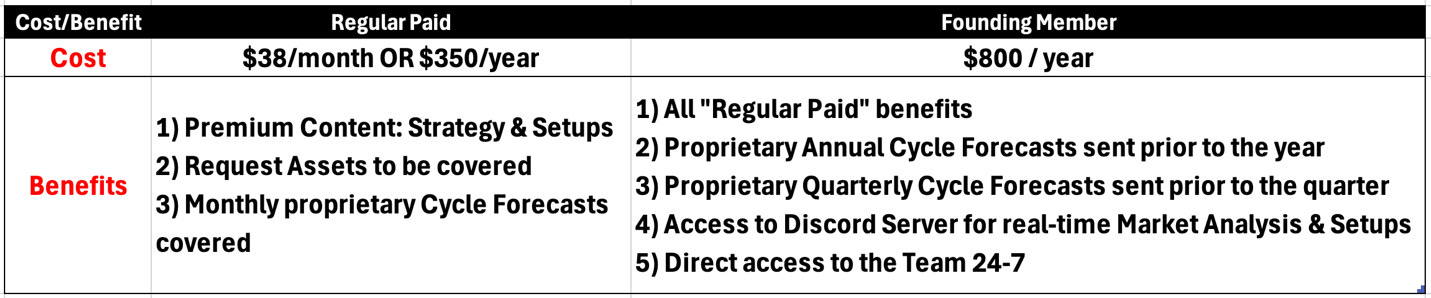
Find our membership cost/benefits below.
If you’re serious about Making Money (our primary goal at Cycles Edge), then the Premium Sections are key for you!
Comments
Nothing yet. Say the first thing.
Sign in to join the conversation.