
Gold is correlated with equities. It now rises and falls in tandem with stock markets.
The majority of economists expect a mild economic slow down in the US and elsewhere. They are sanguine about equities.
Gold spiked to $2600 an ounce briefly when the US Federal Reserve Board cut rates by 0.5 per cent. It fell back because the market had expected the cut. The rate reduction was already in the price.
The market appreciates that monetary ease is on the agenda. Expectations of lower interest rates not only buoyed gold but also stocks, bonds and other commodities.
Note however that the Fed slashed rates to counter recession. ( See Cyclical commodities predicting global economic downturn )
Cautious investors are worried that markets will be jittery close to the US November elections. If equities fall, gold may well decline too. Gold and silver markets are overcrowded with speculators. Jewellery demand has slumped. Central bank purchases are lower at current quotes. See implications and unusual charts below.
At current record levels bullion is no longer a bargain
Please note only one analyst predicted $2500 out of a big London Bullion Market survey at the beginning of the year. Hardly any above $2300.
Sure, gold has done well because it’s a monetary asset. China and other central banks have been big buyers. Wars in the Middle East, Russian sanctions and US tension with China have also helped bullion. When interest rates fall, the dollar tends to weaken. That move has helped gold in the past. All the above news, however is baked in. When rates fall gold may well spike. Equities too. But for how long?
Investors and speculators have dominated the market
Jewellery demand, which normally accounts for the biggest proportion of gold purchases, has contracted. Since gold began its surge to all time heights, central bank buying has waned.
Hedge and commodity funds have been major buyers since the 2024 low point in February
Their net futures and options holdings as at September 10 were equivalent to 22.7 million ounces, slightly lower than the August peak. This amounts to almost 15 per cent of global gold demand.
Including smaller players, the net speculative holdings according to the US Commodity Futures Trading Commission (CFTC) was equivalent to 28 million ounces. This is a whopping 18 per cent of global demand.
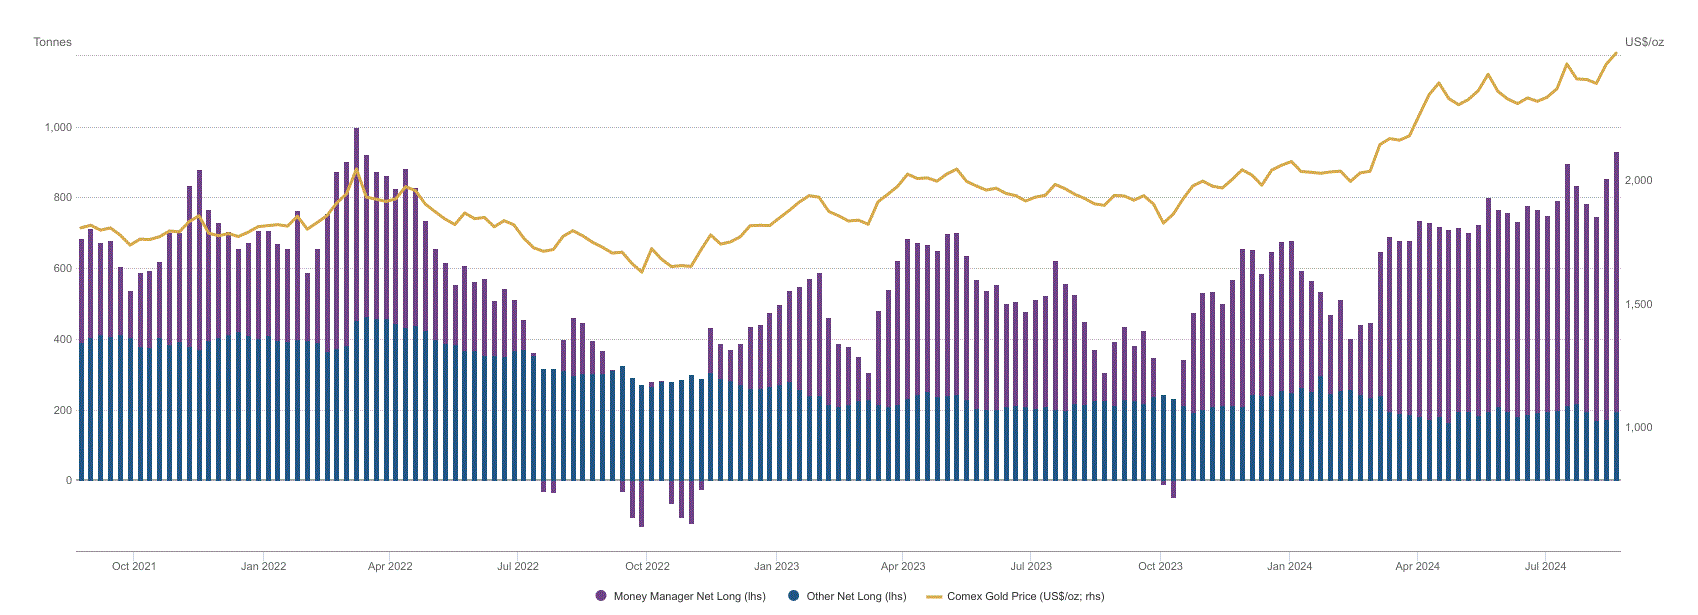
The perpendicular purple (hedge fund buyers) and blue (smaller speculators) shows the trend of net speculative gold positions on Comex, New York. The yellow line is the gold price. The speculative holdings are the highest since April 2022. The price slid after that date.
By October 2022 gold’s performance was so poor that the funds were short i.e. net positions were bearish. That was when the price was $1614 an ounce, the nadir of the current bull market. At the time gold stabilised. But the low price encouraged central banks, jewellers, tech and other industries to buy. Back in 2018 when gold was $1160 an ounce, the funds’ bear position was even bigger. To jolt memories I suggest you read one of my earlier pieces: Gold Coiled Spring begins to Uncoil , Bottom line tread carefully when the speculators dominate the market.
The role of Chinese Speculators
Over and above the above speculative positions are massive futures and options trading and holdings on the Shanghai Futures Exchange. Ross Norman of Metals Daily, quotes Chinese news agencies. They contend that at least three major Chinese commodity firms have been heavy buyers. They bought highly leveraged call (bull) options. The bullion houses that issued these options were “short” and vulnerable to a rise in prices. They hedged to protect themselves from potential losses. They did so by buying futures and options. Paradoxically their actions helped push up gold prices.
According to Chinese sources the game continues. But at these prices the going gets harder. Gold first peaked in April and May around $2440 an ounce. Prices then tumbled to to $2285 and over a period of three months gold finally rallied to more than $2,500.
Other investors also illustrate a crowded gold market
Gold Exchange traded funds (ETFs) hold 102 million ounces and numerous investors in Switzerland, Asia and elsewhere currently own extensive numbers of bars and coins.
A sizeable number of investors take a long term view. They hold gold through good and bad markets. Central banks take profits. The Singapore Monetary Authority, for example sold 386,000 ounces recently.
Platinum the neglected precious metal
This precious metals bull market began in October 2022. From low to peak, silver has soared by more than 70 per cent, gold by 60 per cent and platinum by 30 per cent.
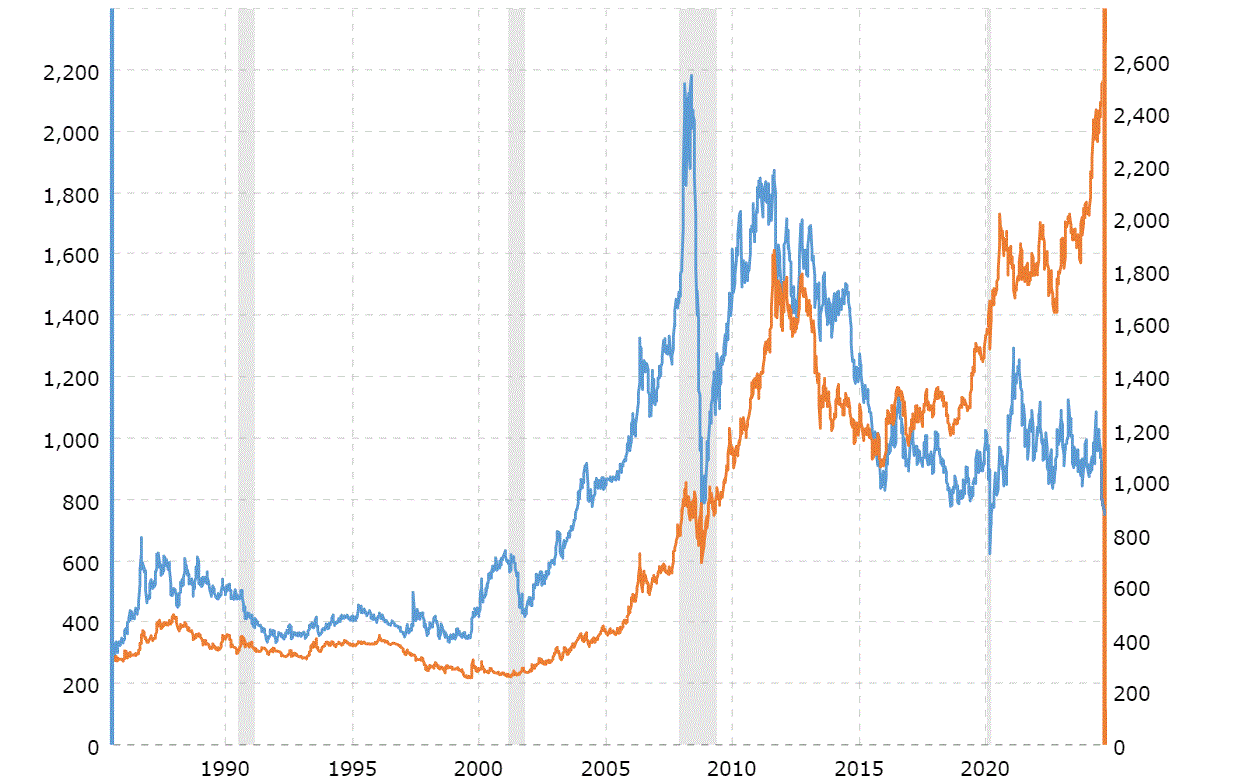
Source Macrotrends
As can be seen from the chart platinum prices exceeded gold for many years. But since 2016 gold has raced past. Gold currently $2,569 compares with platinum at $975 an ounce.
Platinum and palladium catalysts clean the emissions from petrol and diesel automobiles. The metal is unpopular because of the growth of electric vehicles. The market ignores supply shortfalls from problematic South African mines and Russia. Also there continues to be large scale catalyst demand.
Time will tell whether sentiment will improve.
© copyright Neil Behrmann All Rights Reserved. Publications can use parts of the article but must attribute the author and Commodities Predict. Others who want the entire article must seek permission.
No posts
Comments
Nothing yet. Say the first thing.
Sign in to join the conversation.