
For the past 30 years, the brokerage industry has been telling you that, “You can’t beat the market and you can’t time the market.” Brokers almost universally recommend the buy and hold strategy of 60% S&P 500 index and 40% bonds, or something similar depending on your age. This has produced excellent result for the vast majority of investors looking back, but times have changed.
The biggest driver of 401K and IRA wealth was a 40-year bond bull market, which brought high returns to bonds and increased equity multiples. Then, the Fed topped it up with years of zero-interest rate policy (ZIRP). Unfortunately, those days are over, and investors are likely looking at a prolonged period of returns lagging inflation.
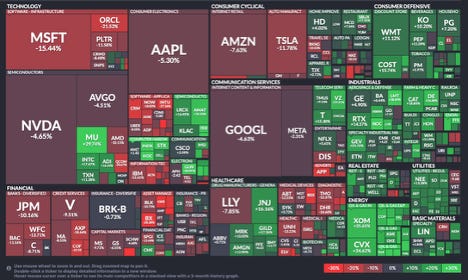
So far in 2025, the S&P has barely moved. down -1.31% and bonds haven’t moved either, down -.11%. But, under the surface there have been massive moves in individual stocks. I expect this to continue for some time. The Energy Index (XLE) is up 26.5%, while Software (IGV) is down -16.8%, and was down -27.2% before recovering in the past week. Financials are down -7.7%.
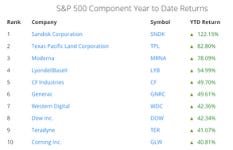
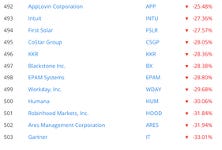
Individual stocks are showing far higher dispersion than normal. From Sandisk up 122%, to Gartner Group down -33%.
My background is in fundamental analysis, but unless you are hunting in unfollowed micro-caps, fundamentals are known to the market participants. I have a sense of fair value running in the background, which perhaps I do not fully appreciate, but have found that adding technical analysis has vastly improved my investment results.
Technical analysis can help you identify invest-able trends, despite the brokers’ advice that no one can beat the market.
Using a system has many benefits, most importantly in creating trading discipline. However, I have not found any indicator that creates universally correct buy and sell signals. I believe none exists, or can possibly exist, for any sustained period.
Investors that rely on technical indicators to assist their investing and trading can and do beat the market. I have a friend who was up 100% in 2025 by following William O’Neil’s hybrid, fundamental and technical, CAN SLIM strategy. If you don’t believe me, pick up one of Jack Schwager’s “Market Wizards” books.
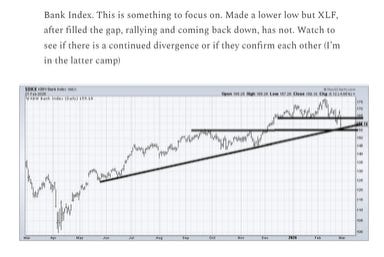
I follow a number of technical analysts with their own methodologies, Helene Meisler with classic technical tools such as trend lines, triangles and support/resistance lines, put/call ratios, etc.
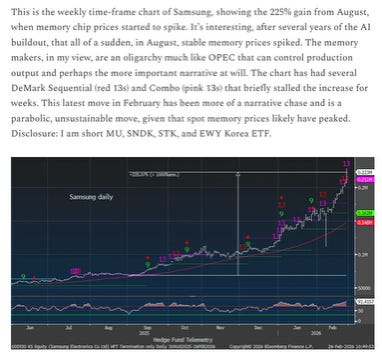
Tommy Thornton, with an emphasis on DeMark exhaustion indicators.
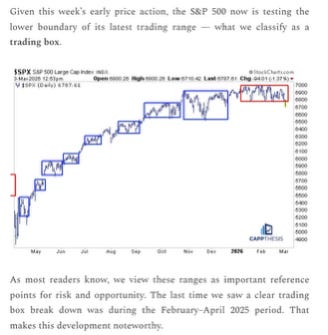
Frank Cappelleri, who uses trading boxes among other indicators:
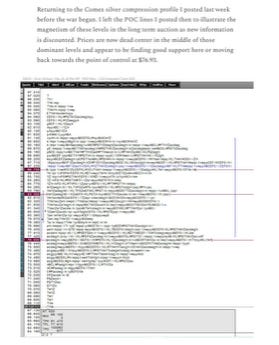
John Johnson, the veteran commodities trader, using points of control and DMI trend indicators.
There are more technical indicators than you can shake a stick at: Moving Averages, Bollinger bands, McClellan oscillator, RSI, VWAP, Fibonacci sequences, put/call ratios, short interest… just to name a few.
In my own process, I have adopted Stan Weinstein’s Stage Analysis system based on moving averages and trend lines. I overlay that with DeMark indicators, which use price momentum to measure exhaustion of buying or selling pressure.
These two independent indicators have given good signals often enough and are uncorrelated. I try to act only when they align. But as I said, they are not always correct. Stan Weinstein has said his system is accurate about 70% of the time. I have watched trading strategies primarily relying on DeMark Indicators struggle at times. A great example was after last year’s April bottom when the S&P 500 went straight up through nine sell signals.
It is worth bearing in mind that a failed indicator may carry as much or more information than one that is confirmed. For example, if a stock blows through a DeMark 13 sequential sell indicator, it may indicate a particularly strong upward trend. We saw this in precious metals over the past year.
Let me give you a couple of recent examples of trades that have met my criteria.
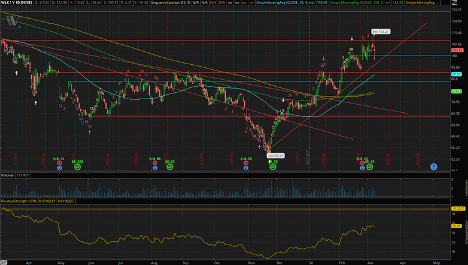
On February 24, I bought Westlake Chemicals (WLK). The stock was showing signs of a breakout, crossing above its downtrend line and its 150-day moving average (DMA). In addition, it was on day one of a nine-day DeMark countdown, after having reversed from a sell indicator. So far, I have no profit, but nothing has negated the technical set-up.
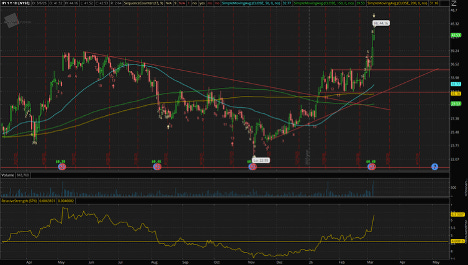
On February 27, I bought the fertilizer company Intrepid Potash (IPI), which crossed above its downtrend line and 150 DMA on January 12, but then sat in a trading range of $31.2 - $35.3 for several weeks. The break above the range was the indicator that triggered my purchase.
You don’t have to be right on every trade. I think it matters more to get experience with a system and watch how it performs. The most important thing is risk management - learning what to do when you get a signal that puts you in a losing position. Also, you have to observe when a system is working versus when market conditions are not conducive to its signals.
No matter what technical system you chose:
1) Be picky about when to put capital at risk - the risk/reward probabilities of a position must be attractive.
2) Be humble, admit mistakes quickly, and cut losses while they are small.
3) Set stops (I prefer alerts as algos pick off stop orders) and sell when losses are small without second guessing. There will always be other opportunities.
Good luck out there.
No posts
Comments
Nothing yet. Say the first thing.
Sign in to join the conversation.