
Let’s just begin by saving you all some time and sharing the goods up front:
Growth accelerates. Inflation follows. Both slow. Then we wait. That cycle has repeated itself - in some form or another - across every major market era for as long as there have been markets. The specific assets that outperform in each phase are not random: they're a function of the macro regime. Cash flows to energy and commodities when inflation is running hot. Gold and Treasuries hold up when growth is falling off a cliff. Technology and growth equity surge when both conditions ease and liquidity returns. Most portfolios ignore this entirely. They hold one mix through all four phases and accept the damage that comes with the environments their allocation is wrong for. This is the curse of pure passive. And that is precisely the problem REGIME ROTATION is designed to solve.
‘Read the regime. Rotate the portfolio. Beat the benchmark.’
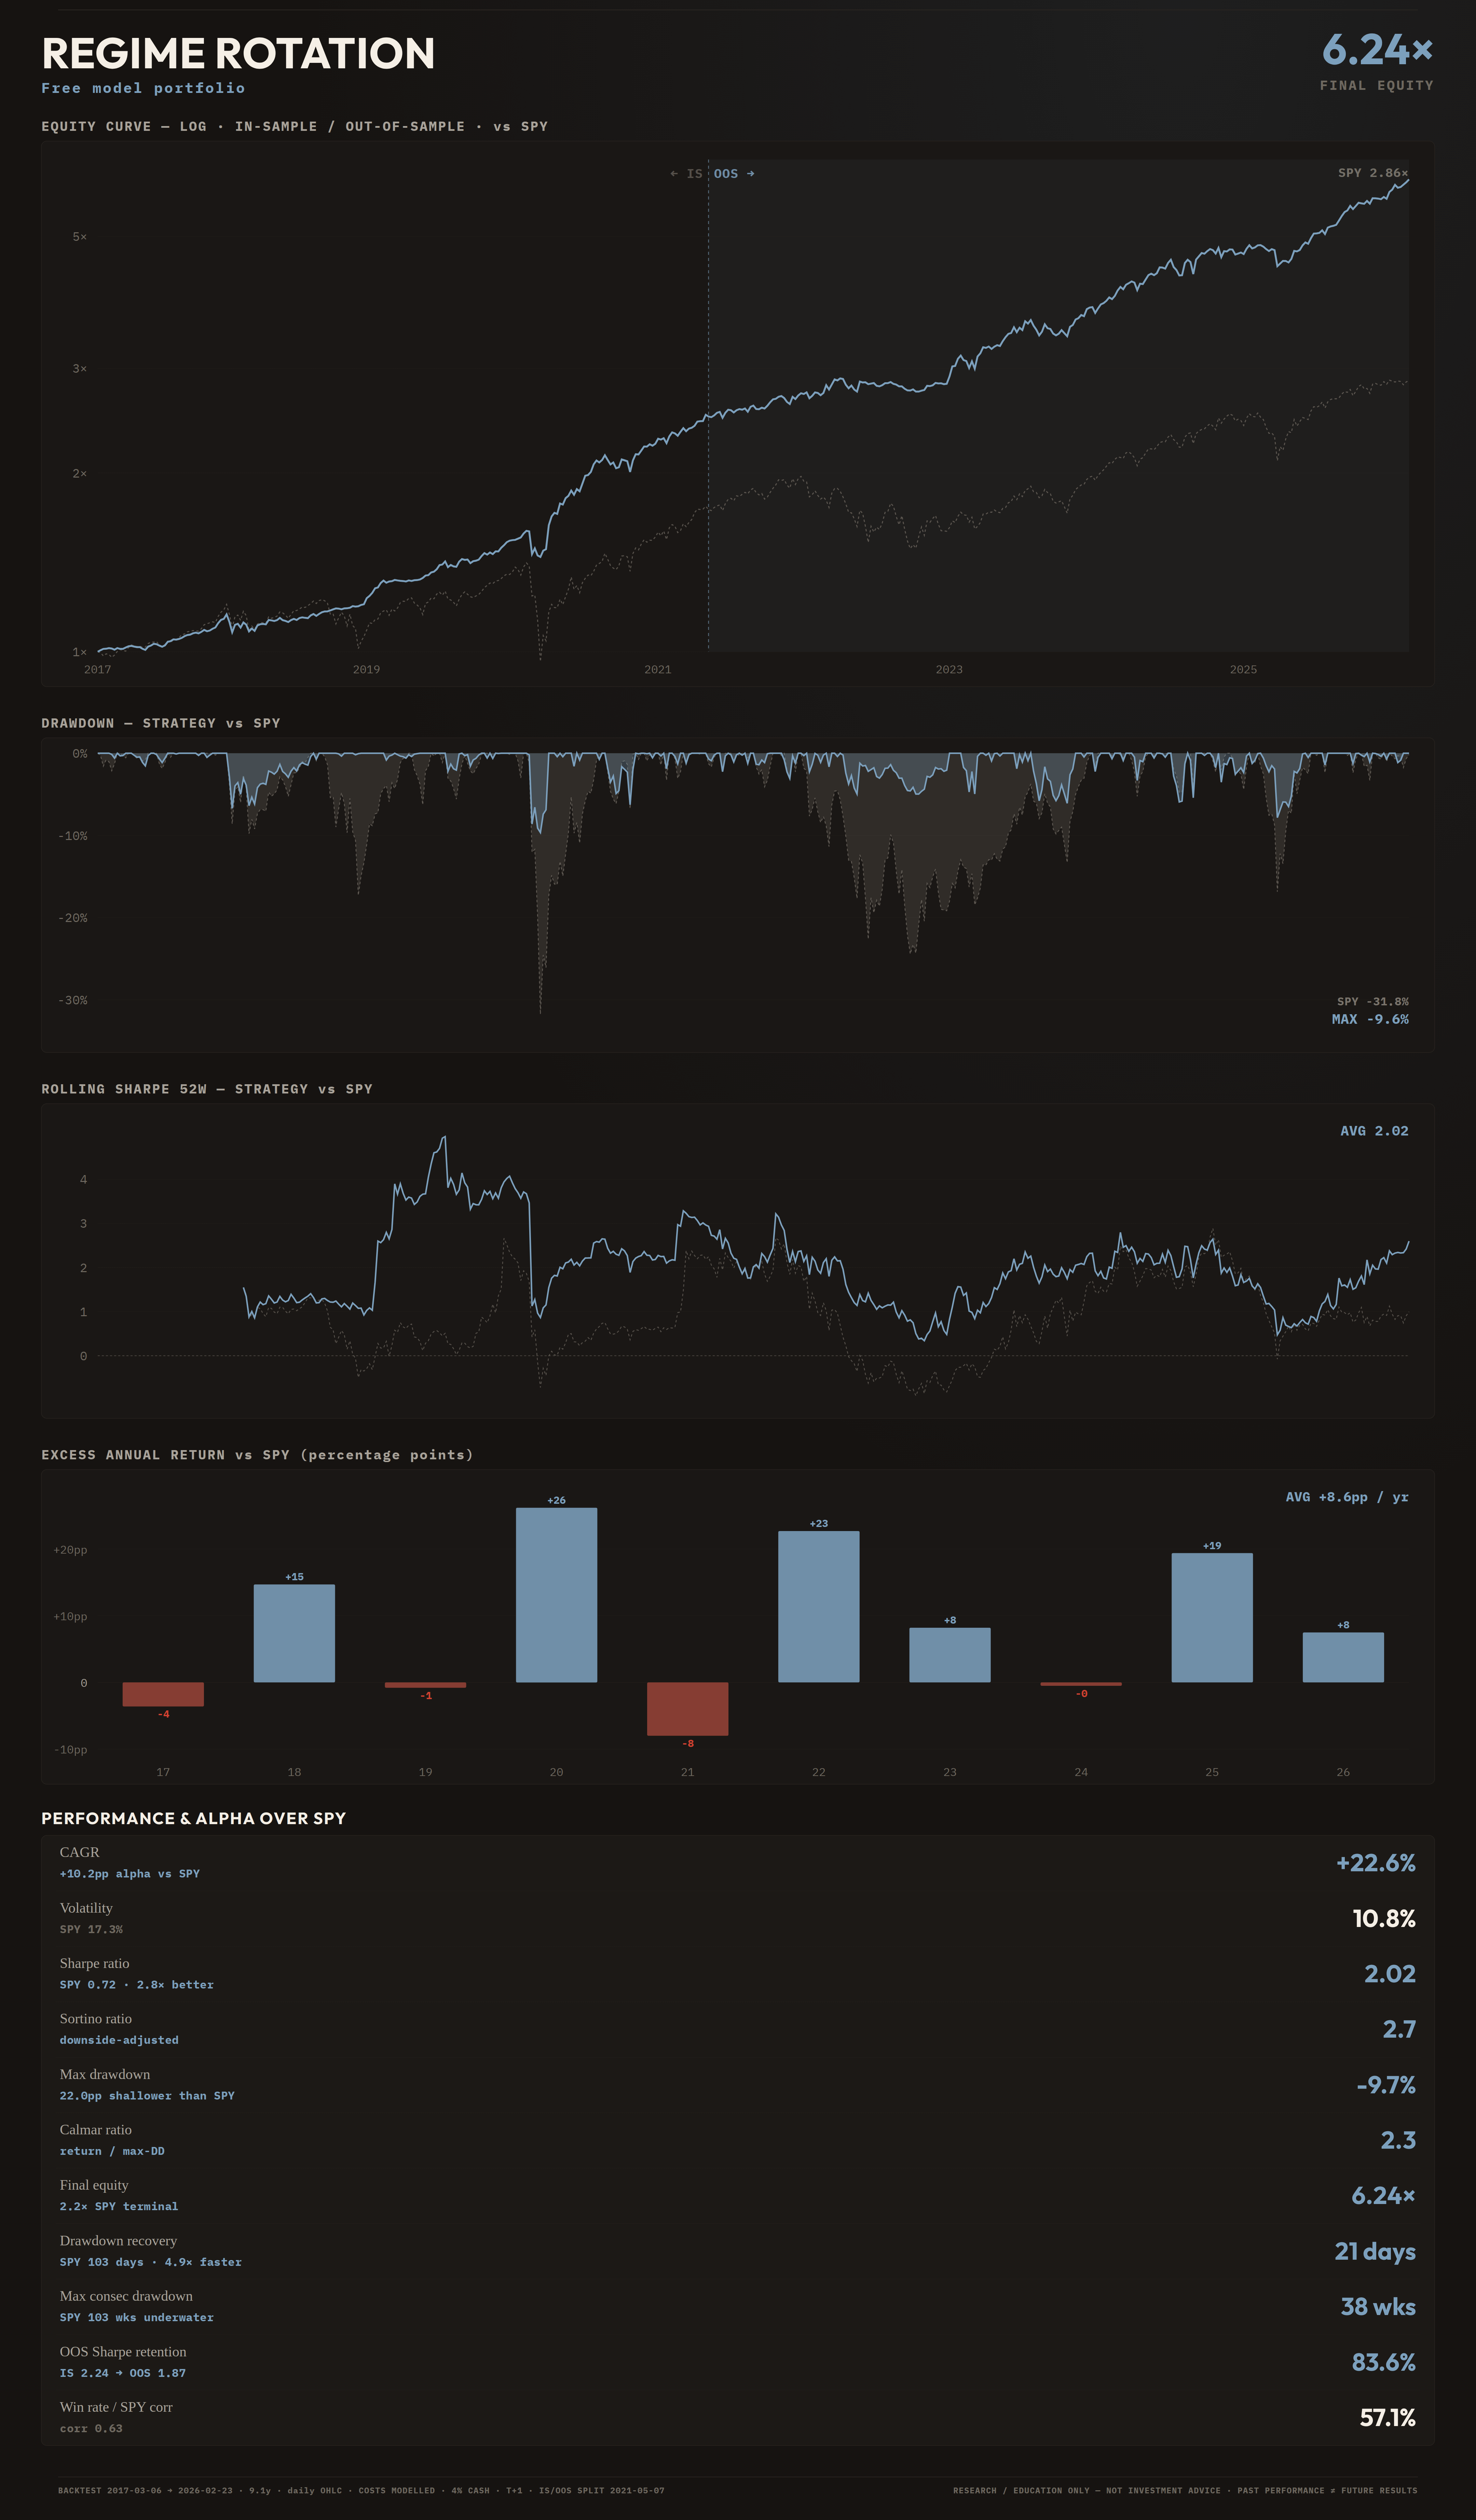
REGIME ROTATION is a systematic, macro regime-conditioned, long-only strategy.
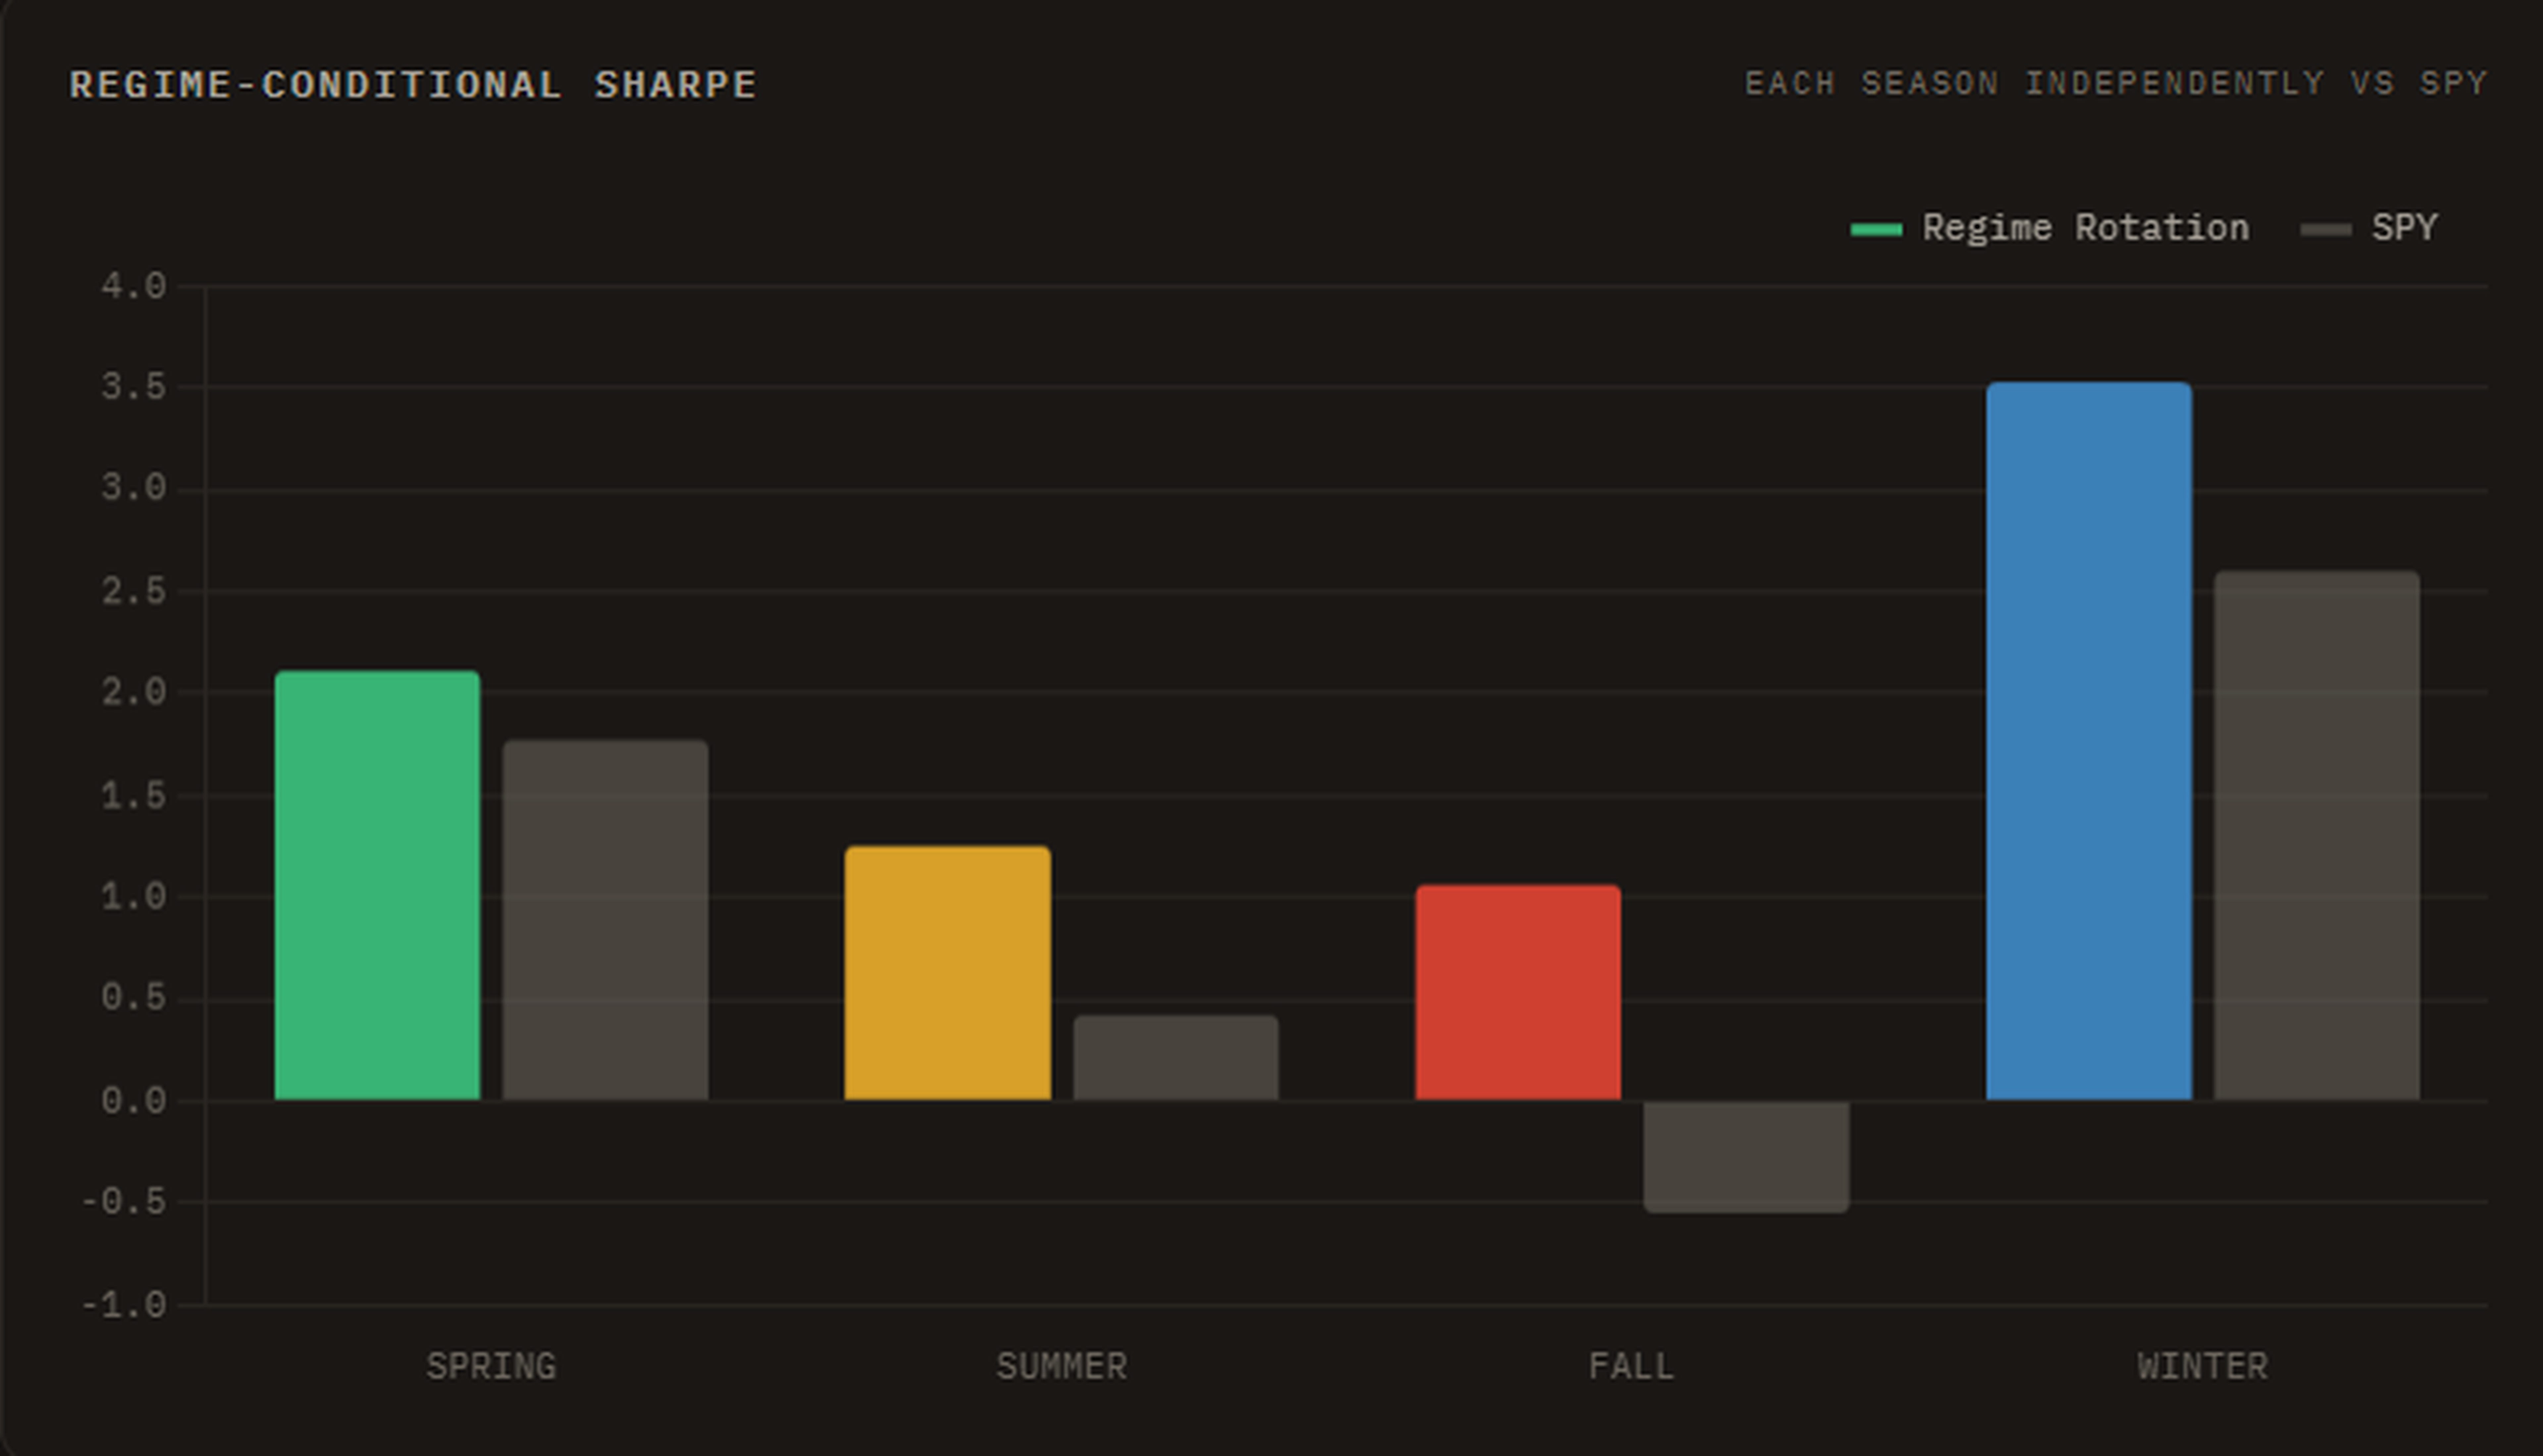
Each month I classify the macro environment into one of four regimes: technically, Goldilocks, Overheat, Stagflation and Contraction, but for the purposes of the strategy: SPRING, SUMMER, FALL or WINTER
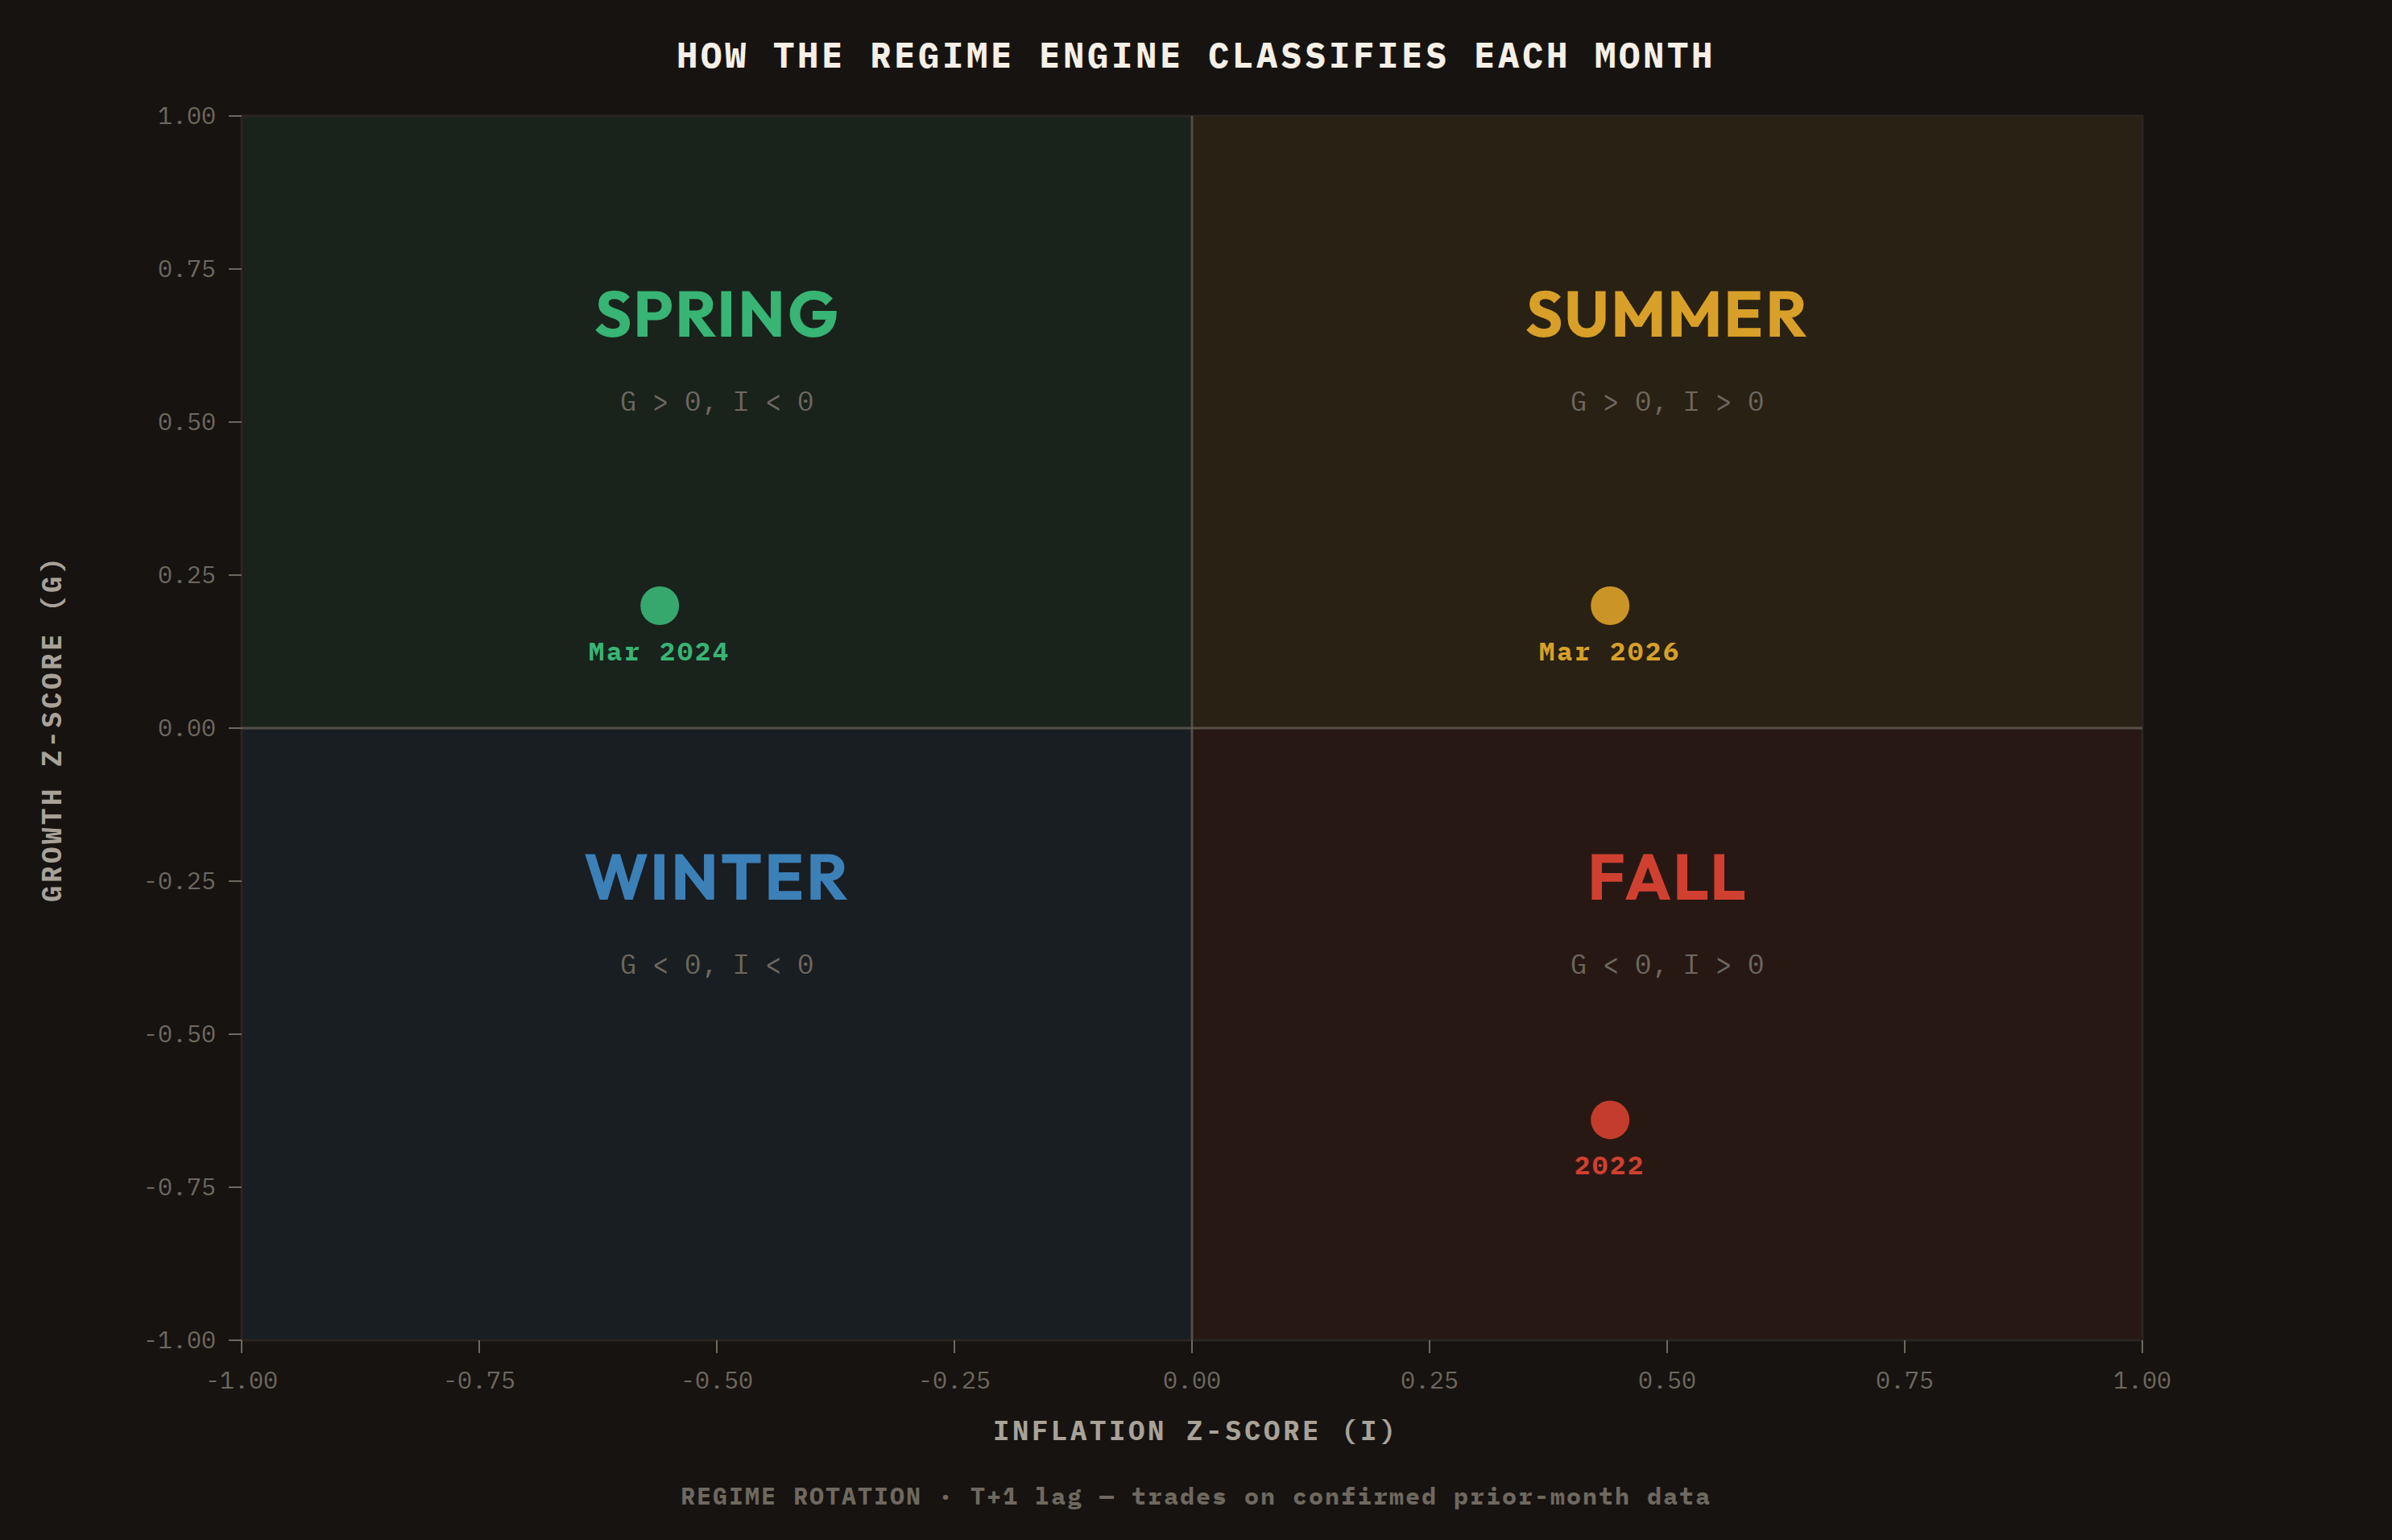
This is classified using a regime modelling engine that reads 44 economic indicators across growth, inflation and liquidity conditions. Based on that classification, the strategy rotates into a specific basket of ETFs suited to that regime. No forecasting. No opinions. No discretionary decision-making once the system is running.
The regime classification lags by one month. This is by design to avoid lookahead bias. More on this later…
I could walk you through nine years of returns, one year at a time, but I’m not going to lie I have shit to do and this is free… and also because most of those years were decent years for equities and a strategy that beats SPY during a bull run isn't particularly interesting.
2022 is interesting:
The S&P 500 fell ~19.5% in 2022. The 60/40 portfolio — what many overpaid financial advisers continue to sell as "balanced" — had one of its worst years on record, with AOR down ~17.3%. Bonds didn't hedge equities because both were being destroyed by the same thing: the fastest rate-hiking cycle in forty years. If you held a conventional ‘diversified’ portfolio in 2022, you were not a happy bunny…
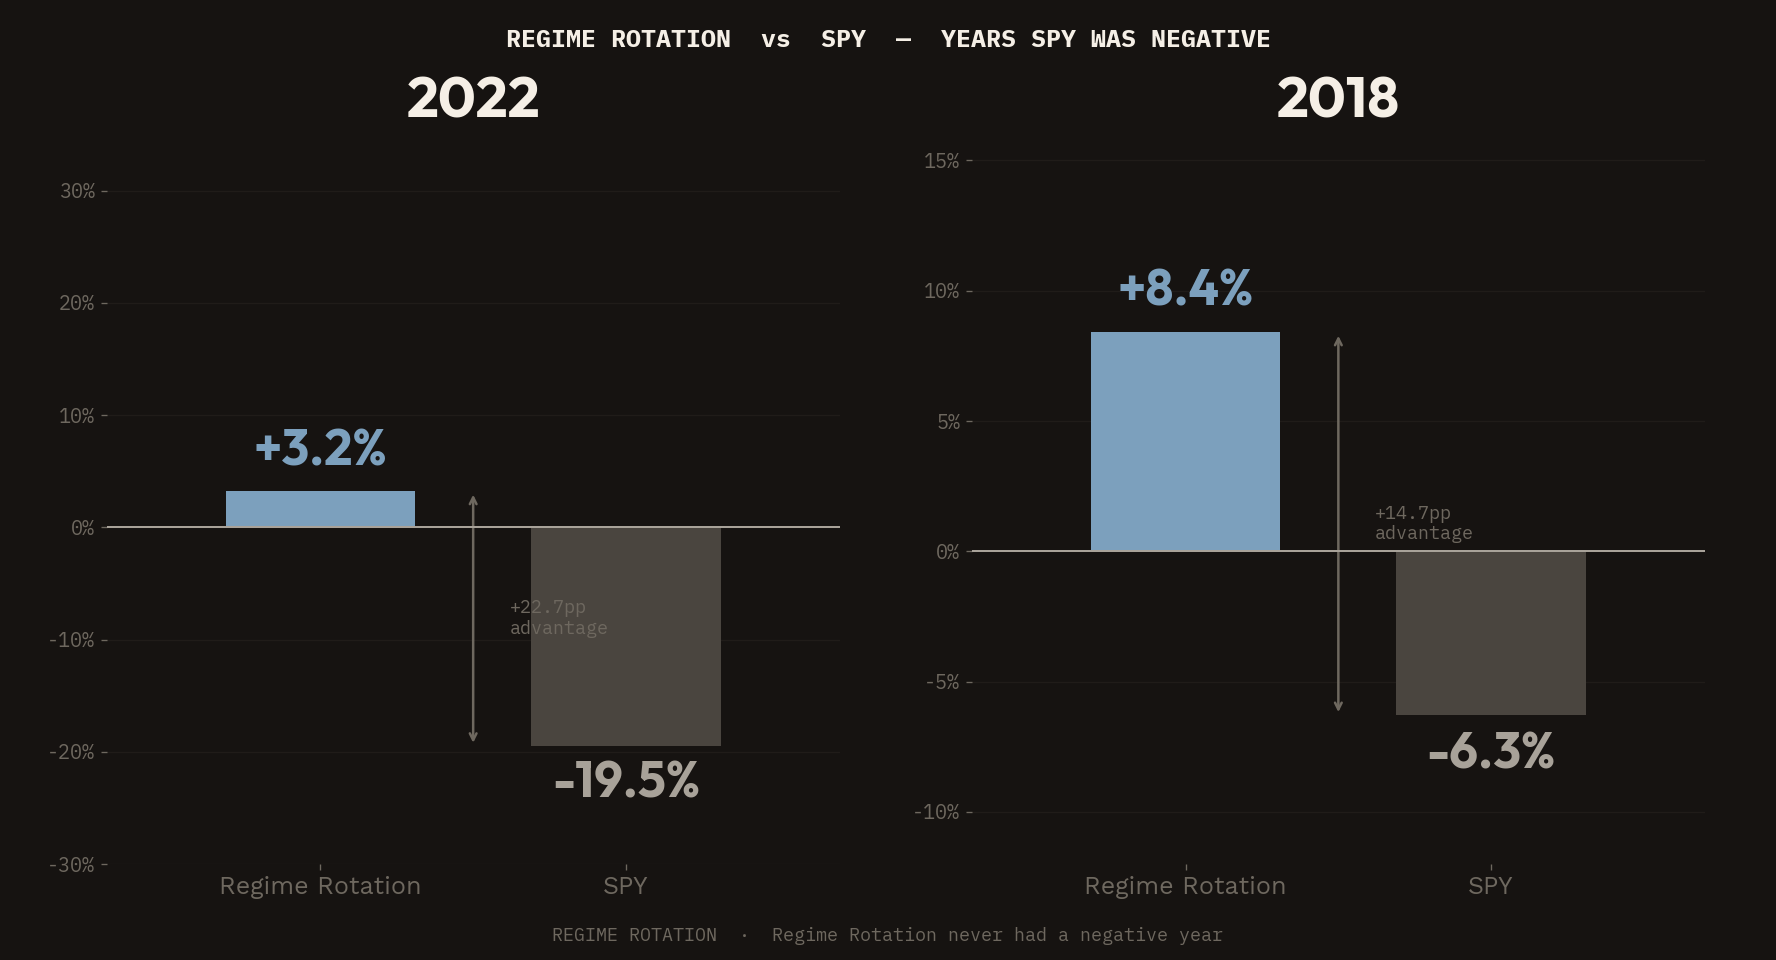
The regime engine spent most of 2022 in FALL.
The FALL allocation goes into gold, intermediate Treasuries, the dollar, and defensive consumer staples. Because the macro data said FALL, REGIME ROTATION returned +3.2% that year.
The same logic applies to 2018.
Q4 2018 was a painful tech-led correction. SPY finished the year −6.3%. The system was in FALL allocation for most of the back half. The strategy finished +8.4%.
And remember - this is with a one month lag in regime classification to avoid lookahead.
Two of the hardest years for conventional portfolios in the last decade. Both positive for REGIME ROTATION.
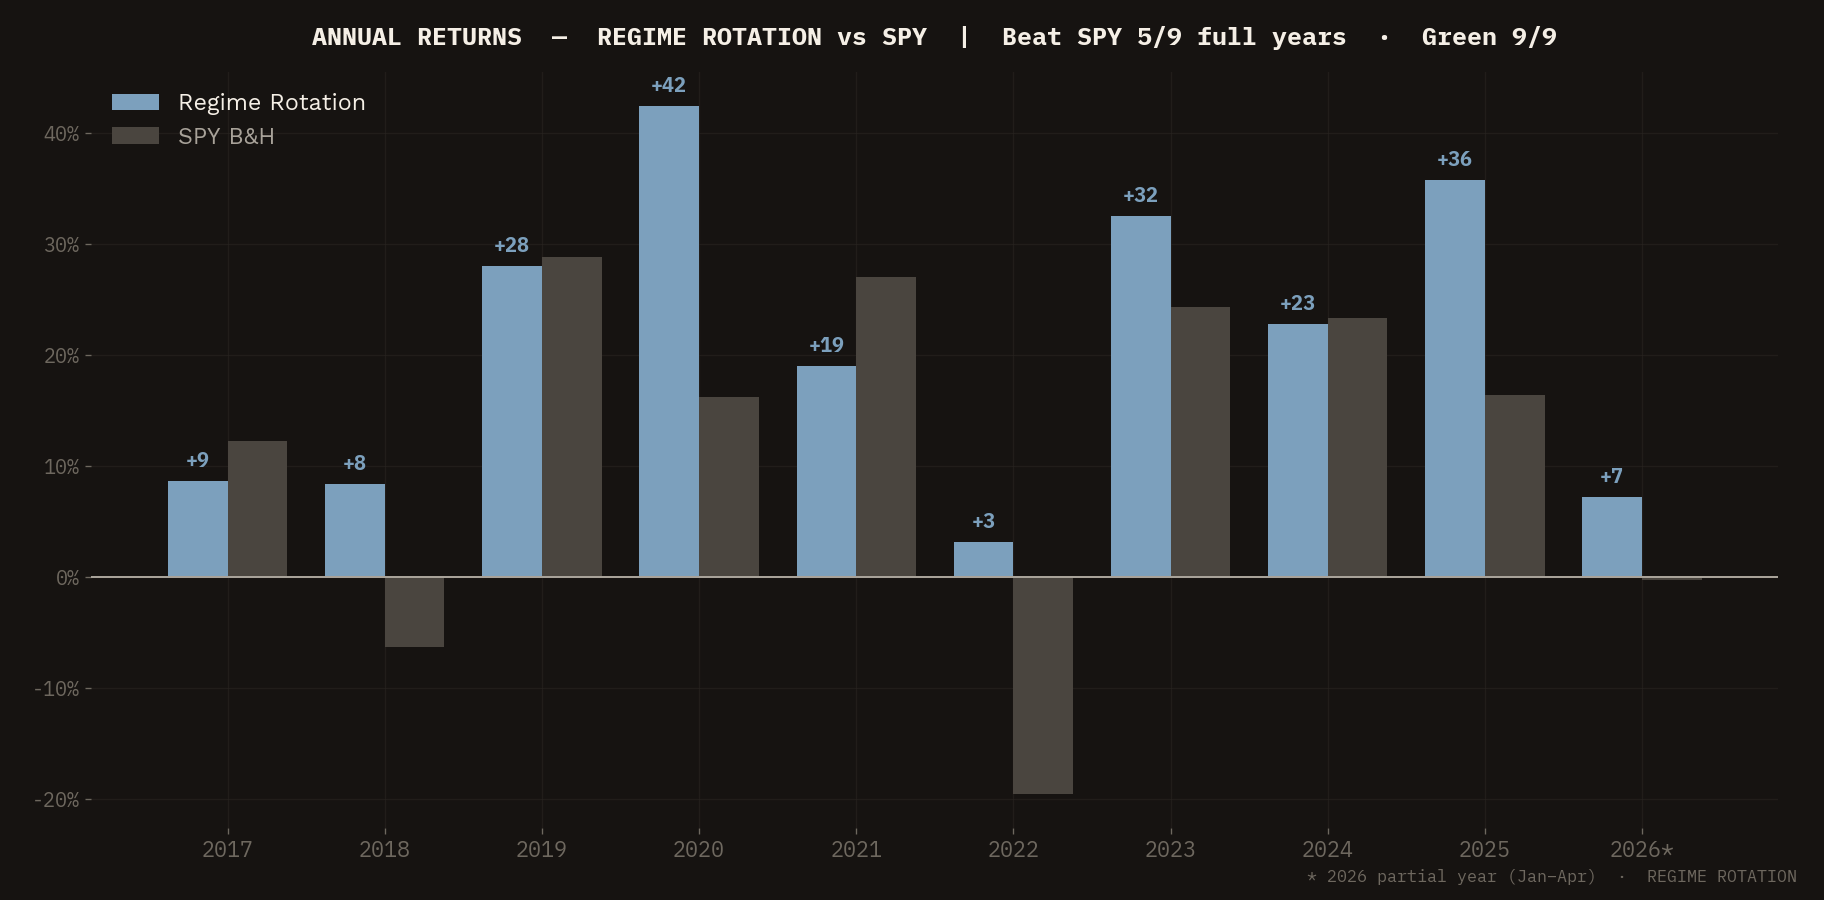
From March 2017 through April 2026 — 9.1 years of daily returns — Regime Rotation has not had a down year. Not 2018. Not following the COVID crash of March 2020. Not 2022. Not as a result of 2025's tariff-driven correction where SPY drew down 16.8% at its worst before recovering. For comparison’s sake, here’s the full set of headline stats:
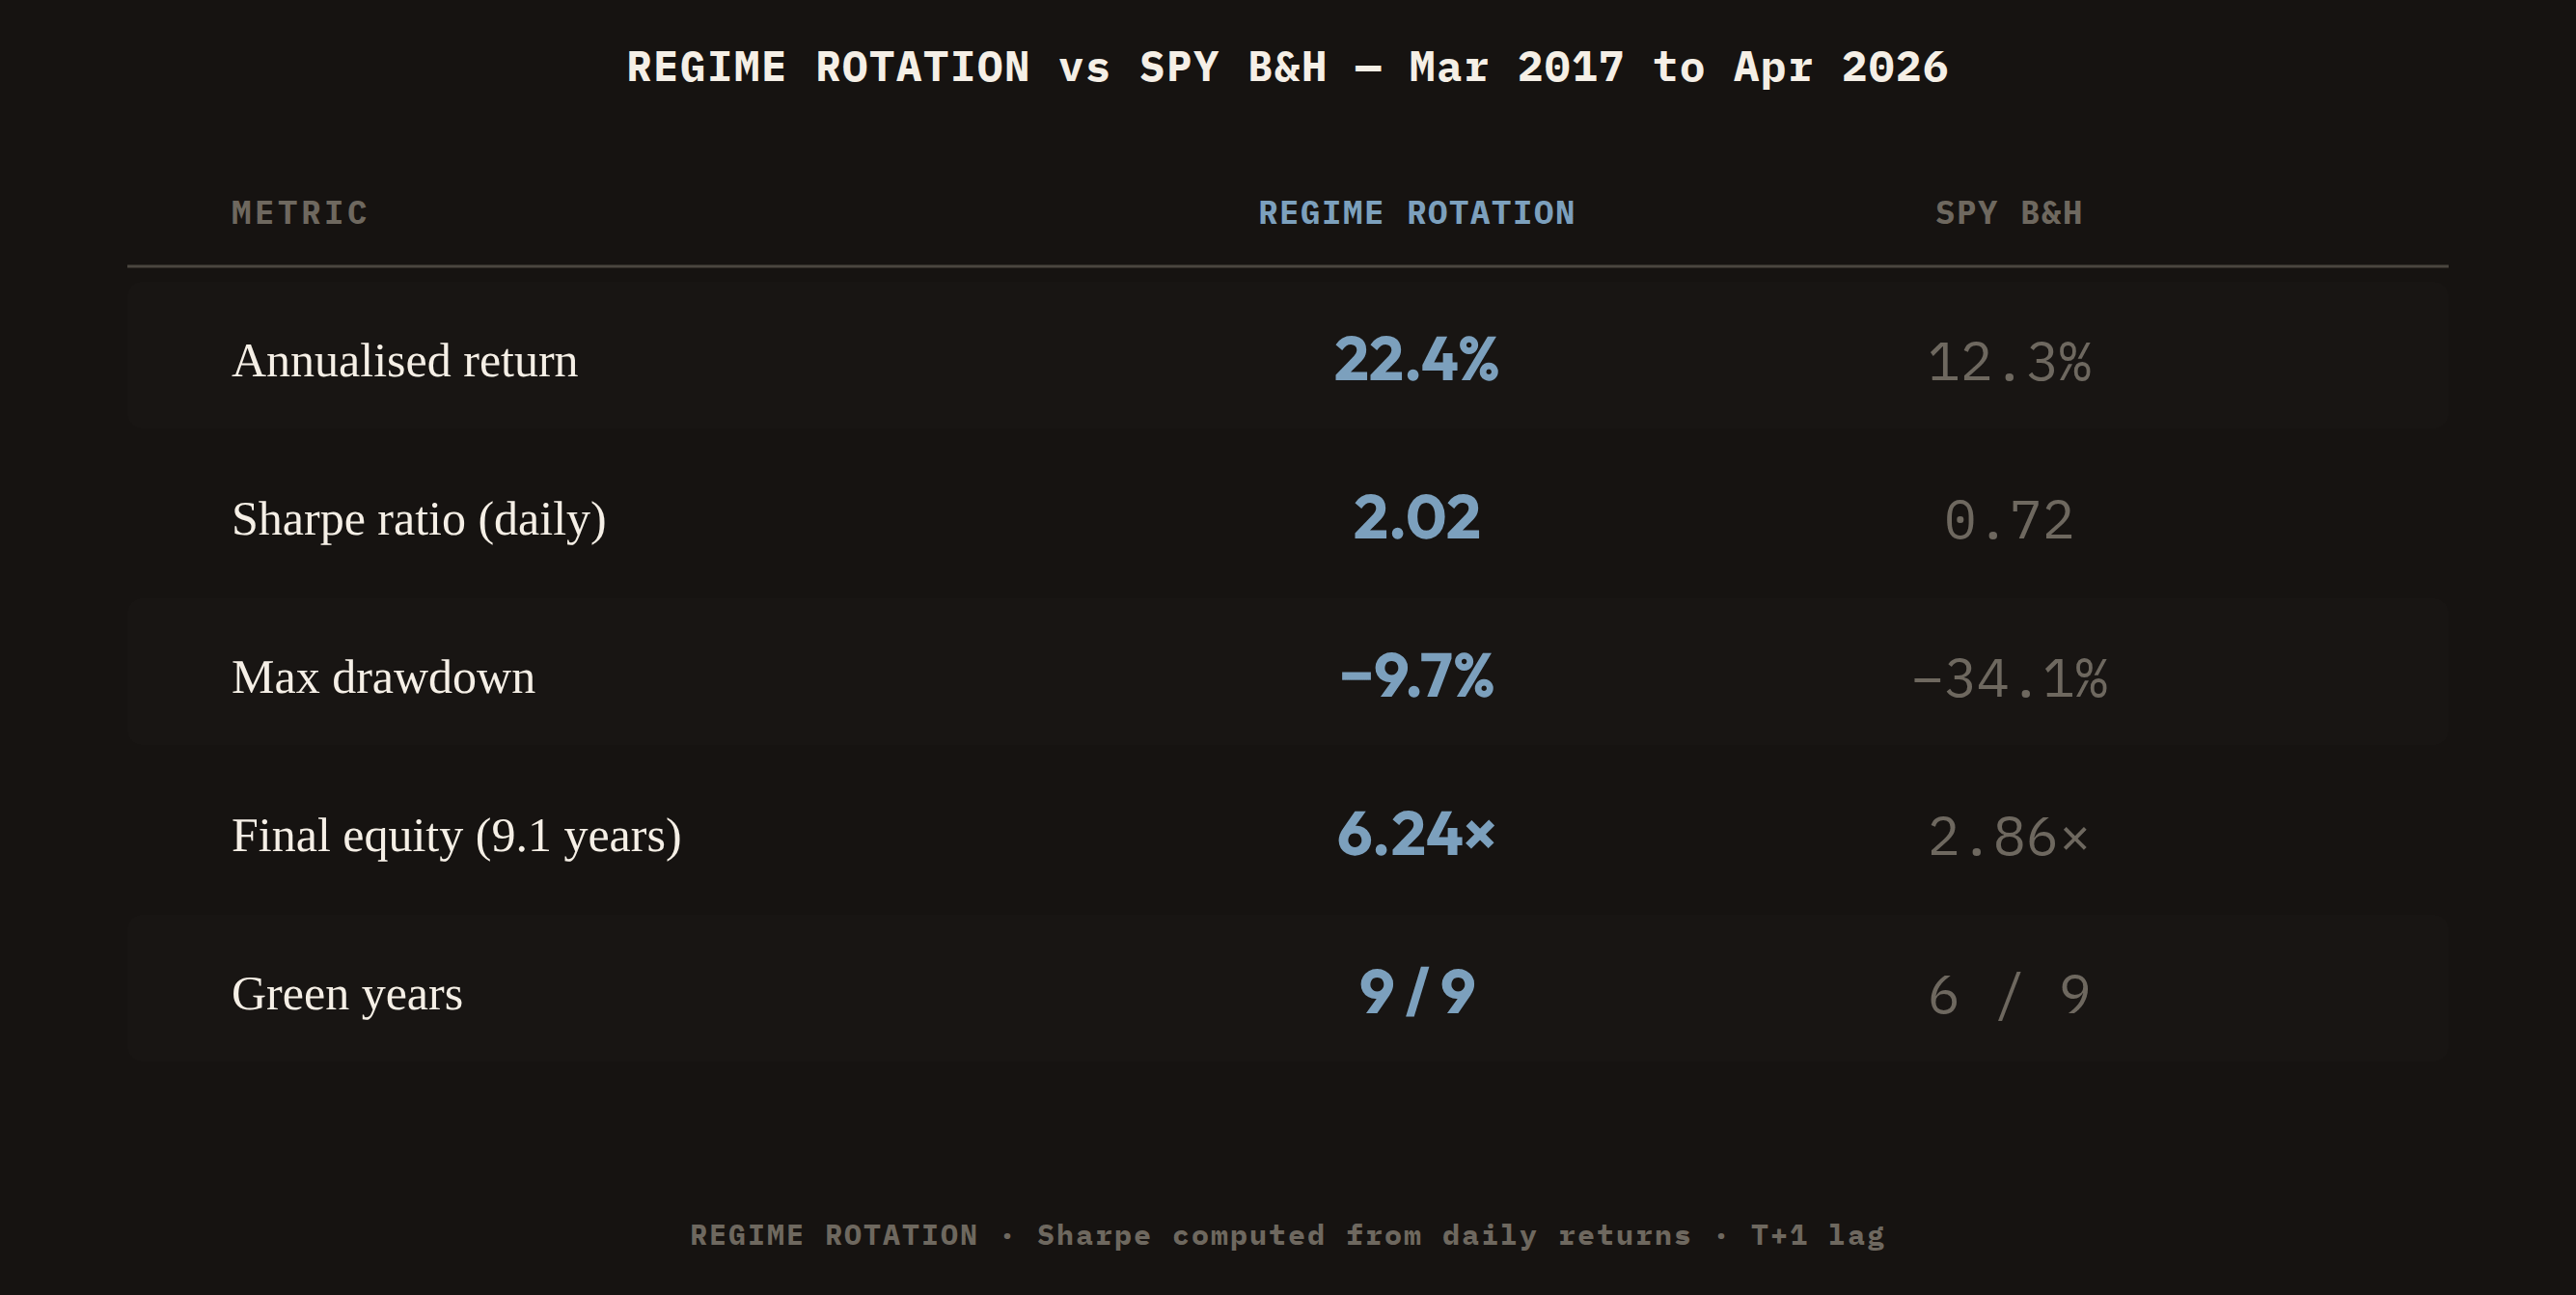
The number that matters most here to many of you is likely max drawdown. A peak-to-trough (close-to-close) decline of 9.7% over nine years. SPY's worst drawdown over the same period was 34.1%.
REGIME ROTATION and SPY are a completely different experience in investing.
The strategy recovered from its maximum drawdown (trough-to-flat) in 21 trading days. SPY took 103 trading days.
Double the return of the benchmark. At half the volatility.
This is by design - and this is the alpha in the regime modelling.
And when it did fall, REGIME ROTATION recovered five times faster.
Can you tell I’m a little bit pleased with myself? Okay, enough patting myself on the back - let’s get stuck into the big question:
The question I would ask about any backtest is simple: how hard did you try to break it and from how many different angles?
14 independent validation tests and robustness checks were run on REGIME ROTATION.
Let me be clear - I am not a quant. I needed help with this part of the process.
All of these tests are specifically designed to expose what I - as an overenthusiastic market participant - might be overlooking:
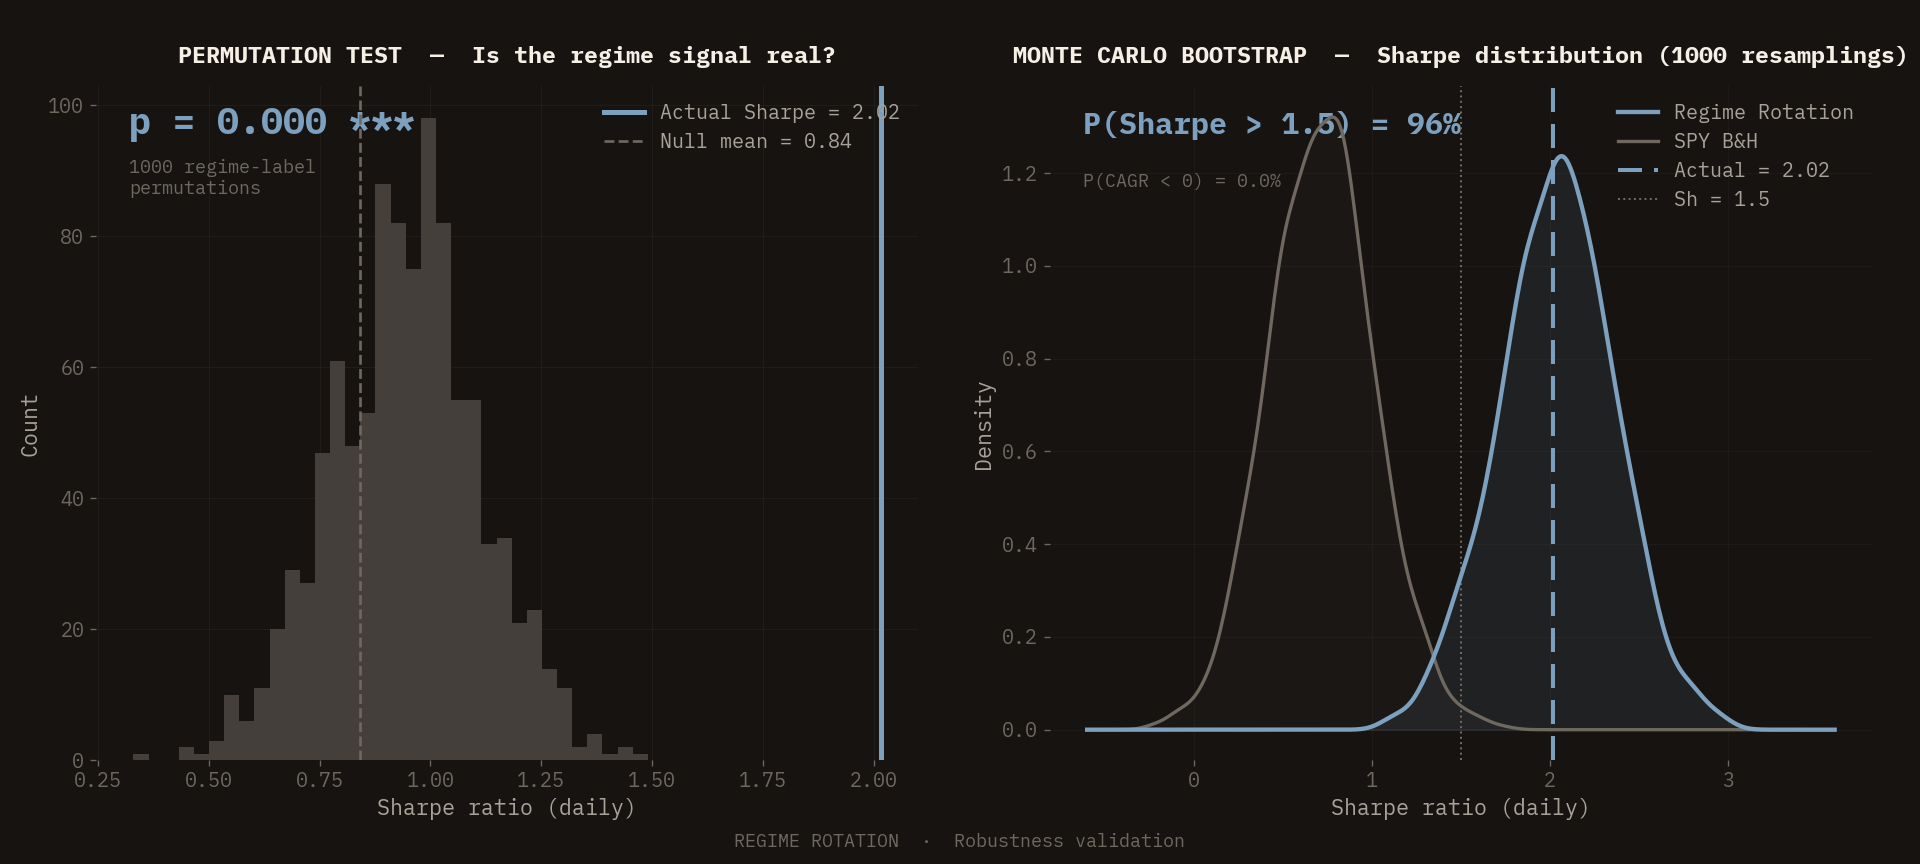
Permutation tests to check the regime signal is real. Bootstrap resampling to see whether the track record is fragile. Walk-forward analysis rolling forward one year at a time - the way live deployment actually works. ‘White's Reality Check’ against a thousand random portfolios built from the same ETF universe. The headline results:
The permutation test shuffled the historical regime labels 1,000 times, breaking any link between the classification and the macro environment, while keeping all allocations and rules identical. Then it asked: could the strategy's Sharpe ratio have been produced by a meaningless signal? The strategy sits at the 100th percentile of 1,000 shuffles. p-value: < 0.001.
The walk-forward analysis tested the strategy across 33 rolling one-year windows. In 31 of 33 windows the strategy beat SPY on Sharpe. Zero windows had a negative CAGR.
The OOS validation split is May 2021. The test asks whether the same frozen rule-set retains its performance in the later period rather than relying only on the earlier sample. The out-of-sample Sharpe is 1.87 — 84% of the in-sample Sharpe of 2.24. For context: SPY's own out-of-sample Sharpe retention over the same split is 84.7%. The strategy degrades on unseen data at roughly the same rate as the passive benchmark degrades on itself.
White's Reality Check generated 1,000 random portfolios from the identical ETF universe and asked whether pure luck — the right universe, the wrong signal — could explain the result. Zero of 1,000 random same-universe portfolios beat the strategy on Sharpe.
The point of all of this is simply that I believe I have put my regime model and its strategies through a lot of robustness checks and overfitting validation; the only legitimate response to "trust my backtest" is a systematic attempt to break it. Many serious attempts have been made.
All subscribers receive REGIME ROTATION for free forever.
If you want to buy me a beer, please use 0x664Cb61FA16d02a74Cb8C416167210C66835eF08 as a tipjar - or donate to your local animal charity.
For REGIME ROTATION: every month, on the first Friday after the regime classification is confirmed, I will publish a positioning and macro regime update.
It tells you: the current regime, any change from last month, the ETF allocations for this month, and the relevant macro context.
One monthly post. Fifteen minutes of implementation. No intra-month management required.
The FALL allocation in particular is built around capital preservation first. That's why the drawdowns are shallow. It's not a coincidence that the two years the strategy outperformed most were the two years conventional portfolios bled — 2018 and 2022. The defensive positioning is a huge component.
(At some point, I will release my long/short & regime-conditioned levered variant of REGIME ROTATION: this is what I have been live-testing in public on X and is replacing my own passive portfolio. Headline stats: 45.5% CAGR, 2.03 Sharpe and beat SPY every single year with a max close-to-close drawdown of 13.4%. It has traded 14 consecutive green weeks in live testing. This is naturally not going to be for beginners or those just looking to replace passive and is inherently more risky given the use of a persistent short overlay and leverage, as well as dynamic weighting etc. - but if you are an experienced investor, once I am happy with how the strategy is performing in live conditions, it will be made available…)
May 2026 data confirms Overheat - or SUMMER. Growth remains elevated above its recent trend. Inflation is still running above the comfortable range. Liquidity conditions are supportive.
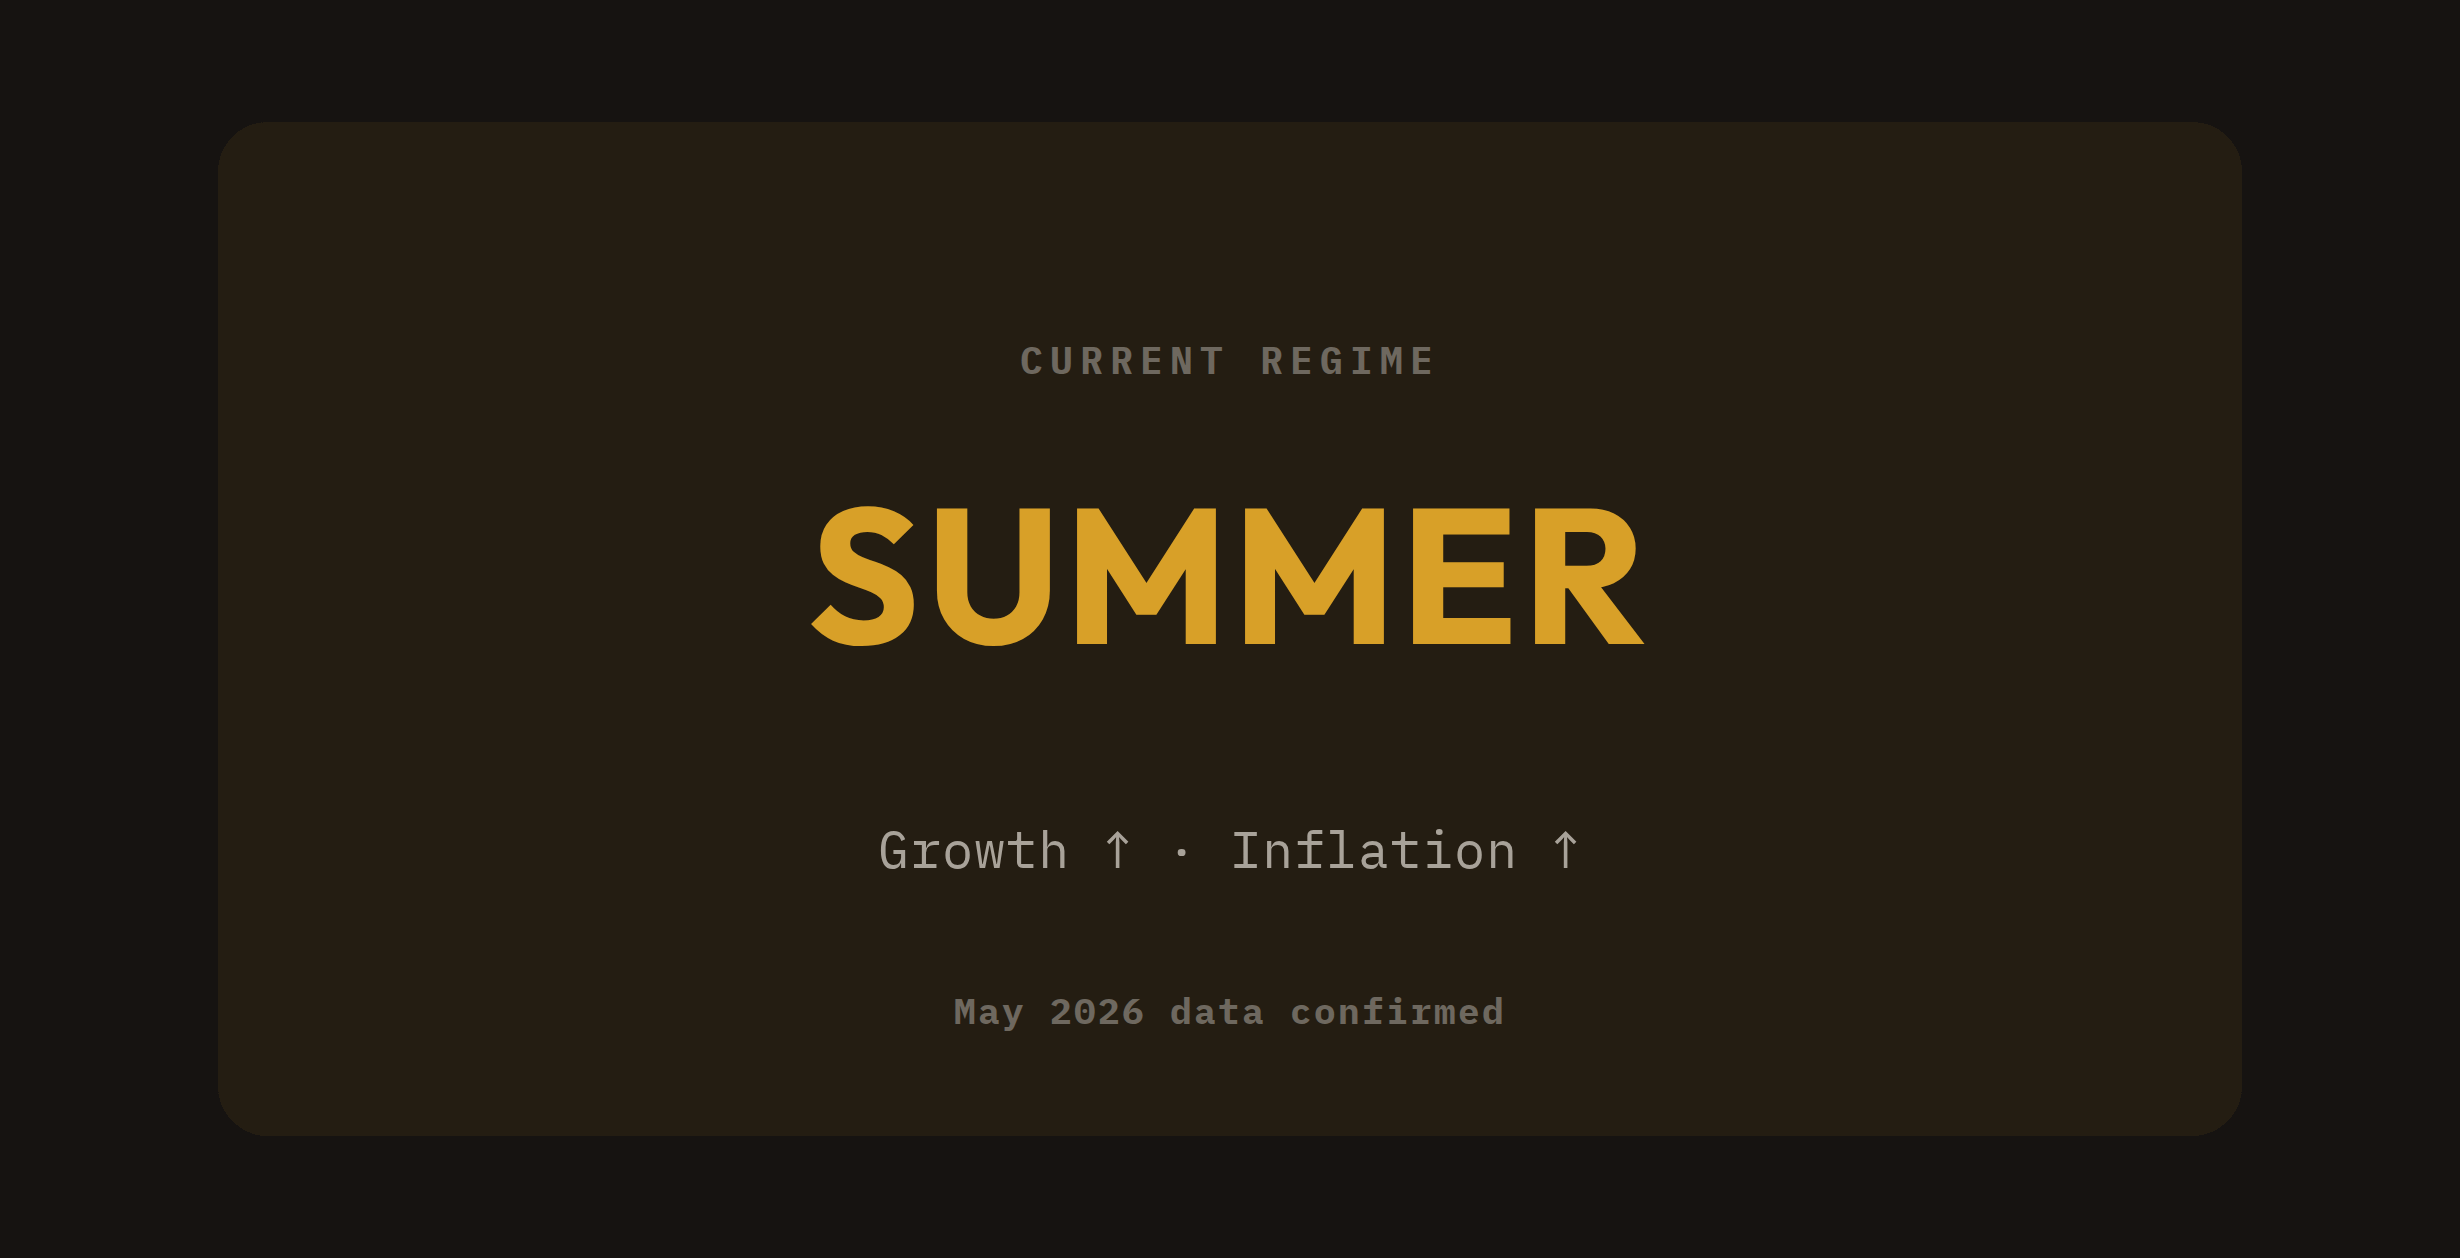
The SUMMER allocation for REGIME ROTATION leans into energy, broad commodities, healthcare and tech:

You can also find the Trade Ticket on the live dashboard:
You can see from above that I have also built a free live dashboard for you all.
This is a standalone webpage you can open in any browser that shows the full backtest history, the current regime, monthly and annual returns, the trade ticket, and the robustness validation suite.
It also connects to a live data feed via a Google Apps Script backend, so the equity curve extends week by week as the strategy runs in real time.
It's fully self-contained. There's nothing to install. It works offline from the baked backtest data, and optionally fetches live prices when you connect it to the backend.
If you have have any questions, feel free to leave them in the comments.
I will have more thorough documentation, explainers, FAQs etc. out over the coming weeks, along with a UCITS-friendly companion.
If you’re planning on implementing REGIME ROTATION, it is worth live testing for a while before you go in guns blazing.
I hope it helps.
Backtested performance is hypothetical and has inherent limitations. It does not guarantee future results. All figures from daily OHLC backtest: 2017-03-06 to 2026-04-09. No transaction costs and 4% cash yield modelled. Monthly ETF implementation friction is expected to be very low but will vary by broker, spread and execution. This is research and education only — not investment advice, not a recommendation, and not a solicitation to buy or sell any security.
No posts
Comments
Nothing yet. Say the first thing.
Sign in to join the conversation.