
If you have ever attempted to draw a Bezier curve in a graphics application such as Inkscape you may have found it baffling and frustrating. Bezier curves are defined relative to control points but how these affect the curve isn’t always obvious. In this article I will write Python code to illustrate how the curve is derived from the points and I hope you find the output instructive.
As Confucius didn’t say “a picture is worth a thousand words” so to start I’ll show you a Bezier curve with its secrets exposed. I’m sure you will find it instantly enlightening.
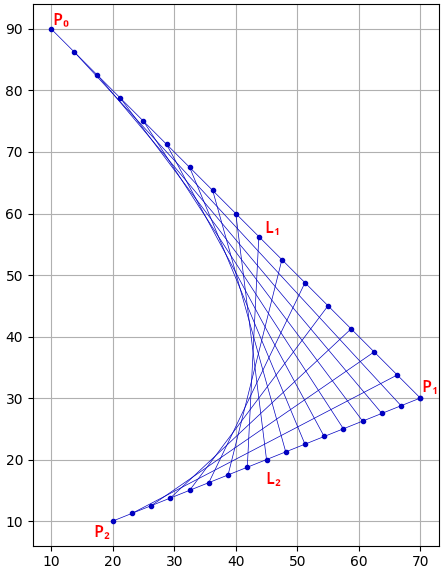
This is an annotated version of the Matplotlib output created by this article’s code. The points P0, P1 and P2 are key to the whole process of creating a Bezier curve. In this article I will look at curves with three control points; these are known as quadratic Bezier curves. These are the salient points to remember:
P0 and P2 are the ends of the curve
P1 governs the behaviour of the curve between its end points
The start and end points of the intermediate lines are equally spaced along the lines between the control points L1 and L2
Given enough intermediate lines the outermost intersection points give an acceptable illusion of a curve
The code to create this illustration contains data structures to represent the points and the inter-point lines which are then used to create a data structure of the intermediate lines. This last data structure is then plotted by Matplotlib.
This project consists of the following files which you can find in the GitHub repository.
namedtuples.py
bccalc.py
bcplot.py
bcdemo.py
In Part 2 I will extend the code to calculate and plot just the points along the curve. For Part 3 I will develop an interactive Bezier curve interface using PyGame.
In this file three named tuples are defined to make the code that calculates points, lines and the distances of the intermediate lines clearer.

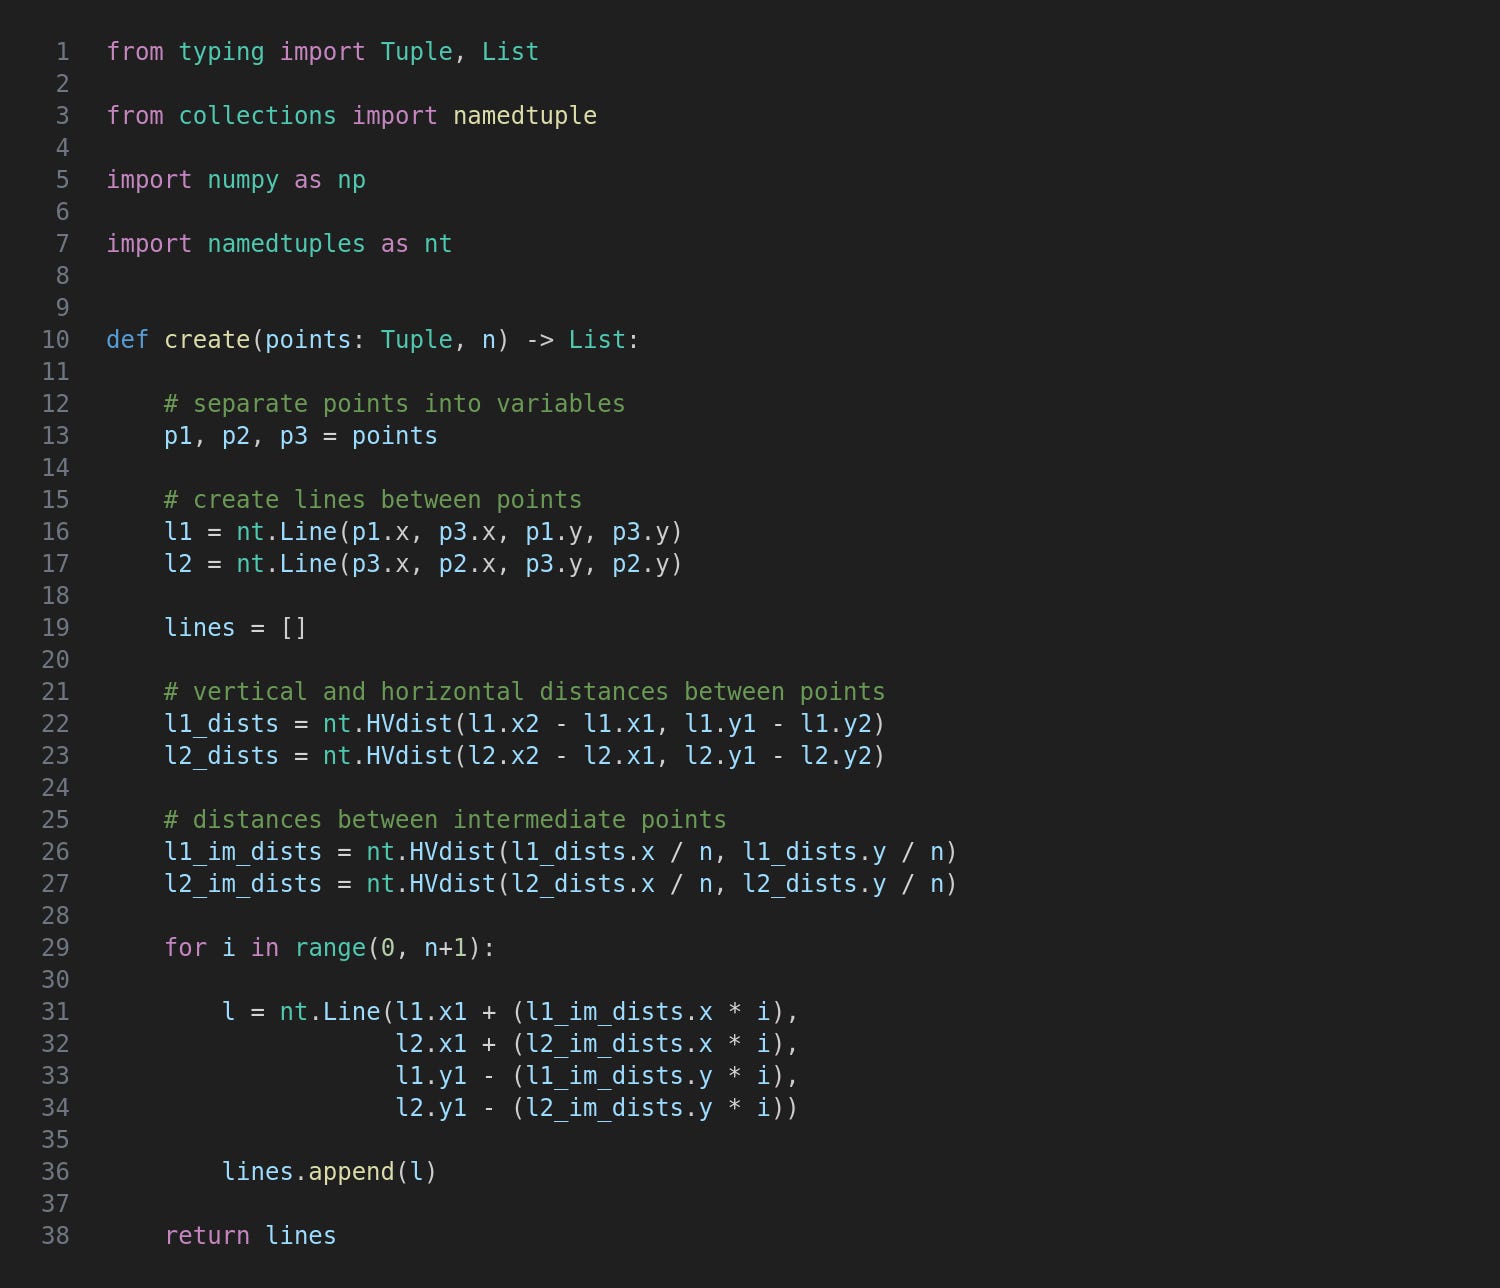
This is where the hard work is done. The arguments to the create function are a tuple of points - specifically named tuples from the previous file - and the number of intermediate lines to draw. The points are split out into separate variables purely to shorten the code using them.
The variables l1 and l2 connect the control points, and lines is an empty list to which new lines will be appended as they are created. Next we calculate the horizontal and vertical distances between intermediate lines along both the existing lines connecting the control points. Finally a for loop iterates the specified number of intermediate lines, calculating the coordinates of their endpoints and appending each new line to our list.
This is a very straightforward usage of the Matplotlib library. If you aren’t familiar with Matplotlib you might like to read my Matplotlib Reference article.
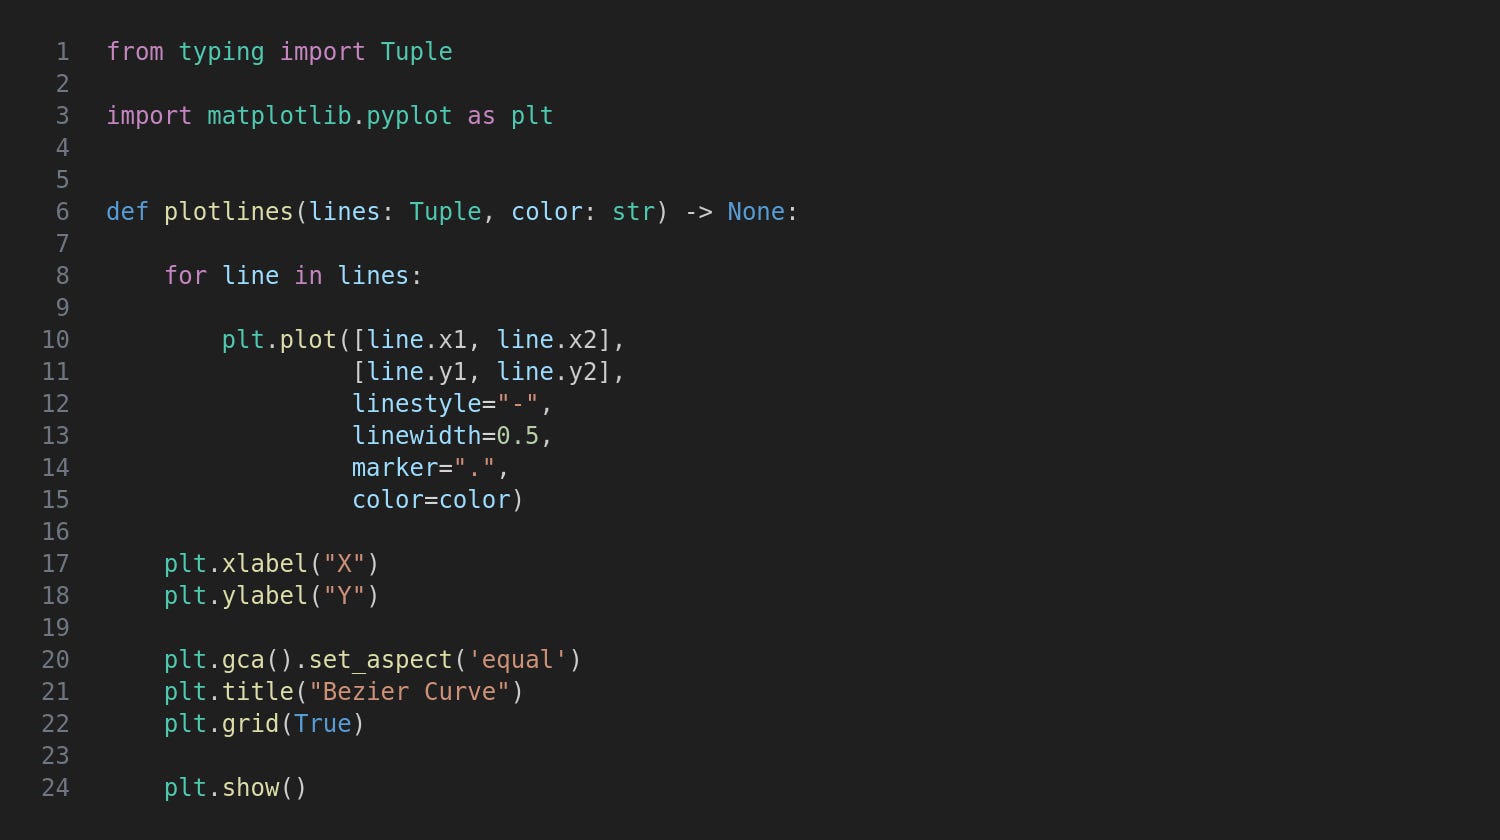
The plotlines function takes as arguments a list of lines created by the code in bccalc.py and a color. It then iterates the lines, calling Matplotlib’s plot method on each. Note that we need to set the aspect to equal as the units of each axis are of the same type; without this the plot would probably be distorted.
Now we just need to try the code out.
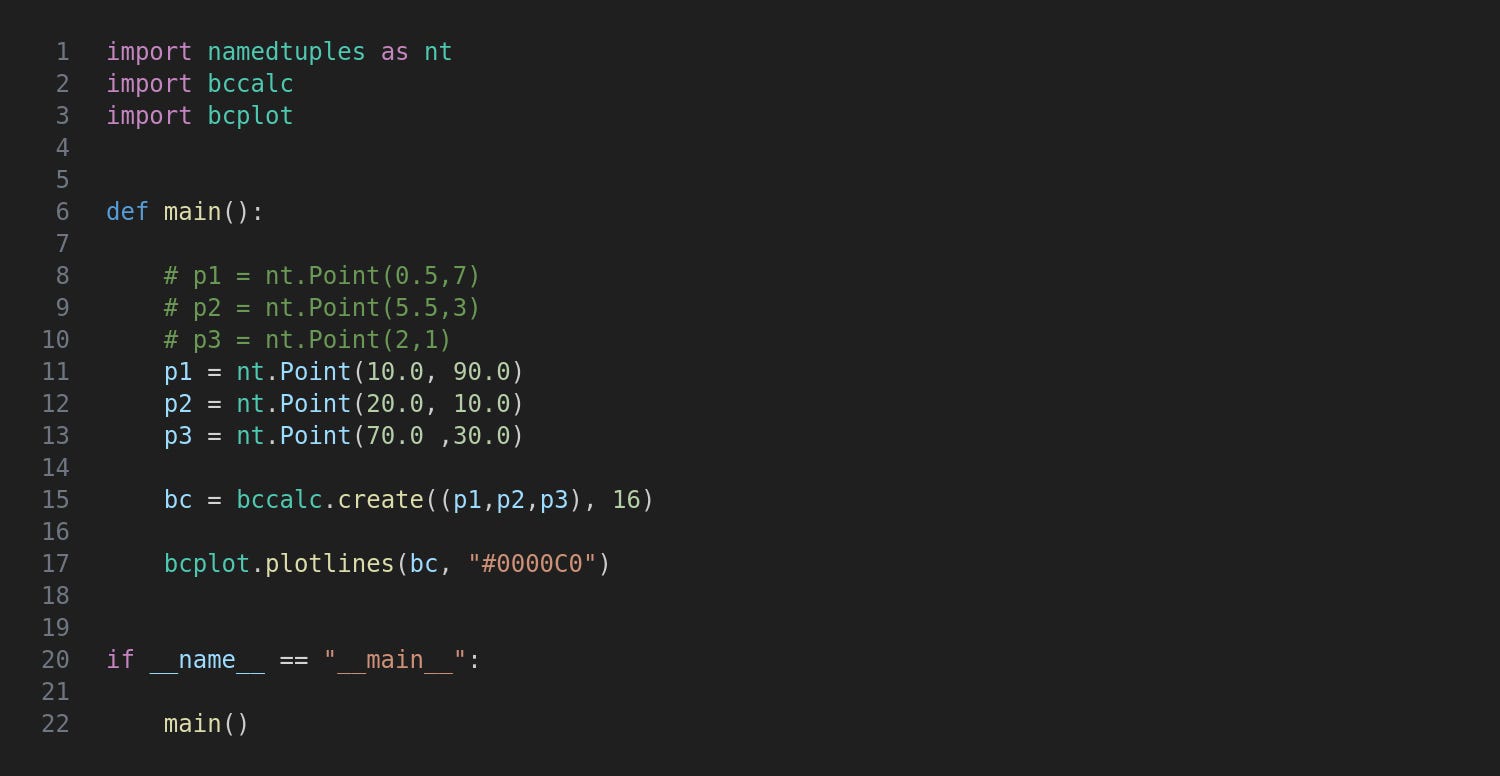
After importing the three previous files three points are created and passed to bccalc.create, the return value of which is of course a list of lines which are then passed to bcplot.plotlines.
Run the program with this command:
python3 bcdemo.py
This is the end result.
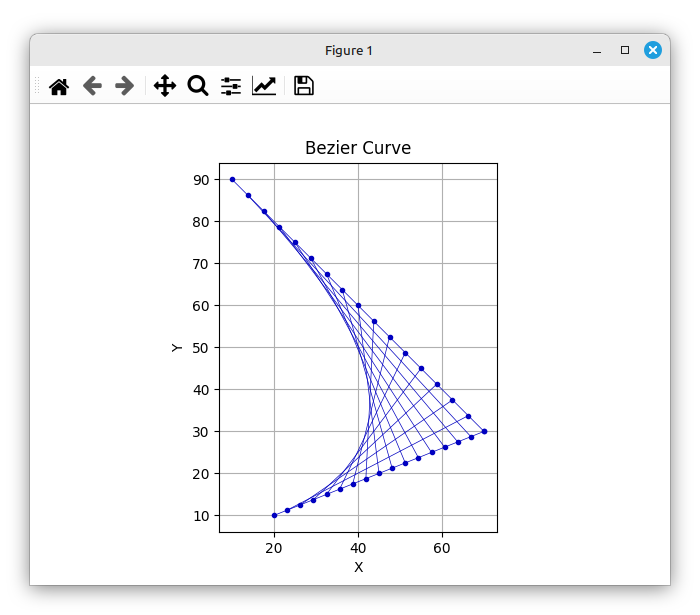
You may want to try out a few other combinations of control points by editing bcdemo.py or uncommenting the three already in the main function.
The code above gives a clear and intuitive demonstration of how a bezier curve is put together and how the three control points do their job. For the next part of this series I’ll isolate the outermost intersection points so that we can plot just the curves without their “scaffolding”.
For updates and random ramblings please follow me on Bluesky.
No AI was used in creating the code, text or images in this article.
Comments
Nothing yet. Say the first thing.
Sign in to join the conversation.