
Every week I’ll provide updates on the latest trends in cloud software companies. Follow along to stay up to date!
AWS CapEx ROI
The vast majority of earnings calls from public companies are pretty boring. But every now and then a CEO pulls back the curtain a bit and goes into a level of detail that I find fascinating. One of those calls was Jay Kreps from Confluent (on their Q1 ‘23 call) discussing the TCO advantages of using Confluent vs open source Kafka. On that call Jay went into a lot of detail about the differences between paying a cloud vendor vs hosting your own software. Jay’s one of the best infrastructure entrepreneur, so getting a peek into his brain like that was pretty cool.
Yesterday was another moment where I really geeked out on an earnings call. This time it was Andy Jassy from Amazon discussing the ROI on AI capex (which is clearly a very hot topic!). To set the stage, Amazon has guided to roughly $200b of CapEx in 2026. On the call yesterday they updated that guidance to $220b, and then Andy walked through why they believed the ROI was high on these capital investments.
First, he described two separate capital cycles that exist in this cumulative capex figure:
Data center
The equipment that goes into data centers (chips, servers, networking, etc)
On the data center component, he described these as 2 year projects. The spending starts 2 years before they can put any of the equipment into the data center. But once it’s up and running, it generates significant revenue on day 1, and continues to generate revenue for decades without another large up front expense (again, this is just for the data center capex build, not the equipment that goes in the data center). So think of the capital cycle as “decades” for the data center component.
On the equipment component, the cycles are much shorter. The lead time is months not years. It takes (in his words) 2 years to build a data center, so that spending starts 2 years before revenue hits. On the equipment side, he called out the purchasing hits “a few months” before they plug them in and data center starts generating revenue. This is important because as a company, they have strong visibility into the customer demand before making the purchase (again, because the lead time is months not years). If demand doesn’t exist, they don’t but the equipment. He called out a payback period of 3 years on the equipment, and a useful life of the equipment of “at least 5-6 years.” At the same time, most of their AI capacity is being contracted on 5 year terms. The important call out here - after hitting the payback period in ~3 years, the next 2-3 years print profits.
The last part to highlight is where these two capital cycles converge. A data center has a 30+ year useful life, while equipment has a 5-6 year useful life (again, according to Jassy). So each data center should see at least 5-6 "generations" of equipment cycle through it (the math there being 30 years divided by 5-6 years per equipment cycle). Every generation after the first has better economics than the one that preceded it, because the big upfront data center spend only happens once. The first generation of servers carries the data center build. Generations 2 through 6 just show up and print profits! (for the data center capex). That's why Andy was so willing to acknowledge the near term free cash flow headwinds. When you're building this many data centers all at once, and more importantly all ahead of monetization (with data centers having a 2 year lag), the cash outflows pile up before the revenue does. But his argument is that at some point revenue growth outpaces incremental capex growth, and the ROIC math takes over. What was cool was then Jassy compared this to a prior capex cycle - the first era of the cloud buildout. Andy claims AI margins are tracking core cloud margins at the same point in their respective evolution (or actually a little ahead). And the demand side isn't the constraint at all (which has been a very consistent message across all hyperscaler earnings calls). Even at $220b of capex they won't have enough capacity to meet 2026 demand, and he expects the same in 2027, and 2028 reservations are already coming. Then he dropped the mic at the end! Amazon used to think AWS could be a few hundred billion dollar revenue business. They now think it's a $1 trillion revenue business over time. Take with a grain of salt (every hyperscaler CEO is incentivized to tell this story right now), but it's quite a clear articulation of the AI capex bull case.
Quarterly Reports Summary

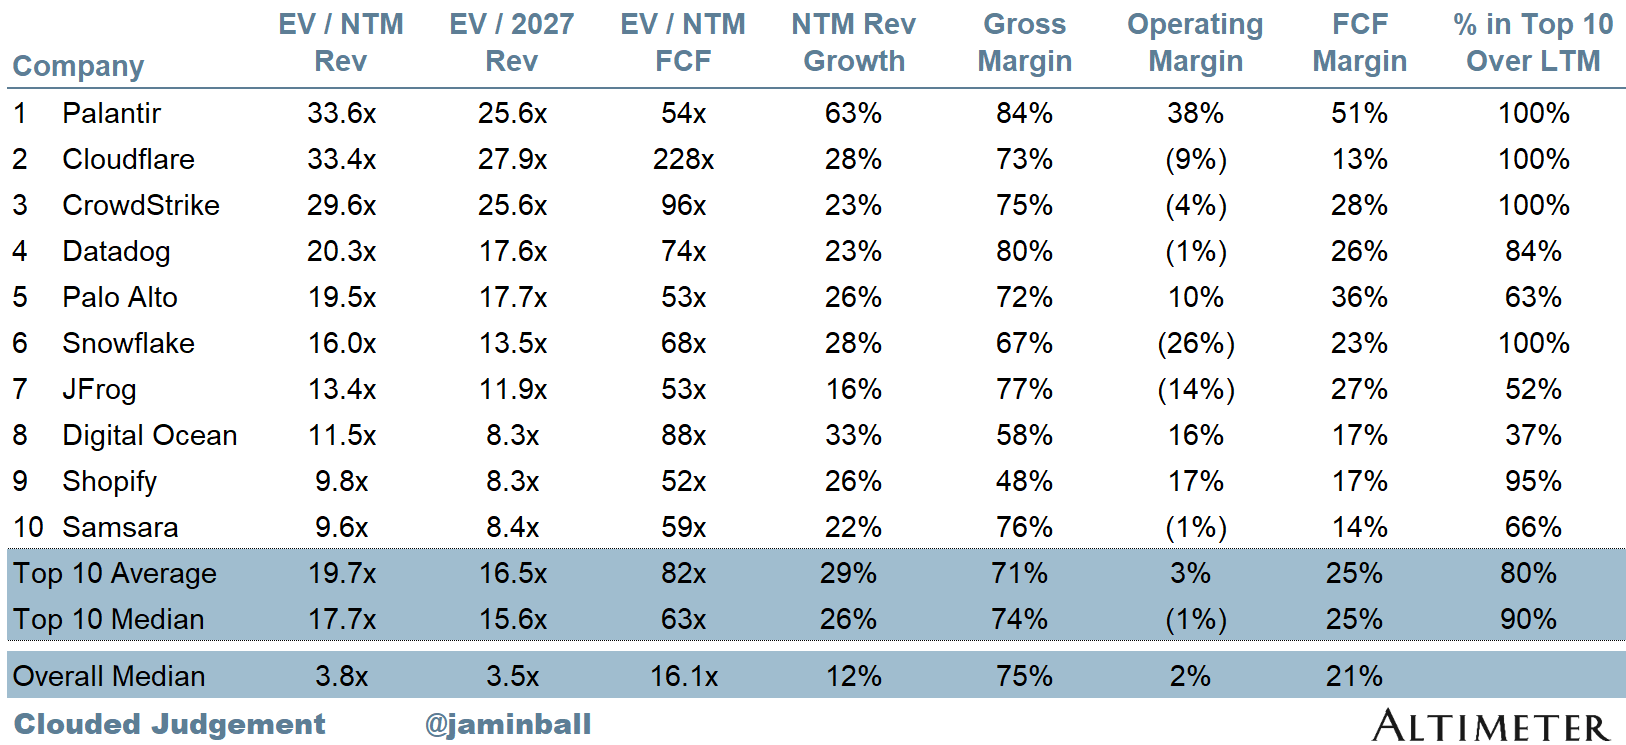
Top 10 EV / NTM Revenue Multiples
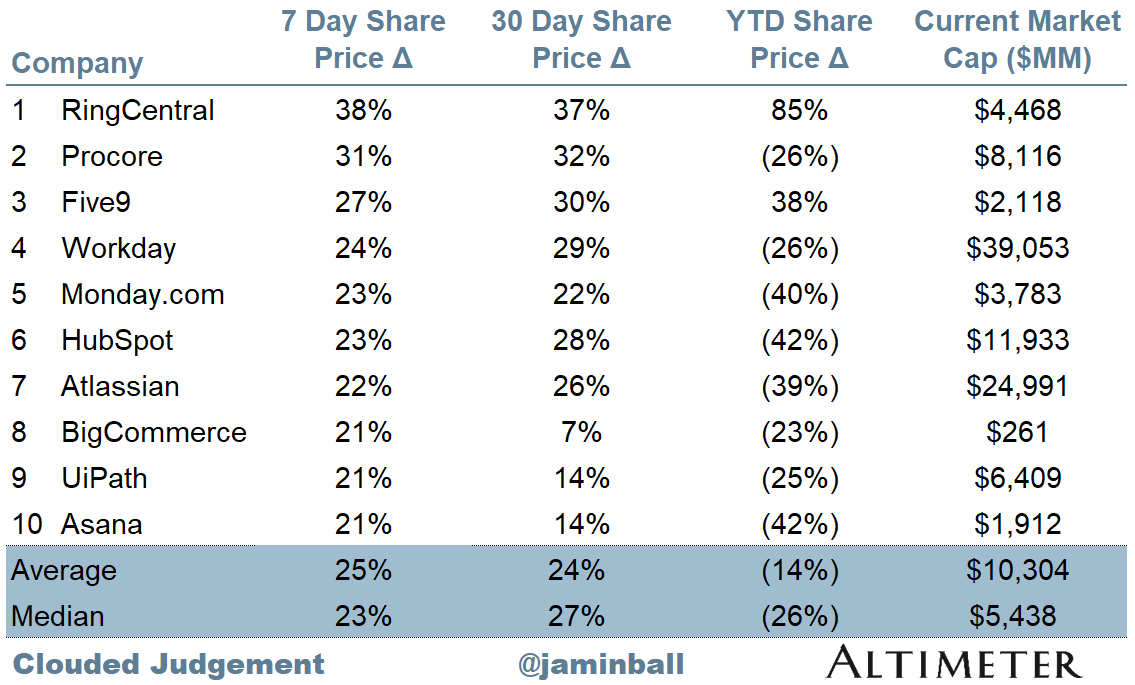
Top 10 Weekly Share Price Movement
Update on Multiples
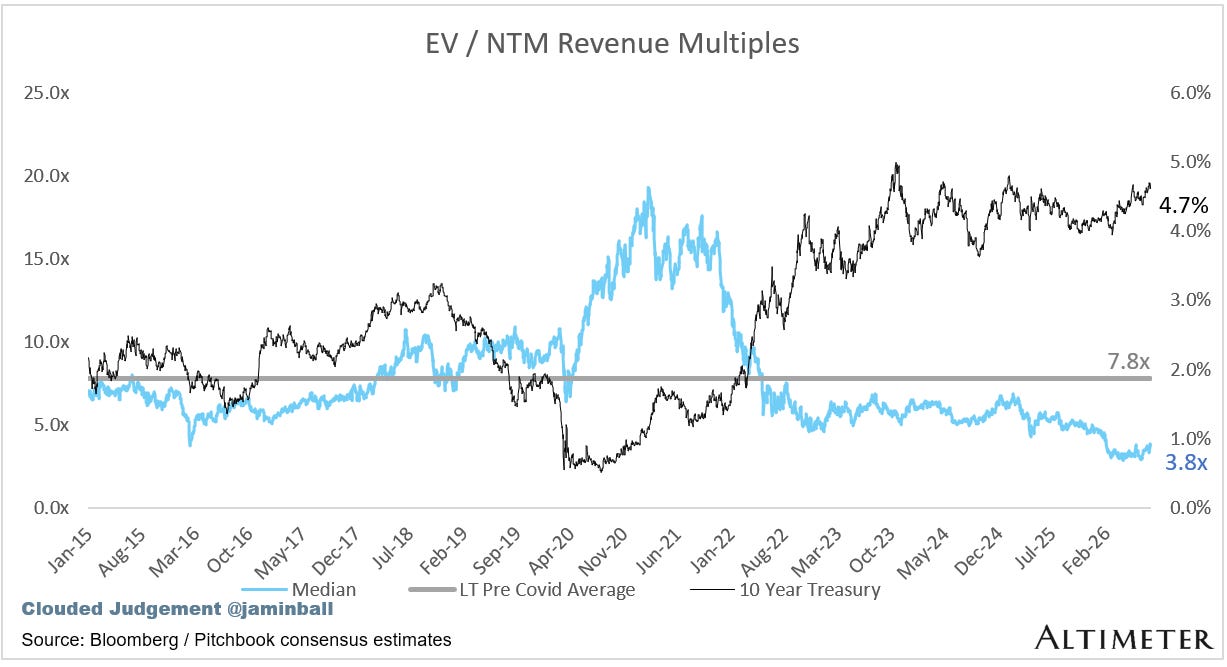
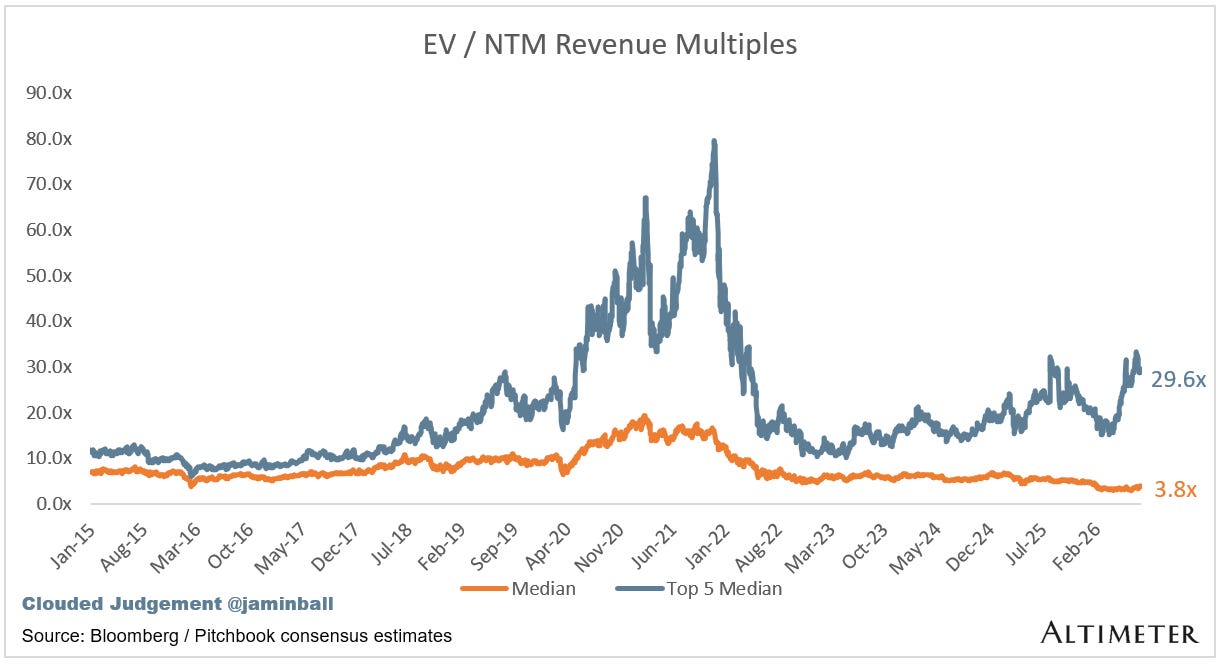
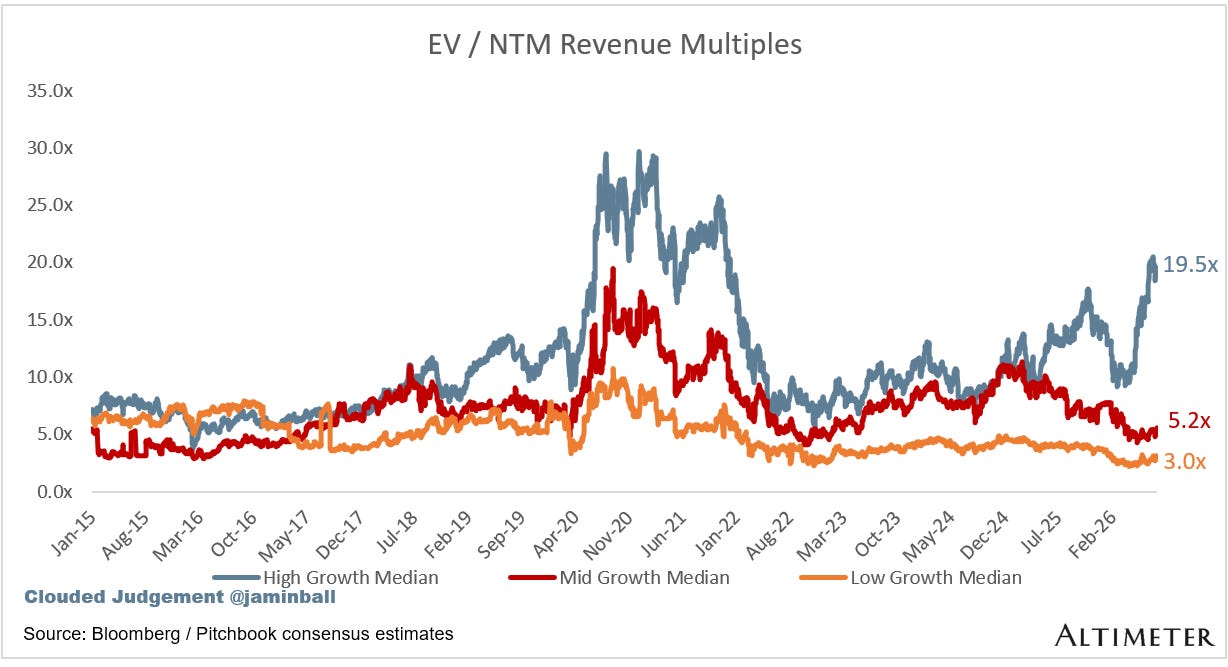
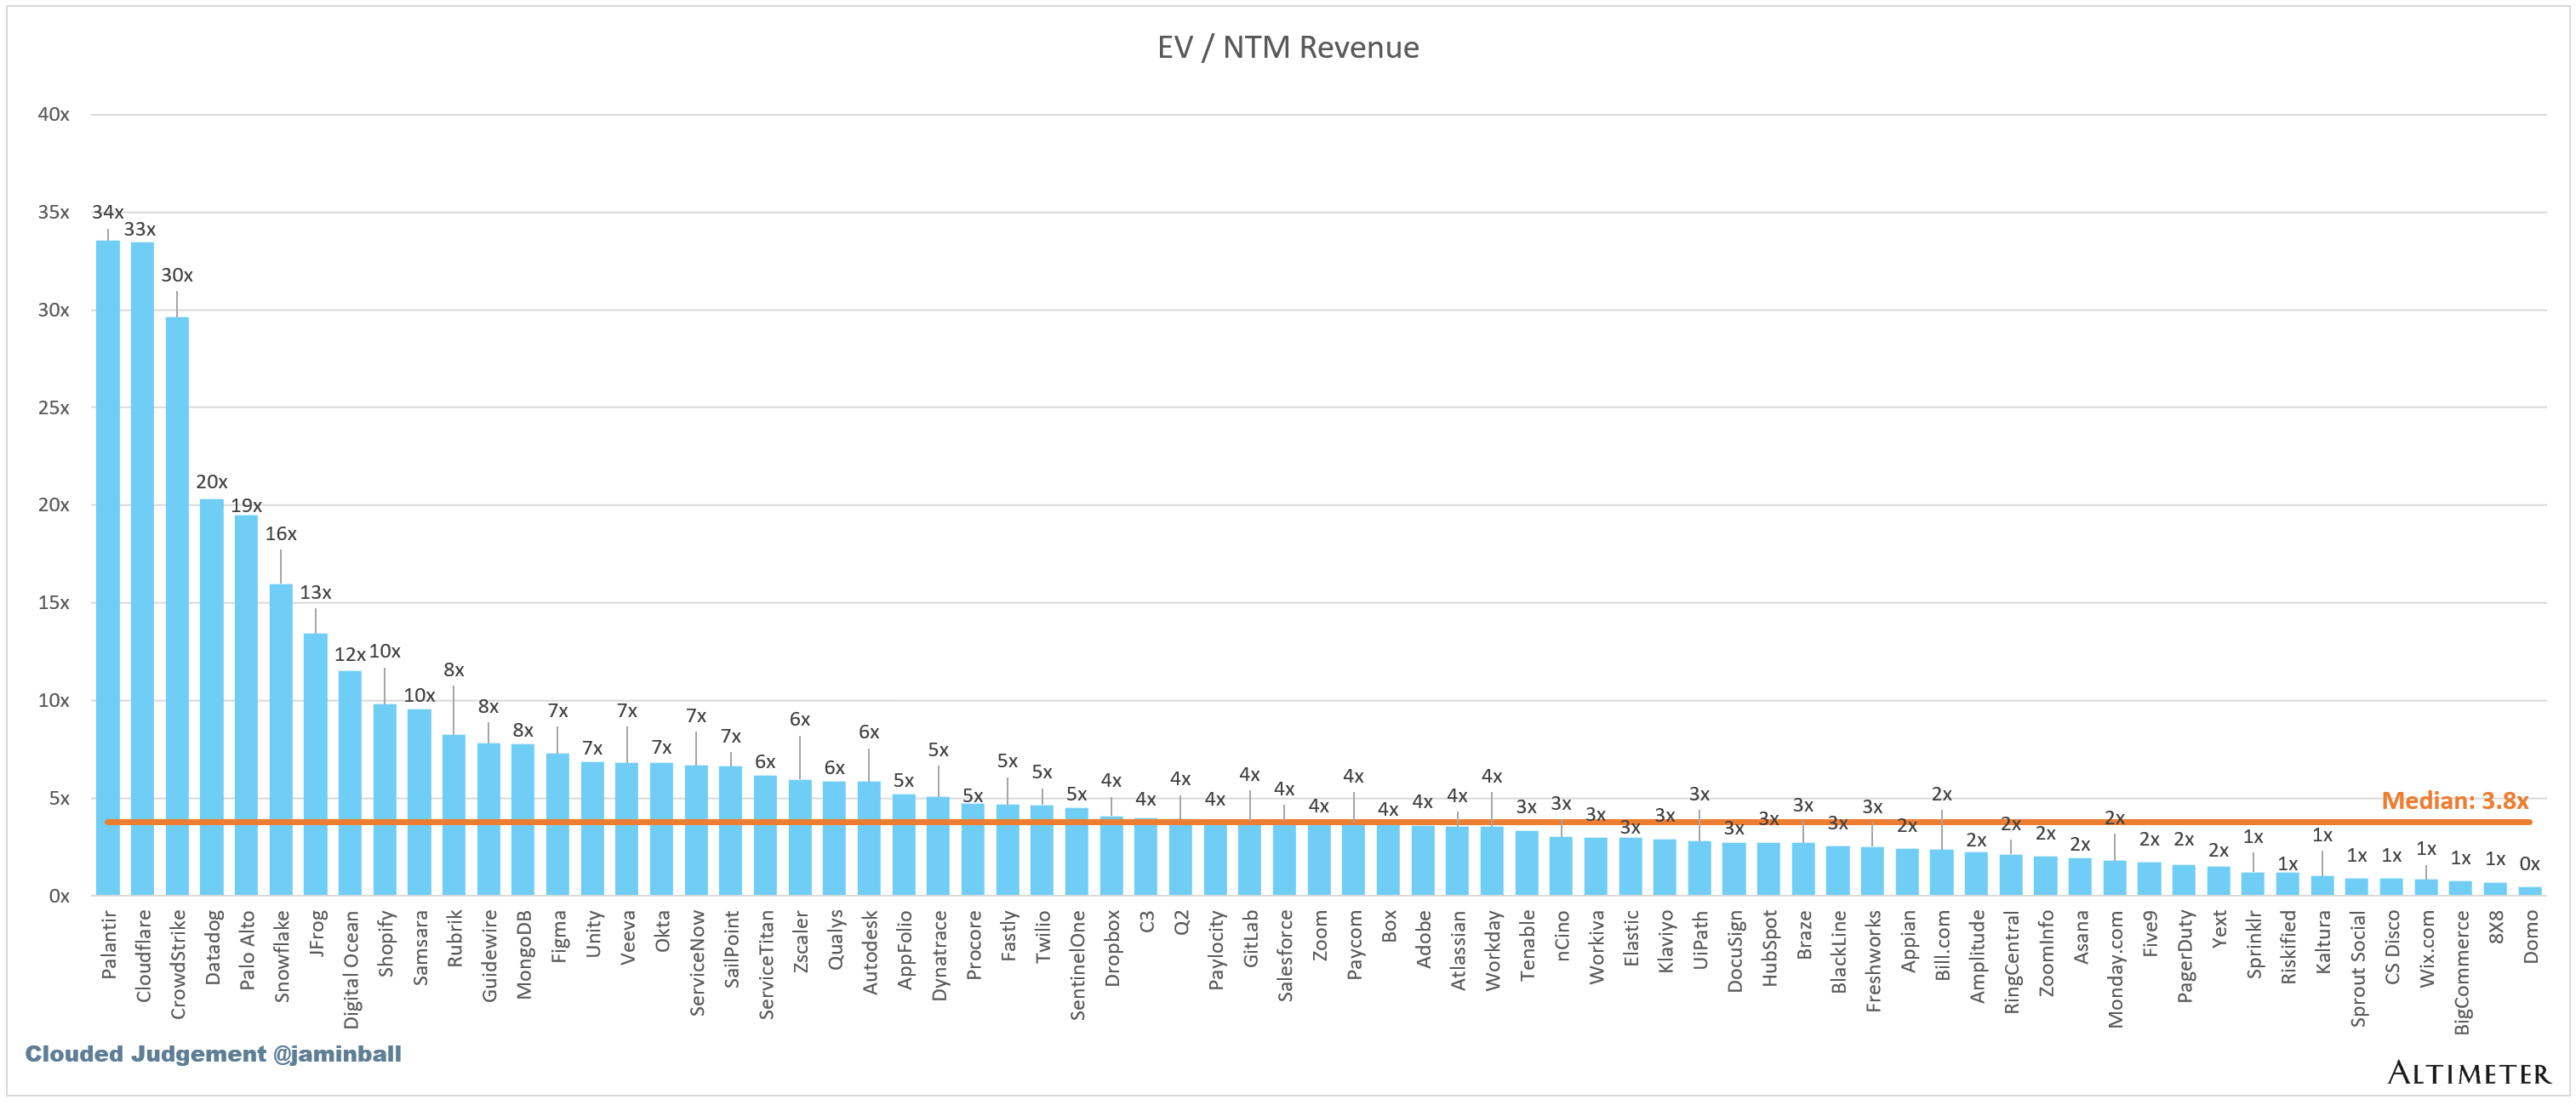
SaaS businesses are generally valued on a multiple of their revenue - in most cases the projected revenue for the next 12 months. Revenue multiples are a shorthand valuation framework. Given most software companies are not profitable, or not generating meaningful FCF, it’s the only metric to compare the entire industry against. Even a DCF is riddled with long term assumptions. The promise of SaaS is that growth in the early years leads to profits in the mature years. Multiples shown below are calculated by taking the Enterprise Value (market cap + debt - cash) / NTM revenue.
Overall Stats:
Overall Median: 3.8x
Top 5 Median: 29.6x
10Y: 4.7%
Bucketed by Growth. In the buckets below I consider high growth >22% projected NTM growth, mid growth 15%-22% and low growth <15%. I had to adjusted the cut off for “high growth.” If 22% feels a bit arbitrary, it’s because it is…I just picked a cutoff where there were ~10 companies that fit into the high growth bucket so the sample size was more statistically significant
High Growth Median: 19.5x
Mid Growth Median: 5.2x
Low Growth Median: 3.0x
EV / NTM Rev / NTM Growth
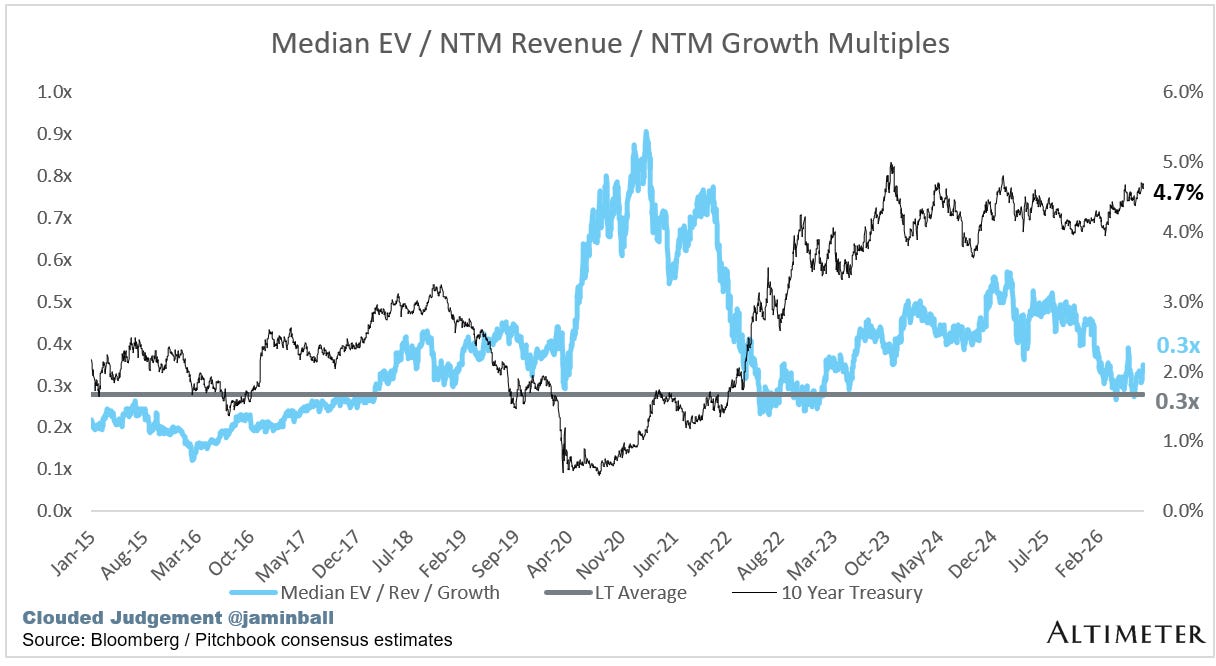
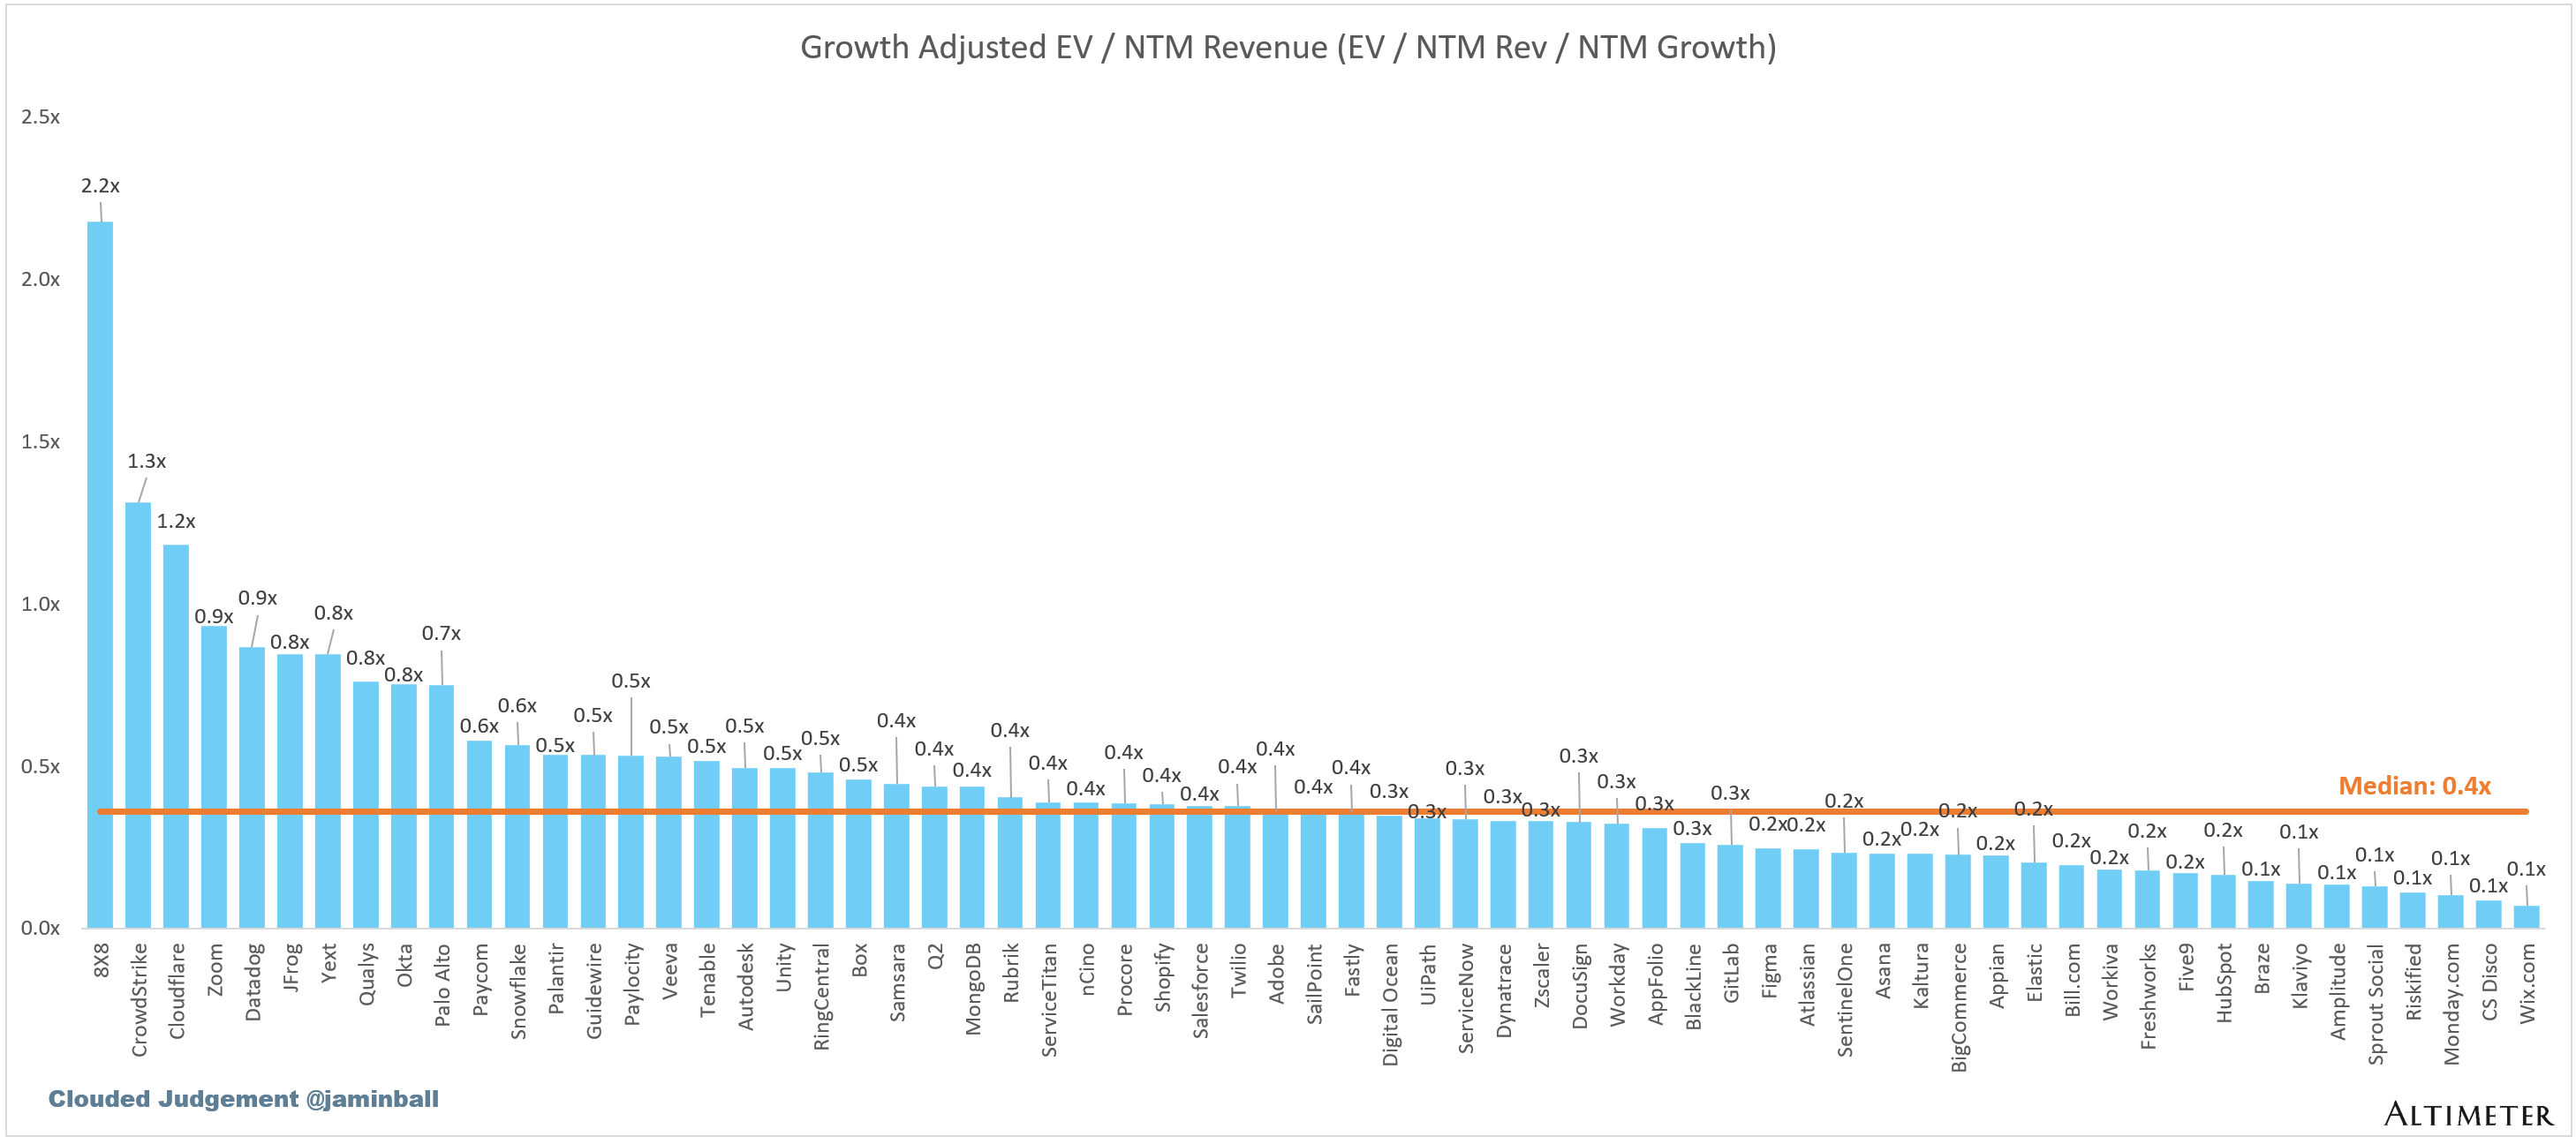
The below chart shows the EV / NTM revenue multiple divided by NTM consensus growth expectations. So a company trading at 20x NTM revenue that is projected to grow 100% would be trading at 0.2x. The goal of this graph is to show how relatively cheap / expensive each stock is relative to its growth expectations.
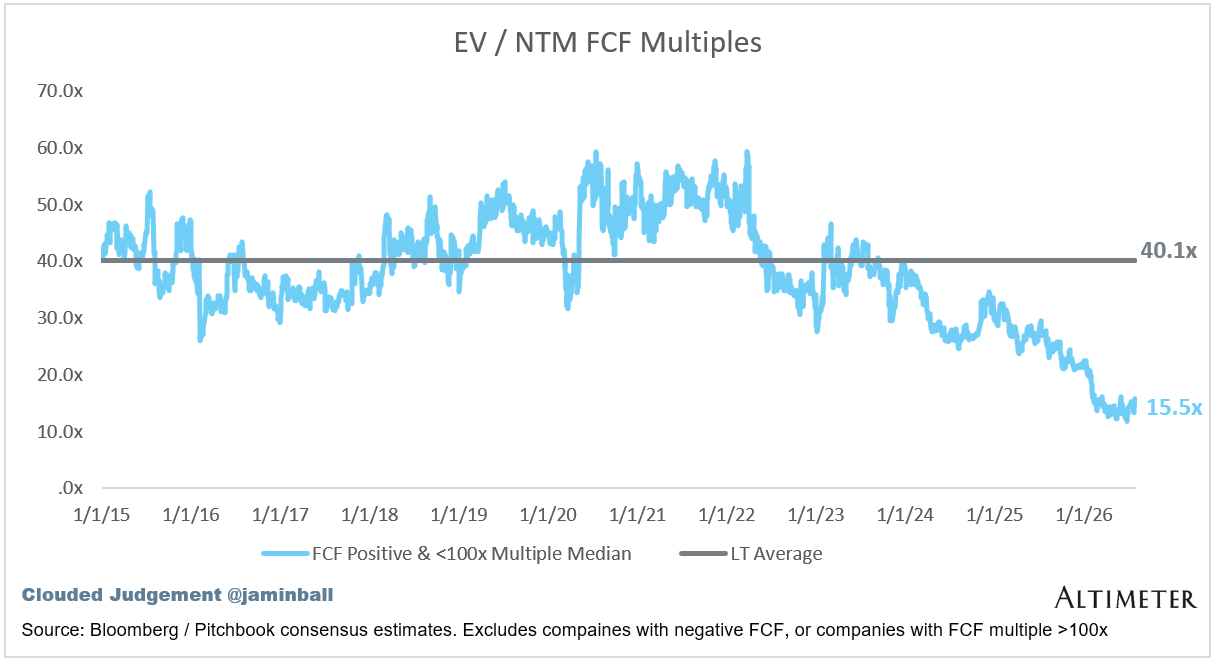
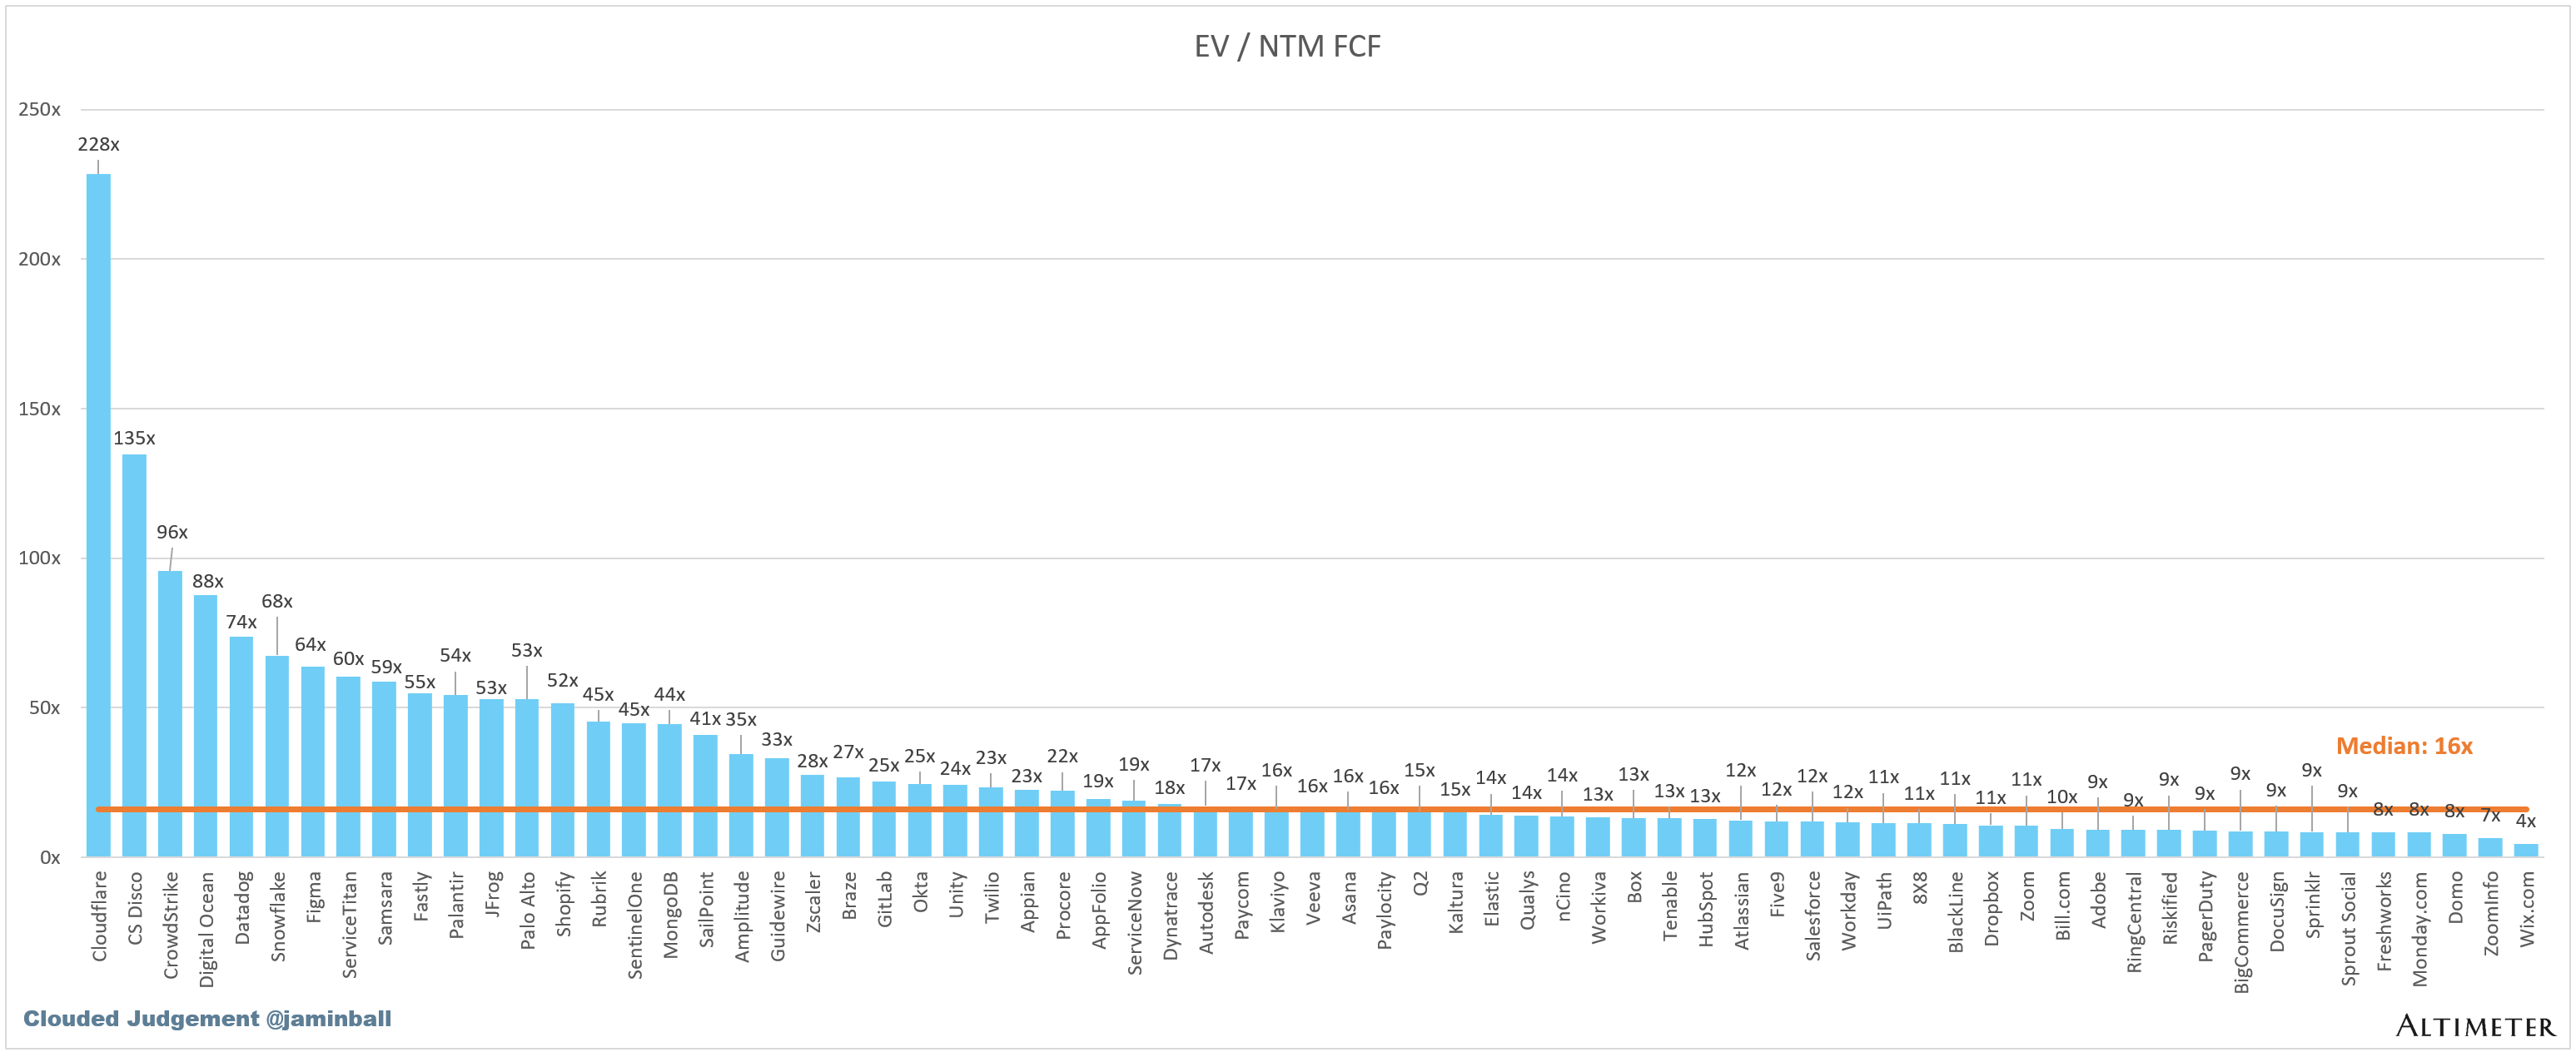
EV / NTM FCF
The line chart shows the median of all companies with a FCF multiple >0x and <100x. I created this subset to show companies where FCF is a relevant valuation metric.
Companies with negative NTM FCF are not listed on the chart
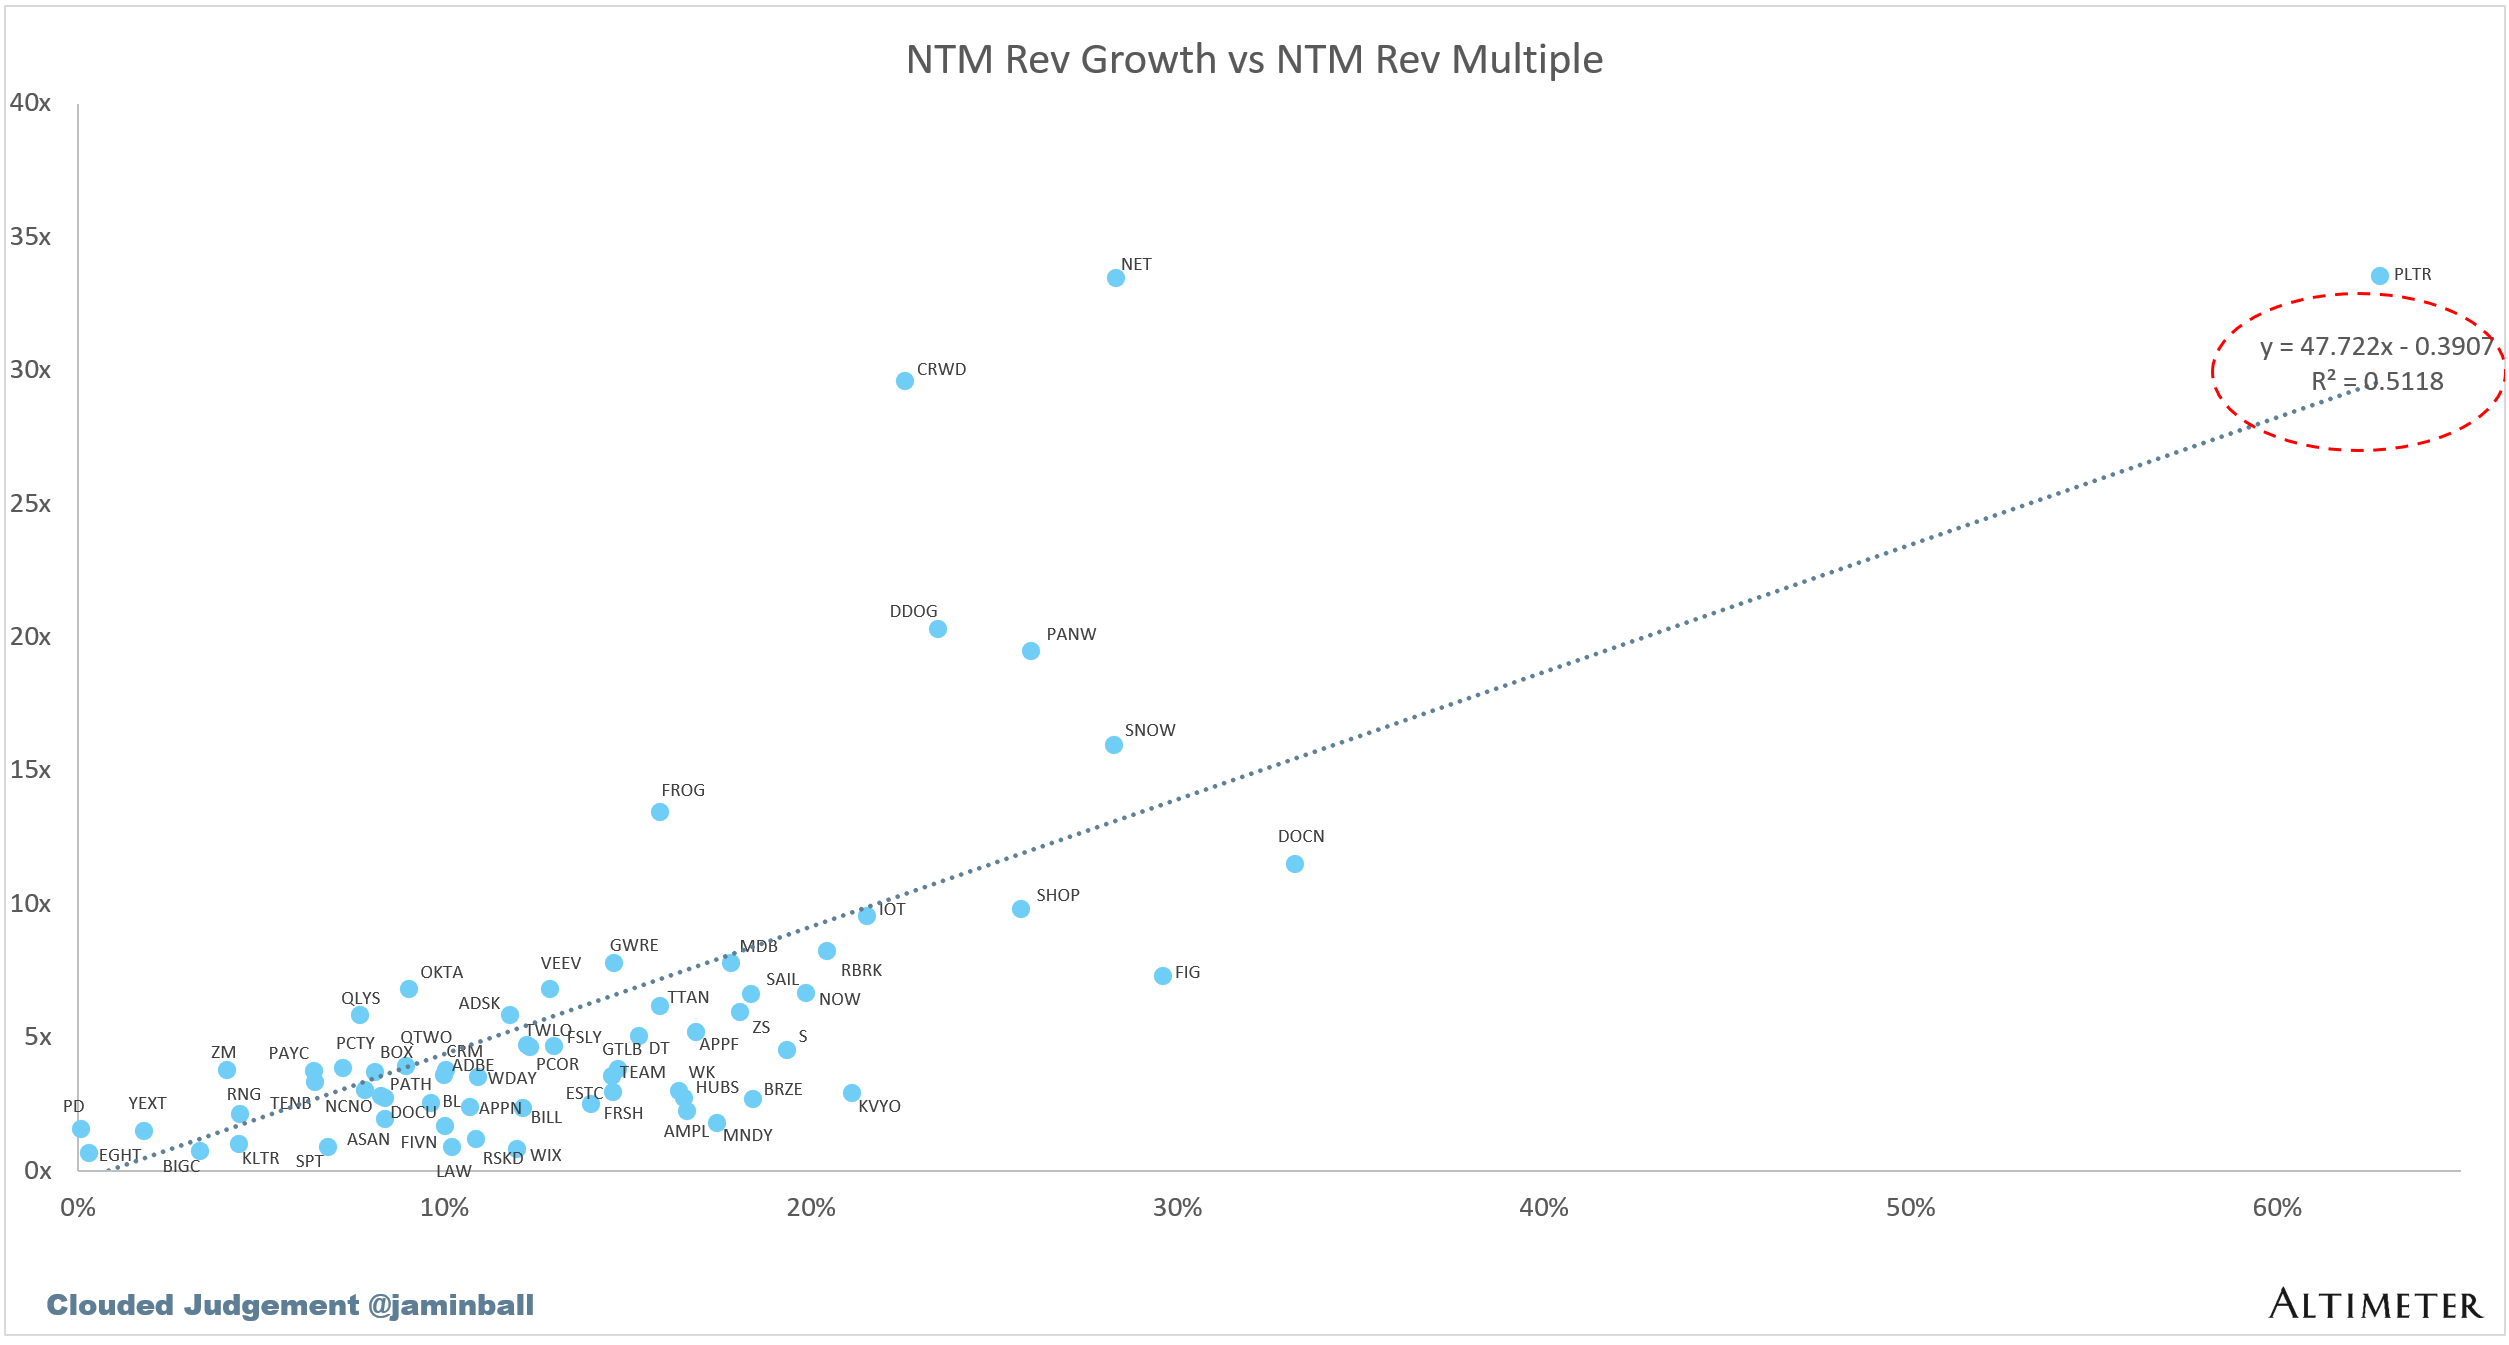
Scatter Plot of EV / NTM Rev Multiple vs NTM Rev Growth
How correlated is growth to valuation multiple?
Operating Metrics
Median NTM growth rate: 12%
Median LTM growth rate: 16%
Median Gross Margin: 75%
Median Operating Margin 2%
Median FCF Margin: 21%
Median Net Retention: 110%
Median CAC Payback: 43 months
Median S&M % Revenue: 34%
Median R&D % Revenue: 23%
Median G&A % Revenue: 13%
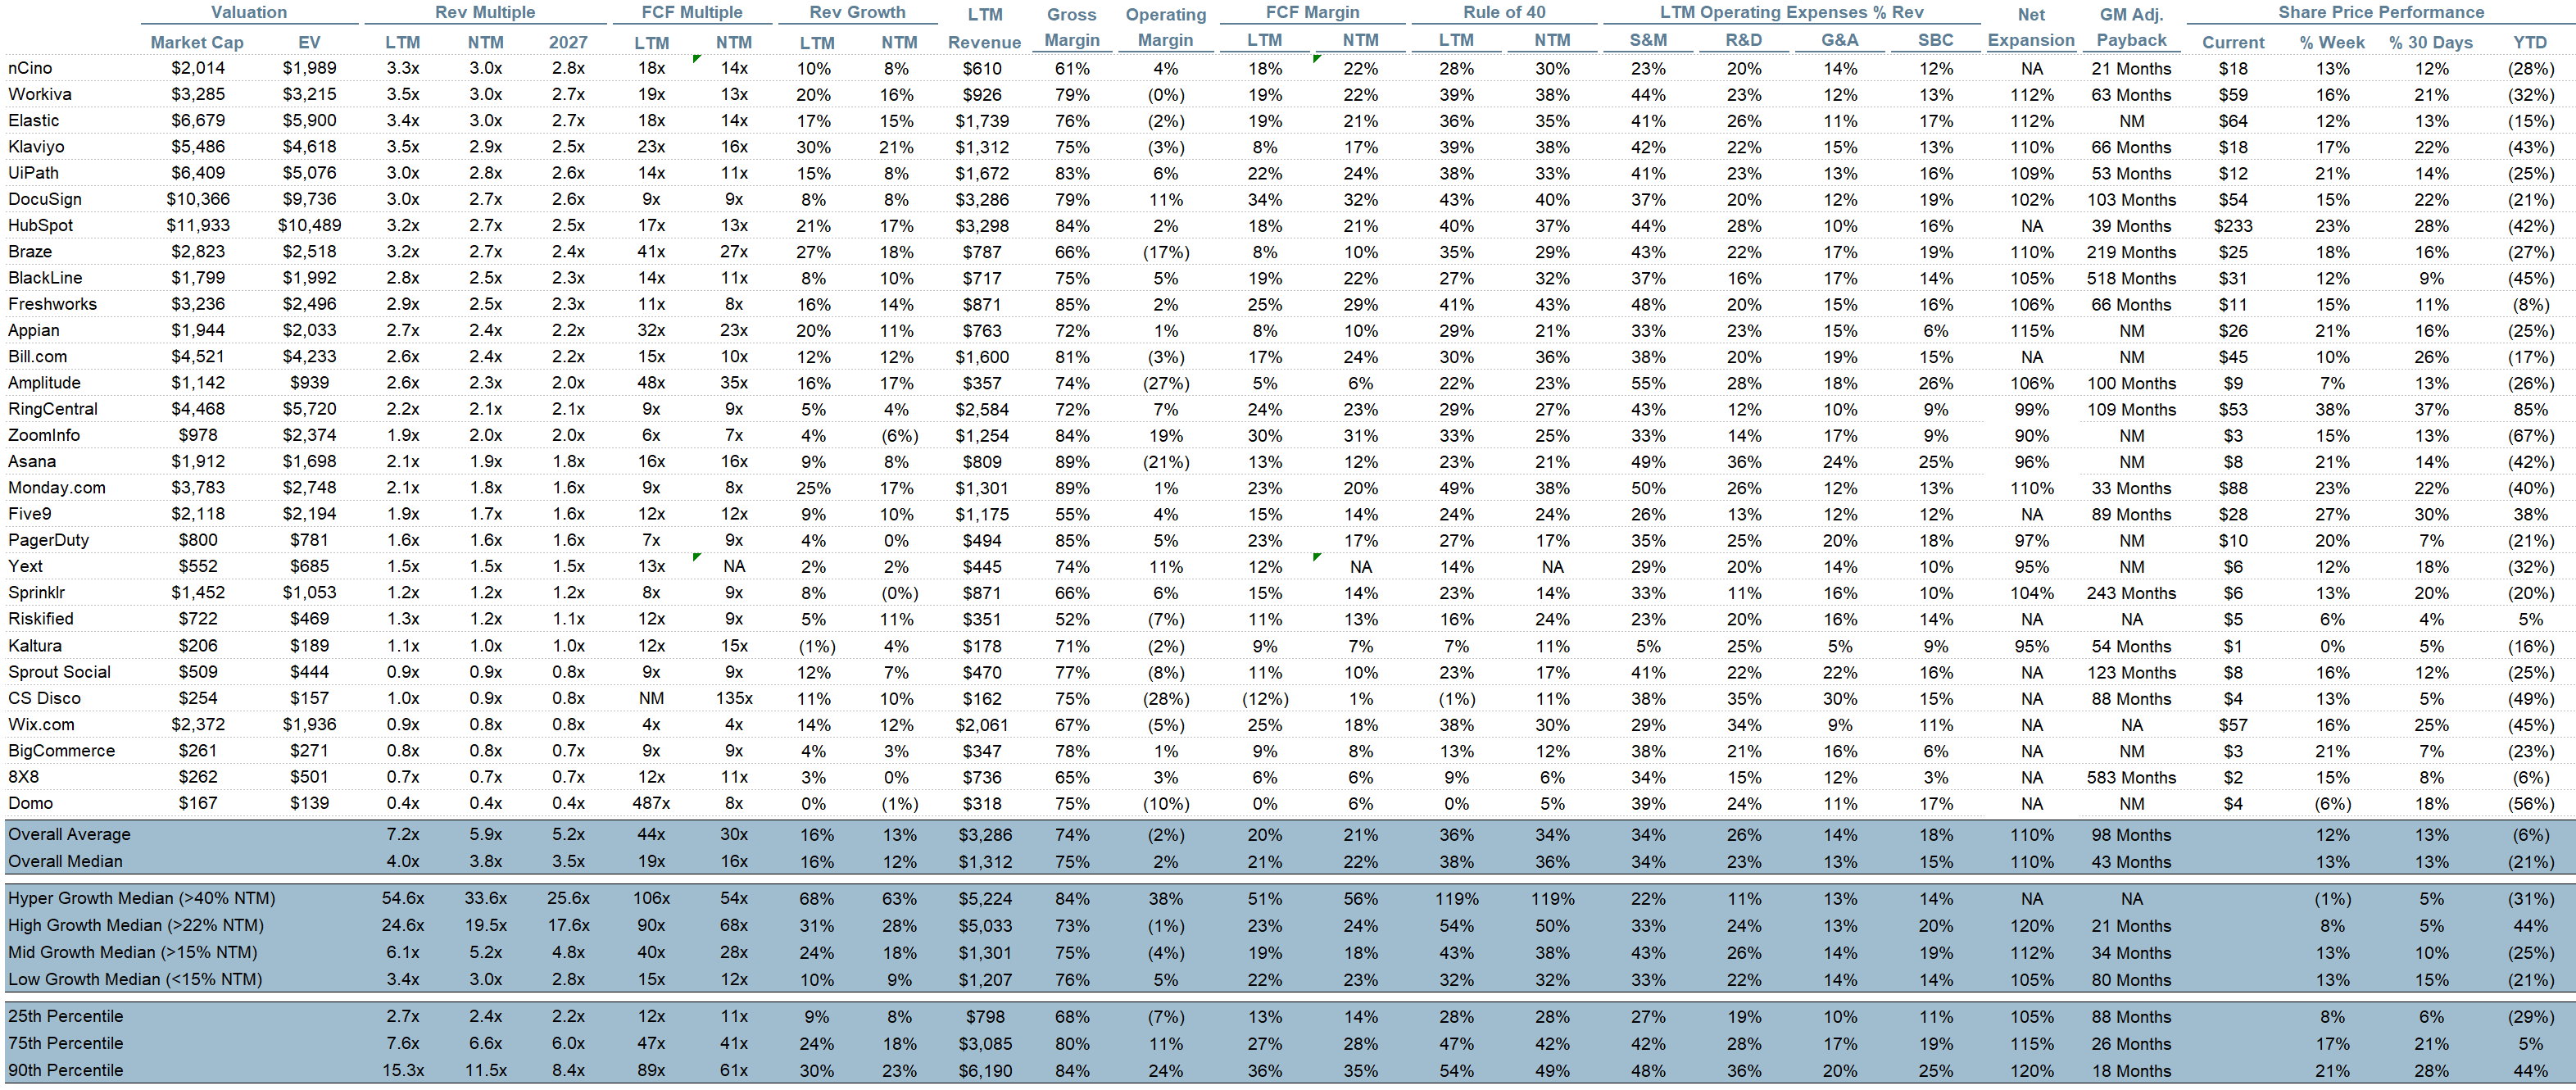
Comps Output
Rule of 40 shows rev growth + FCF margin (both LTM and NTM for growth + margins). FCF calculated as Cash Flow from Operations - Capital Expenditures
GM Adjusted Payback is calculated as: (Previous Q S&M) / (Net New ARR in Q x Gross Margin) x 12. It shows the number of months it takes for a SaaS business to pay back its fully burdened CAC on a gross profit basis. Most public companies don’t report net new ARR, so I’m taking an implied ARR metric (quarterly subscription revenue x 4). Net new ARR is simply the ARR of the current quarter, minus the ARR of the previous quarter. Companies that do not disclose subscription rev have been left out of the analysis and are listed as NA.
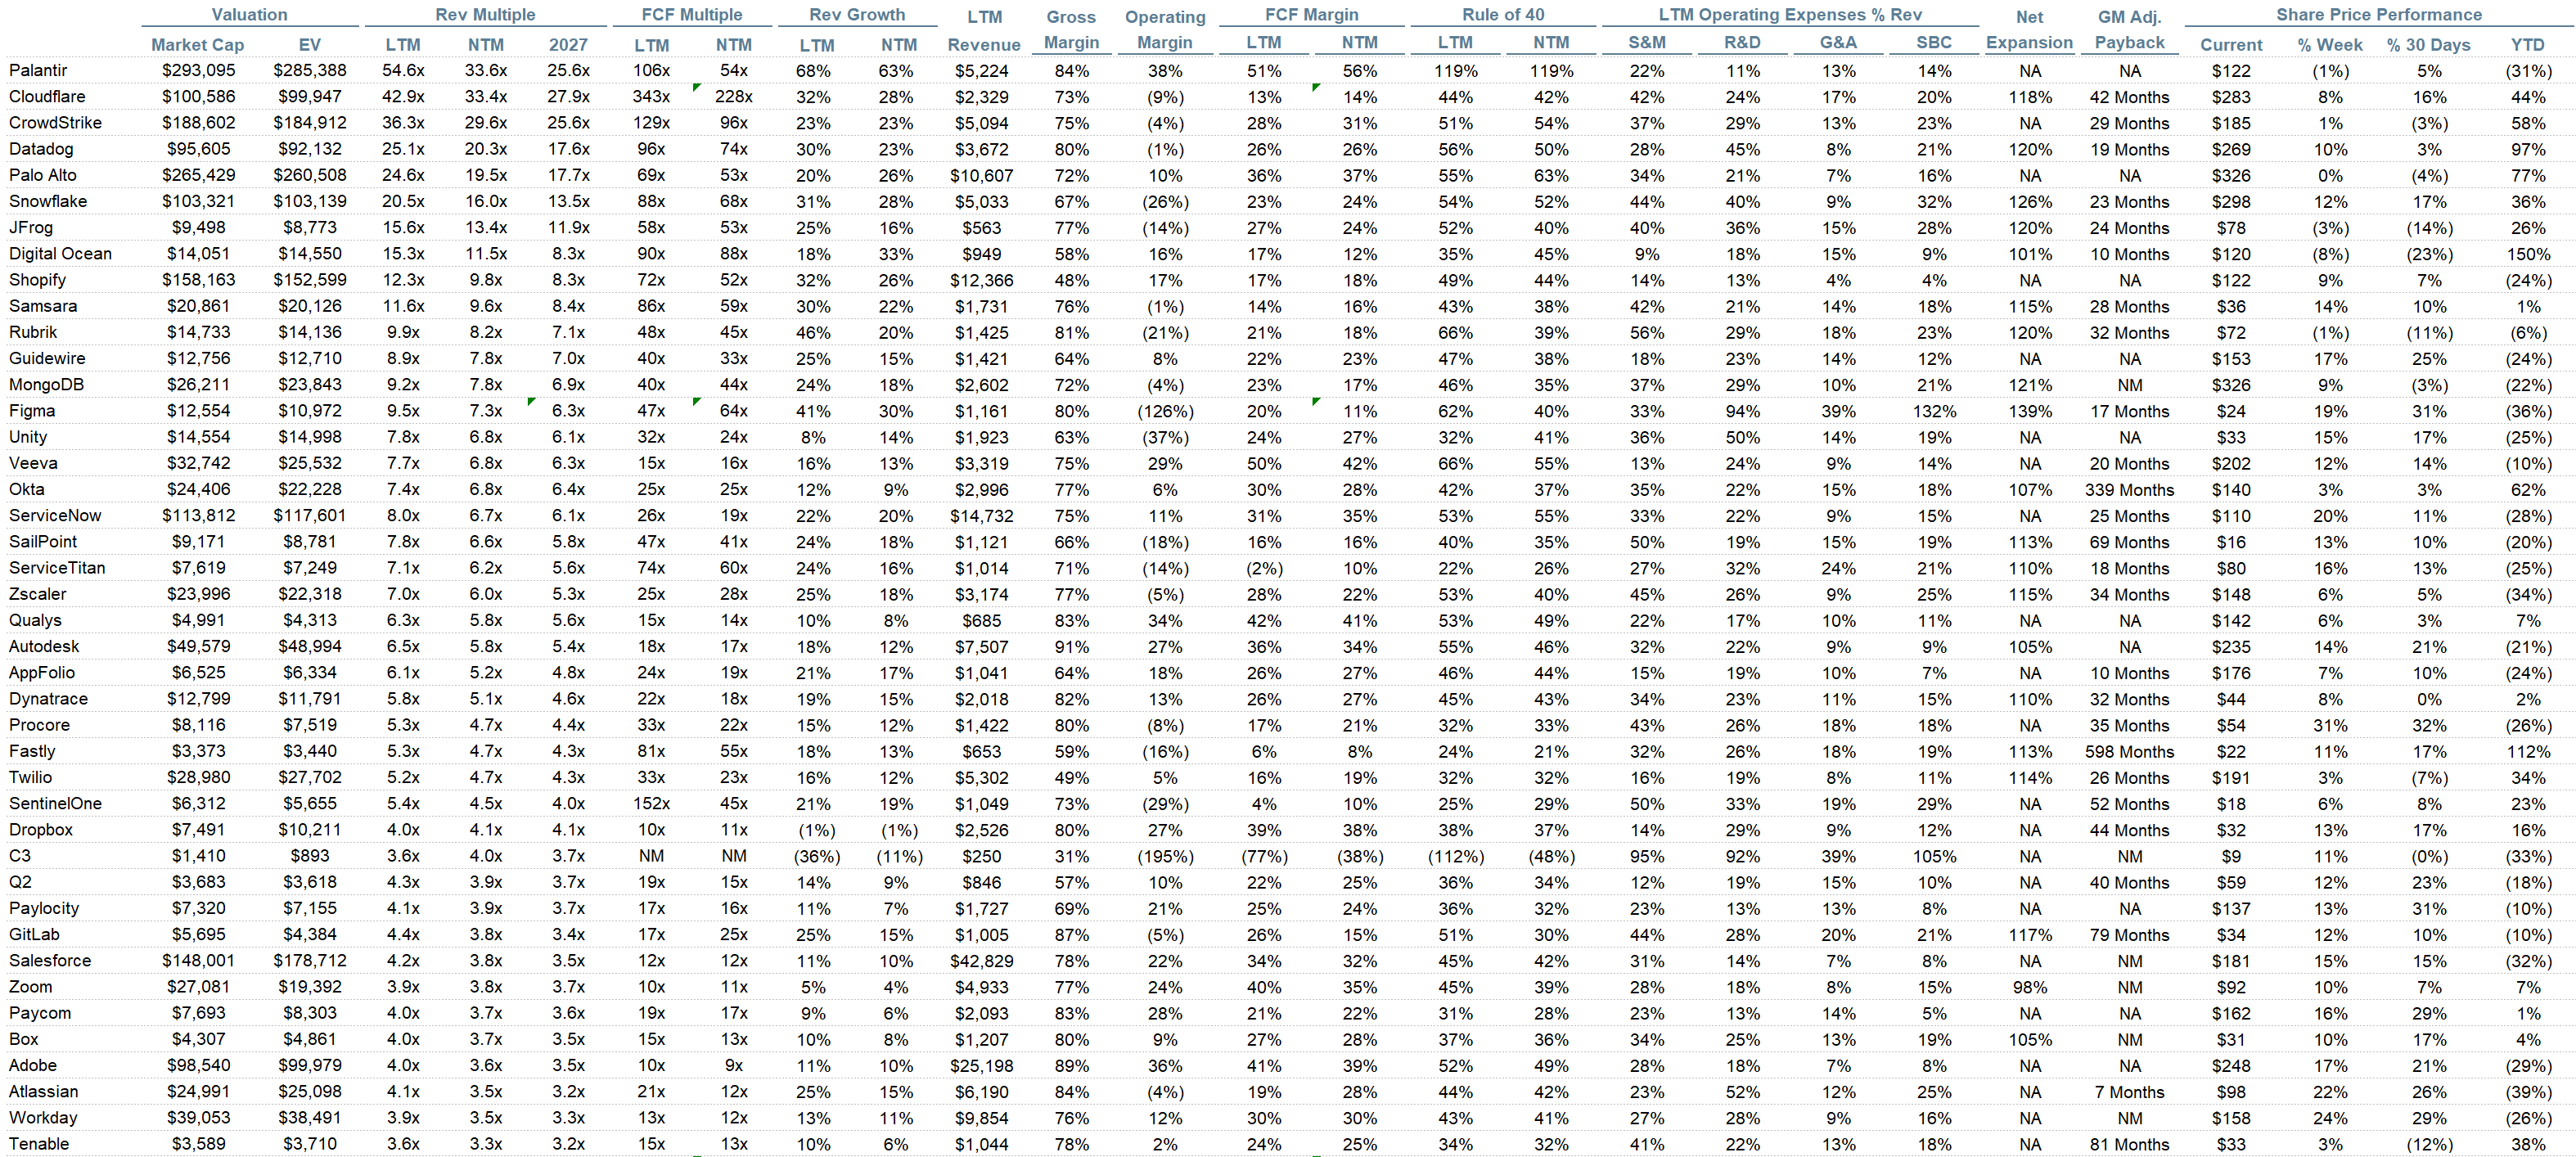
Sources used in this post include Bloomberg, Pitchbook and company filings
The information presented in this newsletter is the opinion of the author and does not necessarily reflect the view of any other person or entity, including Altimeter Capital Management, LP (”Altimeter”). The information provided is believed to be from reliable sources but no liability is accepted for any inaccuracies. This is for information purposes and should not be construed as an investment recommendation. Past performance is no guarantee of future performance. Altimeter is an investment adviser registered with the U.S. Securities and Exchange Commission. Registration does not imply a certain level of skill or training. Altimeter and its clients trade in public securities and have made and/or may make investments in or investment decisions relating to the companies referenced herein. The views expressed herein are those of the author and not of Altimeter or its clients, which reserve the right to make investment decisions or engage in trading activity that would be (or could be construed as) consistent and/or inconsistent with the views expressed herein.
This post and the information presented are intended for informational purposes only. The views expressed herein are the author’s alone and do not constitute an offer to sell, or a recommendation to purchase, or a solicitation of an offer to buy, any security, nor a recommendation for any investment product or service. While certain information contained herein has been obtained from sources believed to be reliable, neither the author nor any of his employers or their affiliates have independently verified this information, and its accuracy and completeness cannot be guaranteed. Accordingly, no representation or warranty, express or implied, is made as to, and no reliance should be placed on, the fairness, accuracy, timeliness or completeness of this information. The author and all employers and their affiliated persons assume no liability for this information and no obligation to update the information or analysis contained herein in the future.
No posts
Comments
Nothing yet. Say the first thing.
Sign in to join the conversation.