
Friends,
There’s a lot to discuss this week, including the one state that’s bucking the national trend of low housing construction numbers, last month’s concerning drop in retail sales, and why the stratospheric rise in executive pay hurts your paycheck.
But first, the U.S. Bureau of Labor Statistics delivered bad news for American workers this week: “From July 2025 to July 2026, real average hourly earnings for all employees decreased 0.2 percent,” the Bureau reported on Tuesday.
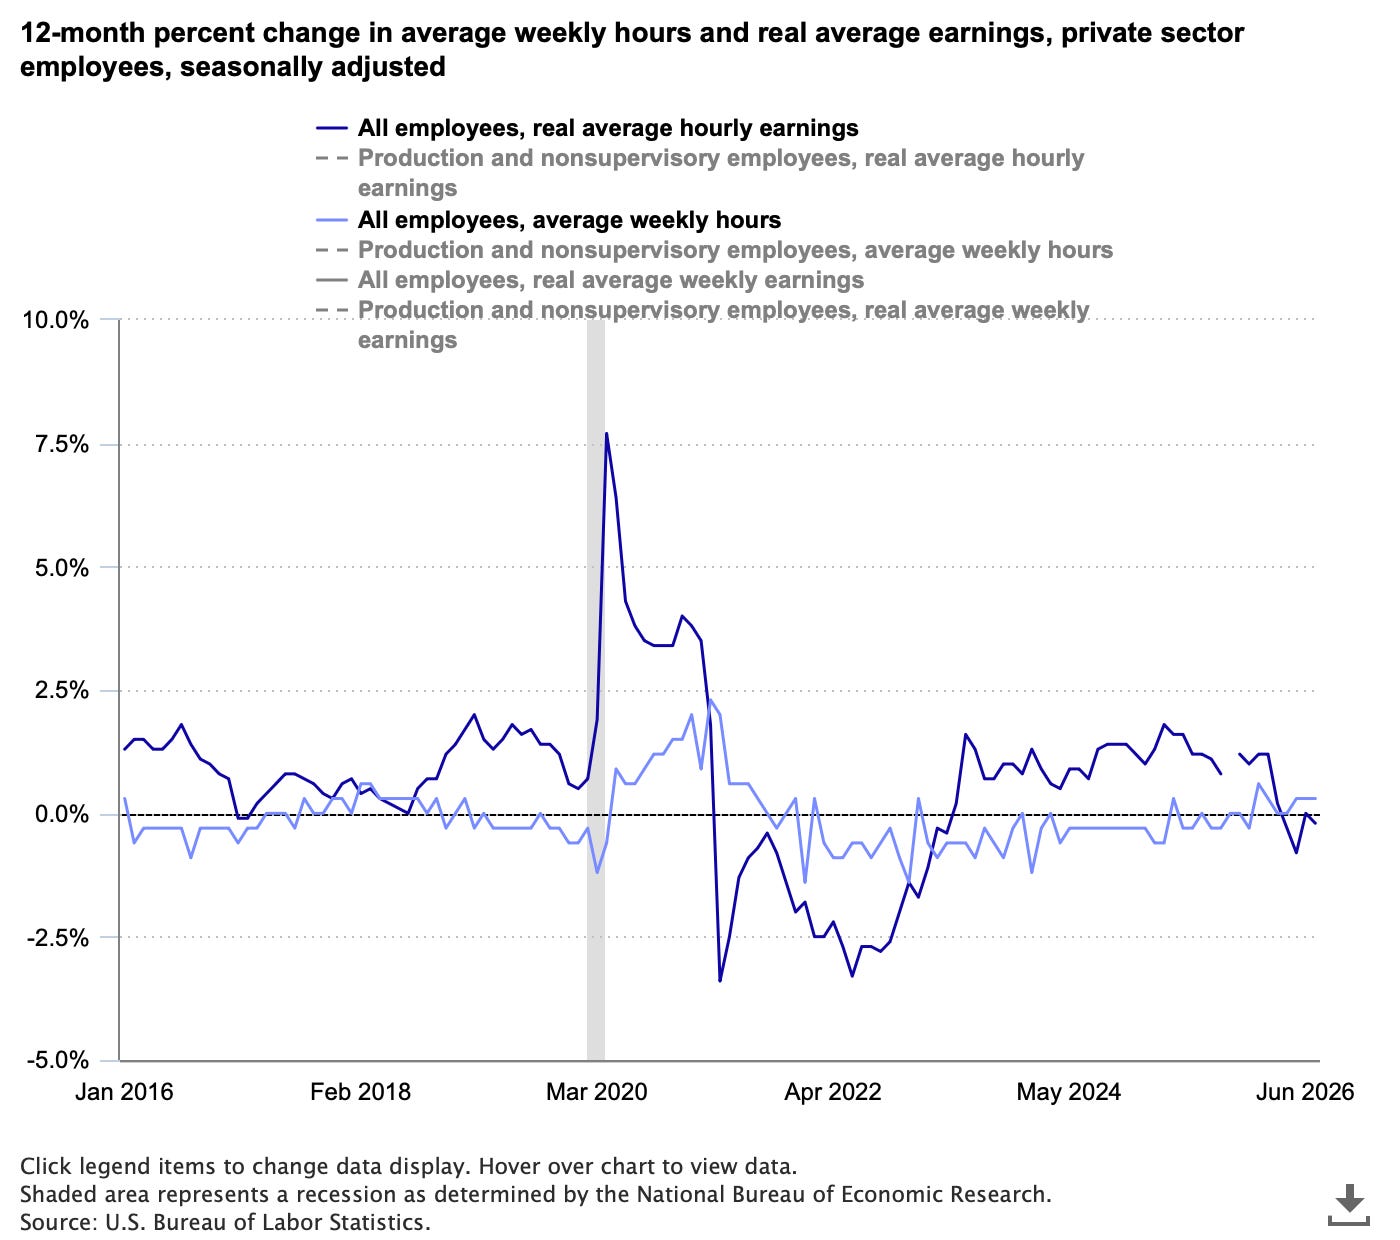
This is bad news not just for workers, but for the whole economy. If paychecks shrink, there’s just simply not enough money to circulate through the economy to create jobs through consumer demand. Unless we get those paychecks growing again, this dip in wages could set the stage for a negative feedback loop of lower wages and weaker job creation. Our leaders should be working as hard as they can to invest in workers and turn this trend around.
The BLS also reported that the average workweek increased by 0.3 percent over the last year, meaning workers are putting in more time in exchange for less money. Since they’re working longer every week, BLS reports that workers technically saw “a 0.1-percent increase in real average weekly earnings over this period”—not due to a raise, but because they’re working more time for less money.
Those workers are also more productive than they were a year ago. BLS reported that for the second quarter of this year, “nonfarm business sector labor productivity increased 2.2 percent from the same quarter a year ago.”
So to recap: The average American worker is earning less per hour than they did this time last year, but they’re also working more hours and are significantly more productive than they were at this time last year. You might be thinking that these numbers don’t make any sense—and you’d be correct to assume that.
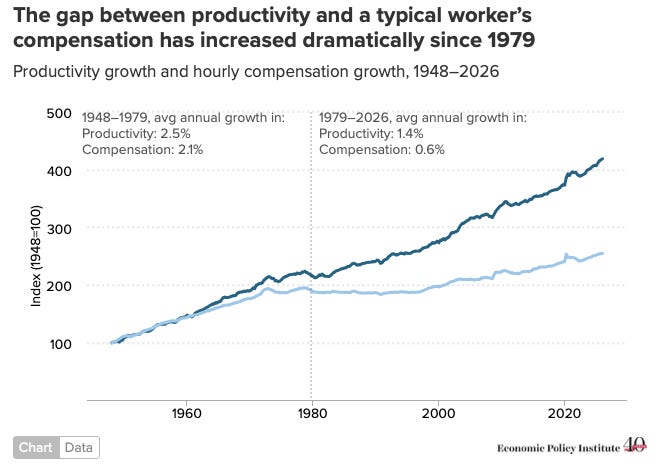
It gets even worse when we back up and look at the bigger picture. One of the most important economic charts of our time, compiled here by our friends at the Economic Policy Institute, shows that worker productivity rose more or less in lockstep with wages during the 20th century after World War II. It’s not a coincidence that the timespan from 1950 to 1980 represented the most remarkable period of growth and prosperity in the history of the world. The workers were supercharging the growth of the American economy.
It wasn’t until the Reagan administration and its forceful adoption of trickle-down economics that productivity and pay became divorced from each other. Through a coordinated campaign of tax cuts for the rich, deregulation for powerful corporations, and suppressed wages for everyone else, trickle-downers managed to shrink the paychecks of workers, even as they continued to produce more and more high-quality work. Now, worker productivity has grown nearly three times as fast as wages.
EPI concludes, “If pay had kept pace with productivity, the typical worker would be making $16.40 more per hour today, $13.53 of which is in greater wages.”
Just leaving out the additional benefits that have been lost and going with the lower wage gains EPI provided, that’s an average of $541 more in wages per weekly paycheck that the average American worker would still be earning, had wages tracked with productivity growth. It’s an annual difference of $28,142.
Virtually all of our major economic problems today can be traced back to this so-called “Great Decoupling,” which stole many tens of trillions of dollars from the paychecks of American workers and redistributed them upward into the hands of the wealthiest few. So just remember, every time we talk about a single bad report in this newsletter with wages declining by a fraction of a percent, like this week’s BLS report, those negative numbers are signaling a much larger problem in the American economy.
It’s important for us to keep all this in mind because we need to remember that in election years, we aren’t asking candidates to return that lost 0.2 percent of wages to our paychecks. American workers need to take home tens of thousands of dollars per year more in order to be truly made whole, and the economy itself isn’t going to improve until we make significant moves in that direction.
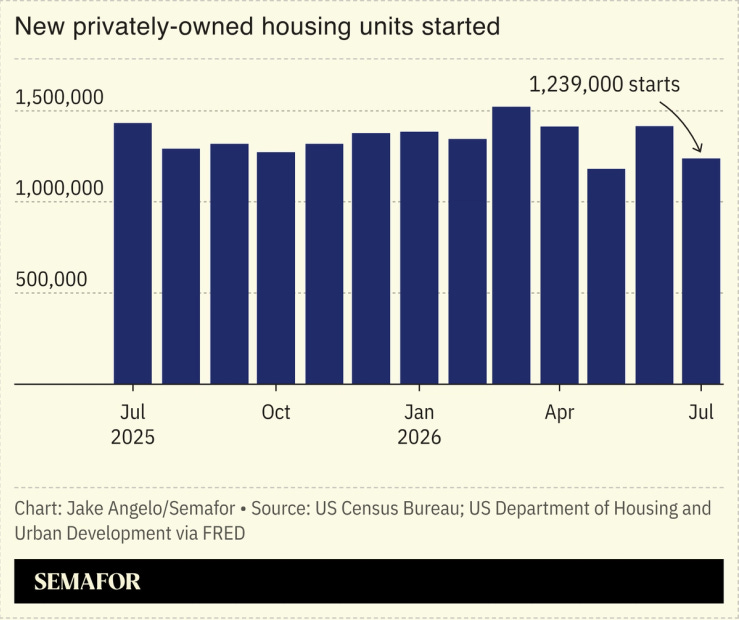
“US single-family homebuilding nosedived in July, falling 16% year-over-year as higher mortgage rates kept the market frozen,” reports Jake Angelo at Semafor.
“While those would-be buyers stay put, many are now relying on buy now, pay later services to help them stay afloat: Affirm, the pay-later app, is providing cash-strapped tenants loans to help out with rent payments,” Angelo continues.
“Single-family housing starts, which account for the bulk of homebuilding, dropped 9.9% last month to a seasonally adjusted annual rate of 808,000 units,” Reuters reports, noting that the number is the lowest since November 2022.
Reuters continues, “Total new home starts - including multifamily structures such as apartments - fell 12.4% to 1.239 million in July.”
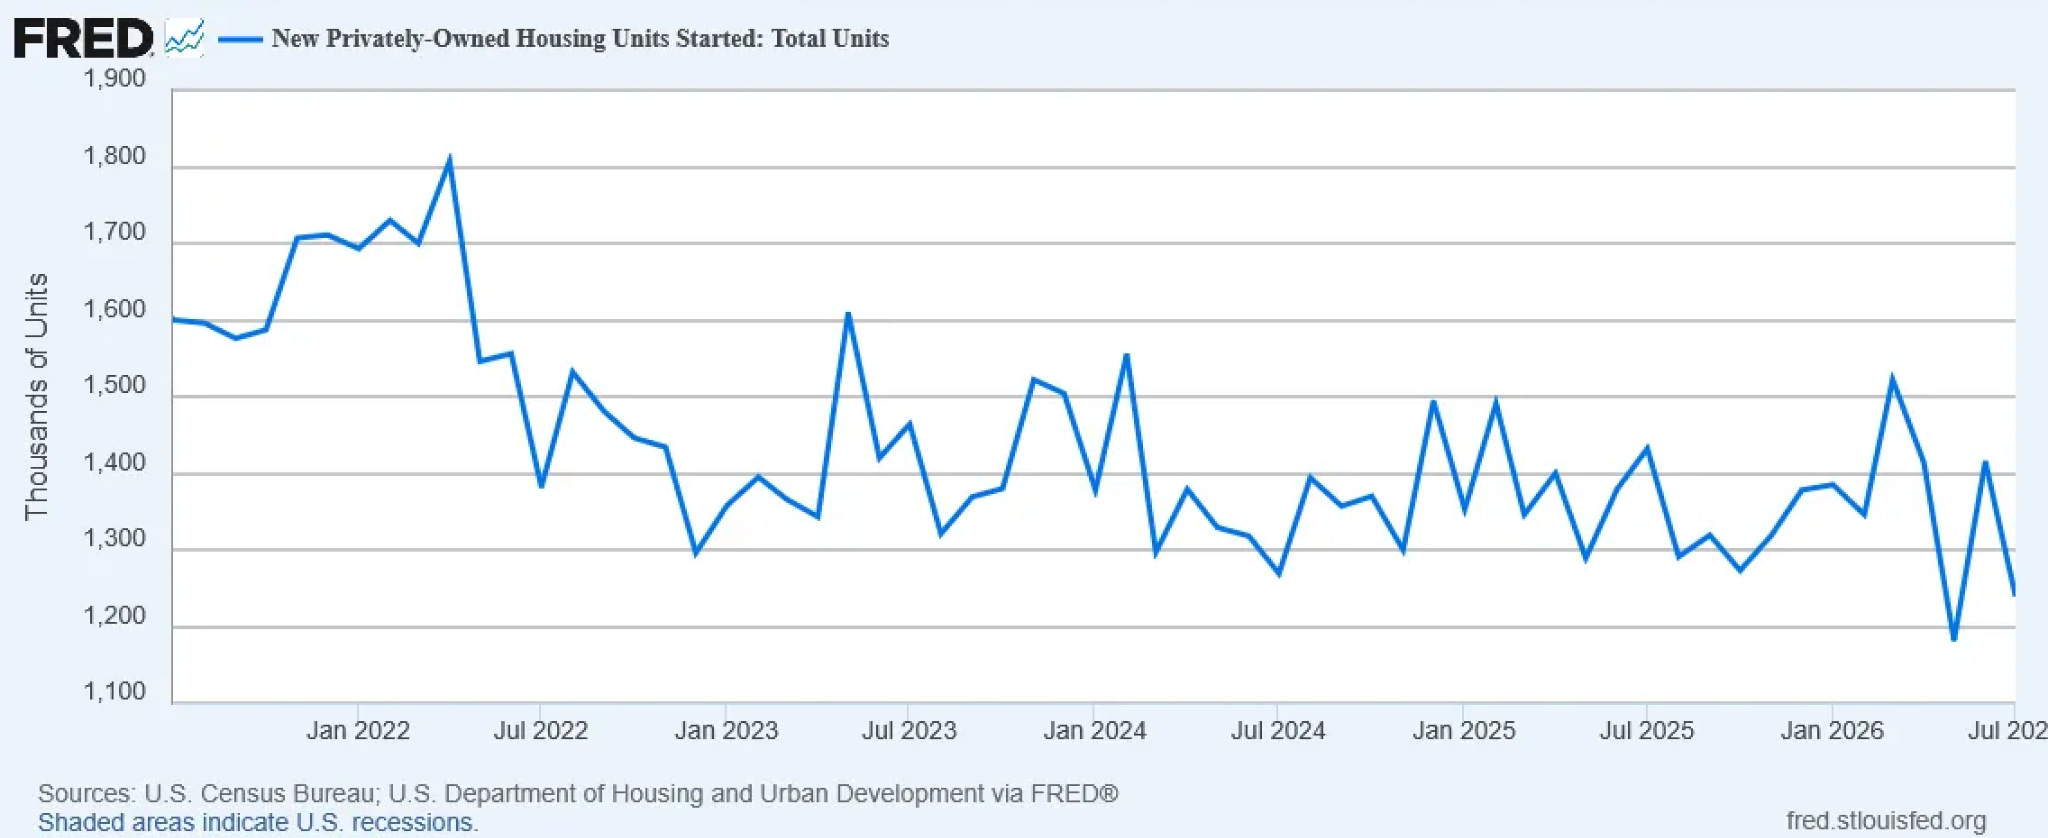
The Federal Reserve has kept interest rates high in an effort to slow the economy down and to curb inflation, but those high rates have pushed mortgage rates to a punishingly high level—on Tuesday they hit 6.71%, effectively raising the asking price of homes by tens of thousands of dollars over the life of the loans. In conjunction with sellers keeping home prices high, those high mortgages have priced many working families out of the housing market. And it’s not unreasonable to believe that the administration’s campaign of forced deportations is also meaningfully shrinking the housing workforce, which is making home construction a more uncertain and more logistically difficult prospect.
Remember, experts estimated in 2025 that the United States was already failing to meet housing demand by roughly four million homes. They also predicted that it would take seven years for the housing industry to build enough homes to close that gap. But in the year since, construction has slowed remarkably, and the housing market has chilled, even as housing prices stay unsustainably high.
I’m happy to report, though, that we did receive some excellent news on the housing front this week—even as new housing construction fell behind nationally, Campbell Porter writes for KTVZ, “Oregon housing starts increased by 11.3% year-over-year during the first half of 2026, marking a second consecutive year of statewide construction growth.”
It’s not often you see one state completely buck national economic trends to fly in the opposite direction of the other 49. That kind of aberration typically suggests one of two conditions: Either the state is in the middle of a geographically unique economic surge—see the massive North Dakota gas boom of 2006-2012—or the state is pioneering a new policy to encourage that kind of growth.
It seems as though Oregon falls in the latter category. Oregon Governor Tina Kotek greeted the news of her state’s housing boom with an announcement that the “upward trend demonstrates what’s possible when the state partners successfully with local government and the private sector with a shared vision and shared urgency, with or without a reliable federal government.”
Campbell explains that Oregon’s policies include “re-launching a permanent lending program for housing construction offering interest rates lower than private sector options,” along with the creation of “grants intended to spur more than 8,000 housing units within urban growth boundaries across several Oregon cities, alongside investments in shelter and transitional housing for unhoused residents.”
Oregon offers a bright spot in a pretty dismal month for housing news. Leaders throughout the country should be watching the policies that Kotek and the Oregon legislature passed and considering adopting a major pro-housing slate in order to ensure that housing costs don’t continue to climb.
“US retail sales fell in July by the most in more than a year as consumers pulled back on purchases at online stores and auto dealers,” reported Julia Fanzeres at Bloomberg last week.
Fanzeres continues, “The value of retail purchases, which isn’t adjusted for inflation, decreased 0.6%, the most since May 2025.”
“Five of 13 categories in the report posted declines, led by a 2.2% drop in sales at nonstore retailers such as Amazon,” Fanzeres explains, citing Census retail report data. “Sales at motor vehicles and parts dealers fell 1.8%. Meanwhile receipts at restaurants and bars, the only service-sector category in the retail report, rose 0.5%.”
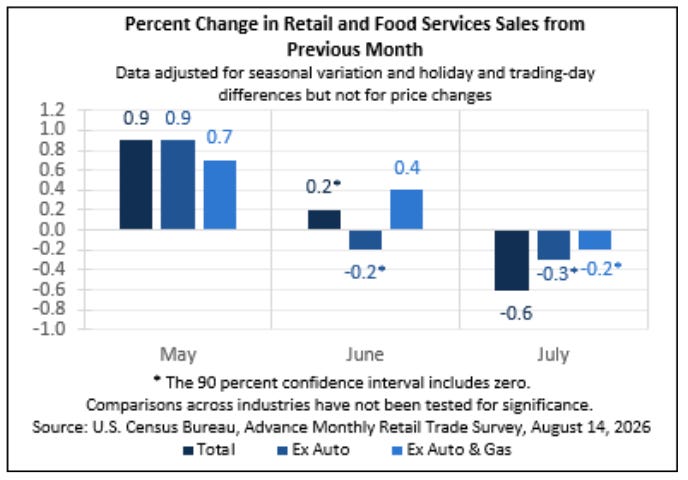
It’s possible that these numbers declined largely due to the skyrocketing cost of gas, which has been rising since President Trump launched the war on Iran earlier this year. But it’s also possible that consumers who have been stretched thin since inflation began to rise back in 2022 have finally reached a breaking point.
One data point for the stretched-consumer theory was published in the New York Times on Monday: “Americans spent $160 billion last year through pay-later loans, according to research released recently by Federal Reserve economists — nearly twice what consumers spent two years earlier, in 2023,” Stacy Cowley writes. “That’s still a fraction of the more than $3 trillion U.S. shoppers spend annually on consumer credit cards. But the industry continues to expand by double-digit rates each year.”
“A quarter of those surveyed by LendingTree who use the loans said they had at times had three or more loans outstanding at once,” Cowley writes. “And because pay-later loans often pull their payments directly from customers’ bank accounts or debit cards, one mistimed withdrawal can set off a cascade of overdraft fees and other missed payments.”
Those buy-now-pay-later apps are expanding into other categories besides shopping. Cowley explains that two services “allow customers to take out loans to pay for their broadband, electricity, health insurance, mobile phone service, mortgage and water bills,” while another “has started providing some tenants loans to extend their monthly rent payment for a few weeks.”
Last year, total American household debt stood “at $18.8 trillion and [had] increased by $4.6 trillion since the end of 2019, just before the pandemic recession,” the New York Fed reported earlier this year.
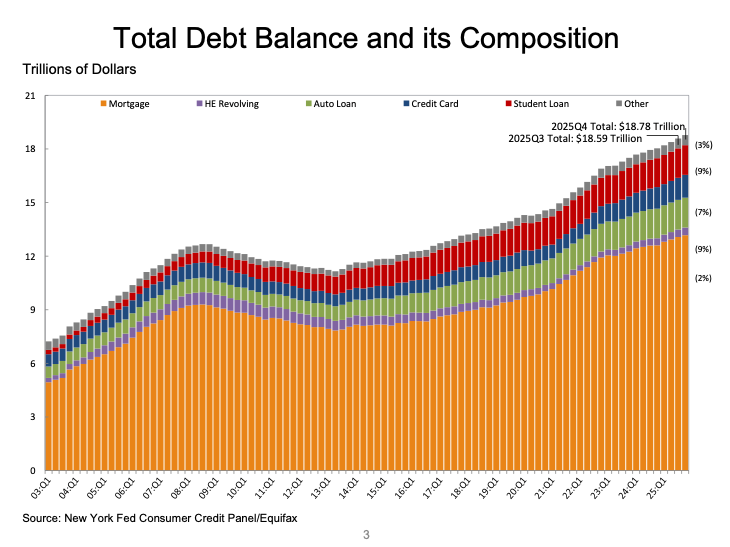
The most important figure to watch in the Fed’s annual report, delinquencies on loans, isn’t yet in the danger zone. Last year, the number of delinquencies just finally reached pre-pandemic levels and is nowhere near the massive spike in delinquencies we saw during the Great Recession:
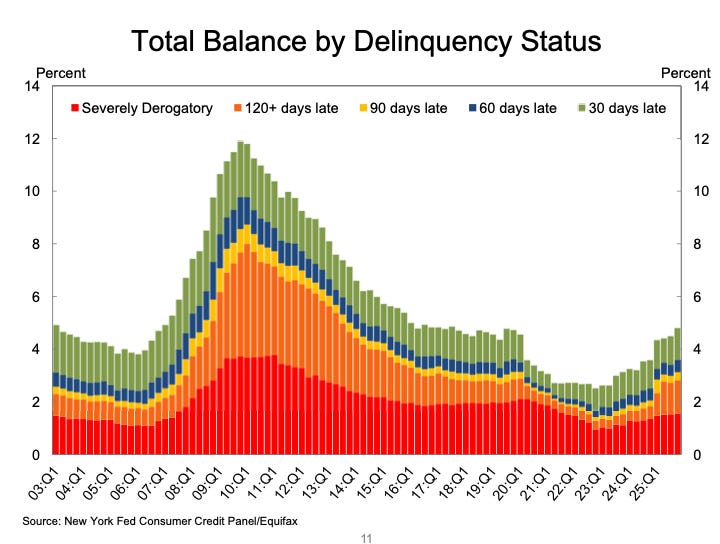
There is a warning sign in this year’s data, though: Samantha Fields at Marketplace reports that “More people are delinquent on their credit card payments now than at any other point since the Great Recession.” Next year’s Fed study could show a worsening credit report for the average American.
All these numbers suggest that the finances of a majority of American families are precarious. When expenses are rising, and your daily life can best be described as surviving from paycheck to paycheck, it doesn’t take too much disruption to knock millions of people out of the economy and into dangerous levels of debt.
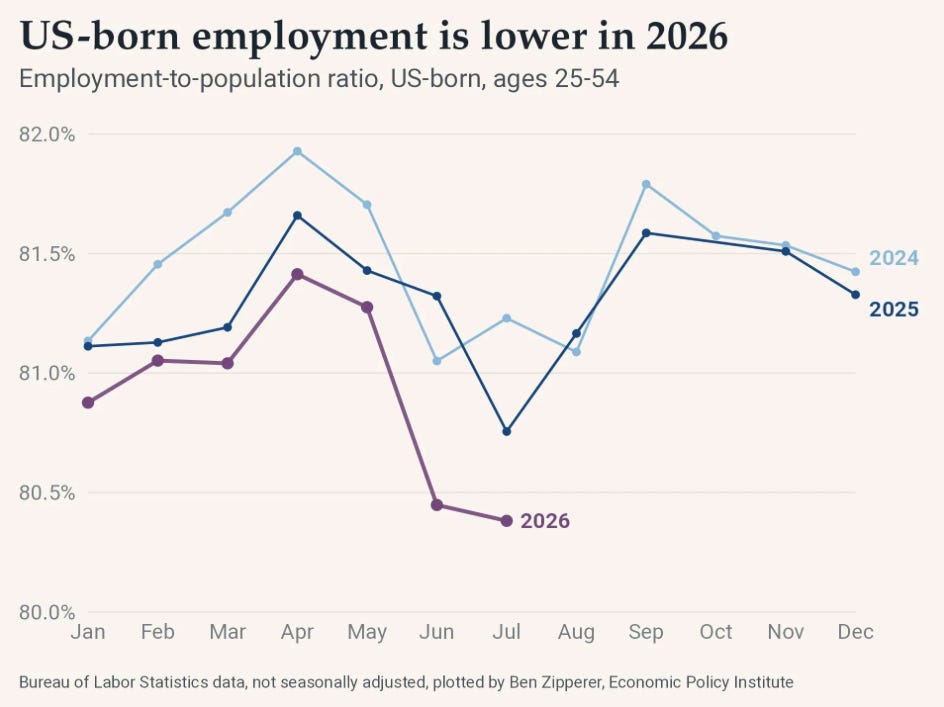
Ben Zipperer reminds us that even though the Trump administration promised that increased forced deportations would increase native-born American employment, in fact, the number of native-born Americans in the workforce has been tanking this year:
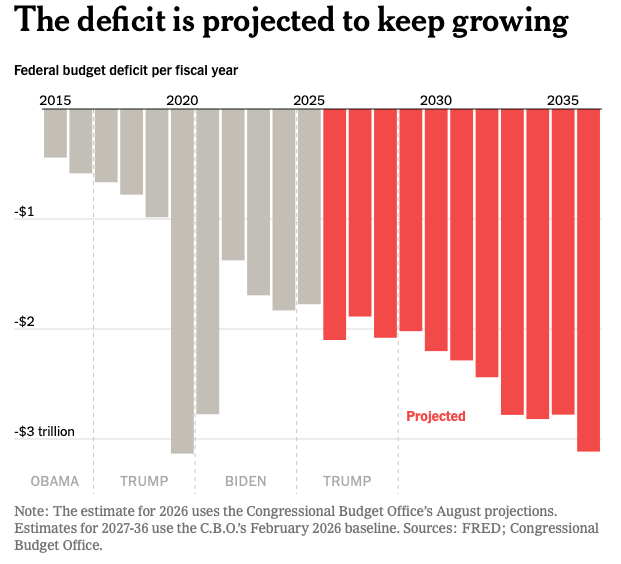
Steven Rattner wrote a must-read piece for the New York Times that investigates eleven distinct promises that President Trump made while running for re-election, pitting them against charts showing the Trump administration’s actual economic performance. Despite Trump’s promises to balance the budget—and Elon Musk’s claims that he would cut $2 trillion from the budget—the federal deficit is on track to grow at a record clip under Trump:
In an editorial for In These Times, Heidi Shierholz agrees with Nick Hanauer’s argument that the affordability crisis is also a wage crisis. She suggests that increased union power will help win back the wage gains that workers have lost. “We find that tripling union membership would raise pay for the typical worker by more than $7,700 every year, or nearly $270,000 over a 35-year career,” Shierholz writes. “This would be life-changing for a working family — nearly covering the cost of raising a child from birth through age 17, for example.”
On the Pitchfork Economics podcast, Nick and Goldy talk with Carrie Joy Grimes, founder of the nonprofit WorkMoney, which helps working Americans save more and pay less. Her bestselling book, The Joy of Money, consolidates some of the most important lessons Grimes has learned in her time at WorkMoney. This is a different kind of conversation for Pitchfork Economics—a ground-level look at the personal impact of not feeling good about the way you manage your money. It’s a great episode to send to friends who might not think they care about economics but know they’re falling behind financially for reasons beyond their control.
And Nick Hanauer appeared this week on a live video presentation of Anand Giridharadas’s Substack publication The Ink for a substantive conversation about the origins of Nick’s interest in economics, his work developing Market Humanism with Oxford economist Eric Beinhocker, and much more.
One report I look for every year is the AFL-CIO’s Executive Paywatch, which compiles publicly available CEO pay data from the Standard & Poor’s 500 index and compares it to worker pay. It probably won’t surprise you to learn that this year delivered another year of record-breaking compensation in the corner office.
“S&P 500 CEOs took home an average pay of $22.8 million in 2025 and made 312 times the wage of the median U.S. worker, up from 285 times in 2024,” the AFL-CIO reports.
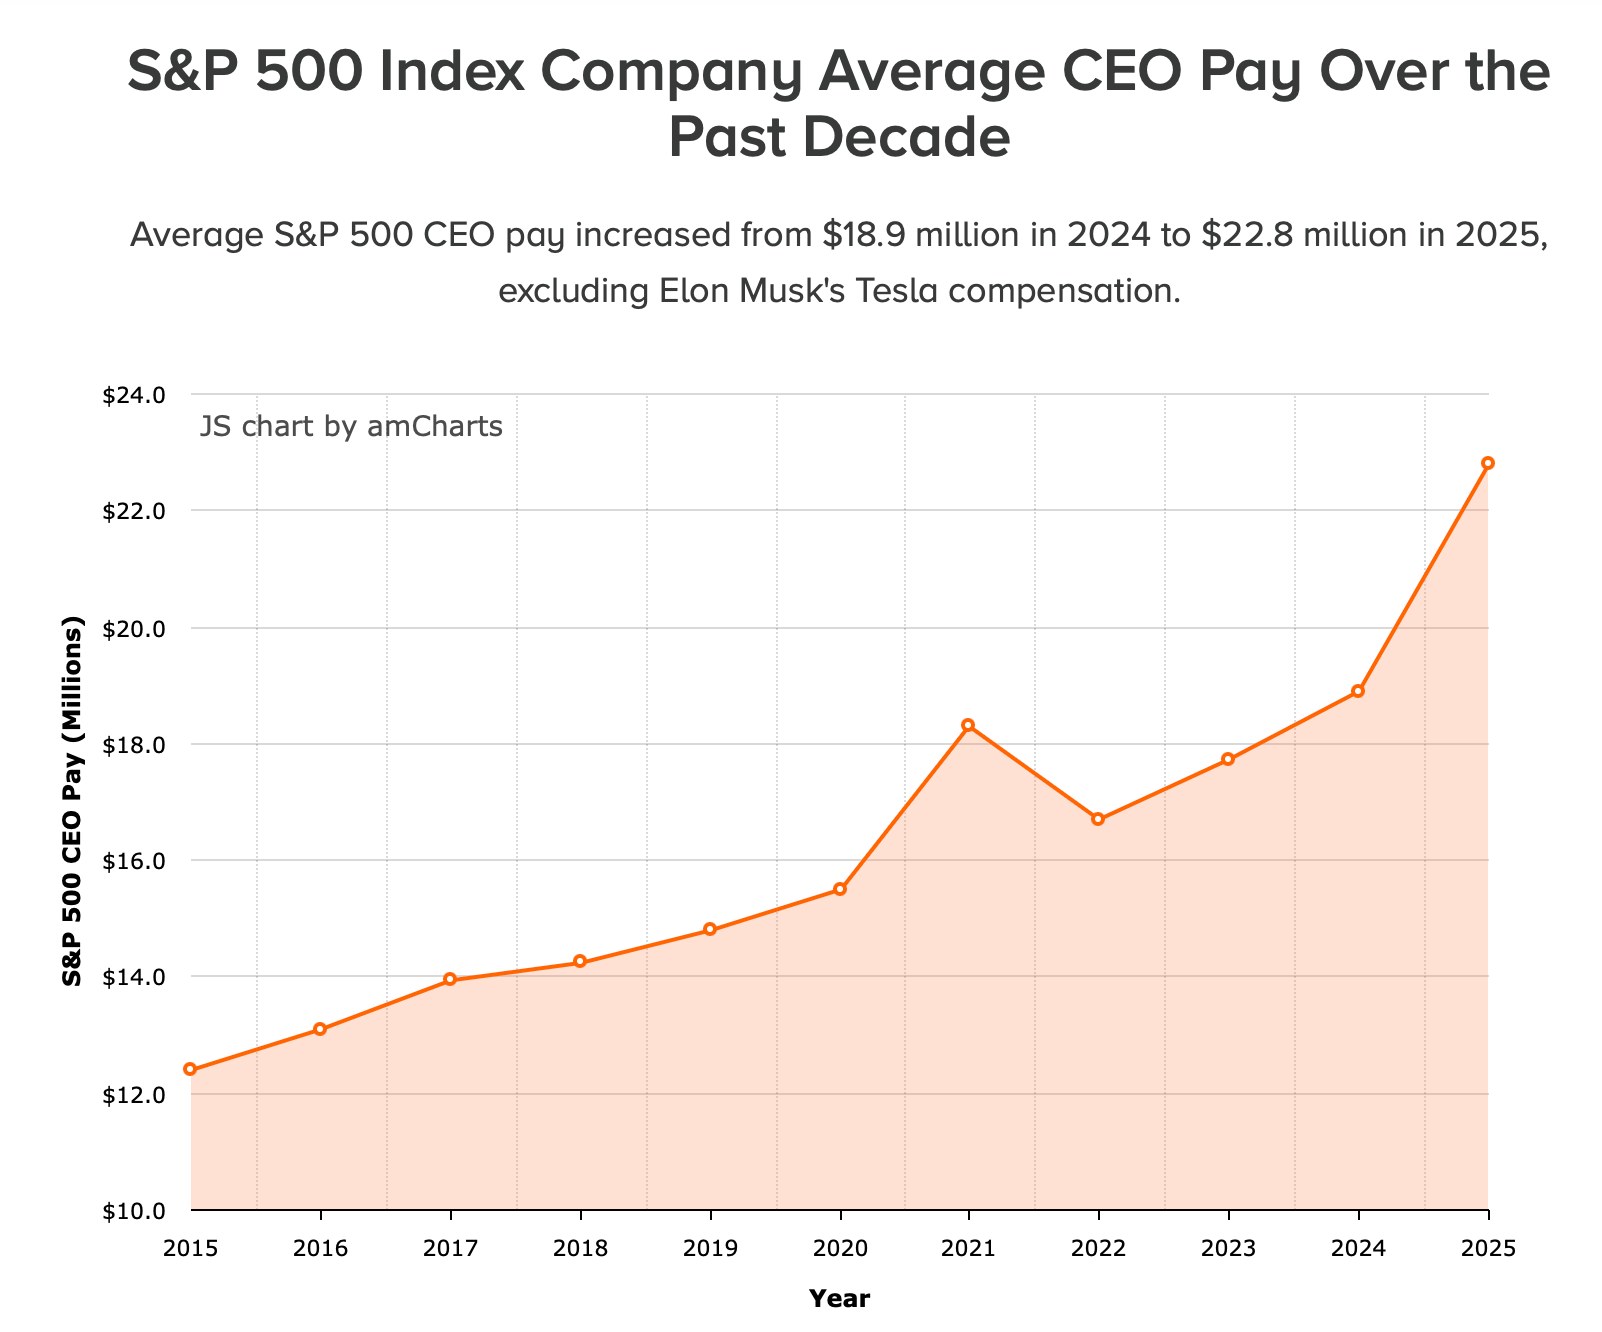
“Thanks to a 21% increase over the previous year, this year’s report shows the highest-ever level of executive compensation in three decades of tracking,” they write. Remember, even though Econ 101 professors tell students that the free market pays every worker exactly what they’re worth, that 21% pay increase is a raise that CEOs essentially gave themselves, with the blessing of their executive boards. The free market doesn’t factor into the equation at all.
One noteworthy development in this year’s report is that the AFL-CIO had to omit the earnings of one of the executives because his pay was so high it would have marred the dataset beyond recognition. They separated out “Elon Musk’s $158.3 billion pay package,” which temporarily pushed Musk into trillionaire status when SpaceX stock went public this year. Musk’s salary was “a figure so high it would have skewed the data on its own.”
Had they included Musk’s compensation, “the average S&P CEO pay [would have] exploded to $340.1 million in annual salary, a 1,700% increase from 2024.” The report notes that “Musk’s total compensation alone was 2,522,203 times the median Tesla worker’s pay in 2025.”
At the same time, “Tesla reported owing $0 in 2025 U.S. federal income tax on $5.68 billion in adjusted income, thanks to a number of tax breaks, including those signed into law by Trump in 2025.”
This is what I mean when I say $80 trillion of the wealth of the top 1 percent was sucked directly out of the paychecks of working Americans. The additional millions of dollars that CEOs opted to give themselves this year used to be invested into the workforce, who would then spend it in their local communities. That circulating money would grow the economy for everyone. Instead, it’s hoarded at the top, where the richest people in the world rub money together to make more money.
Mark Zandi, the chief economist at Moody’s Analytics, recently shared a graph that is fast becoming one of the most essential trackers of the modern American economy: The diminishing wealth held by working Americans versus the surging wealth held by the wealthiest Americans:
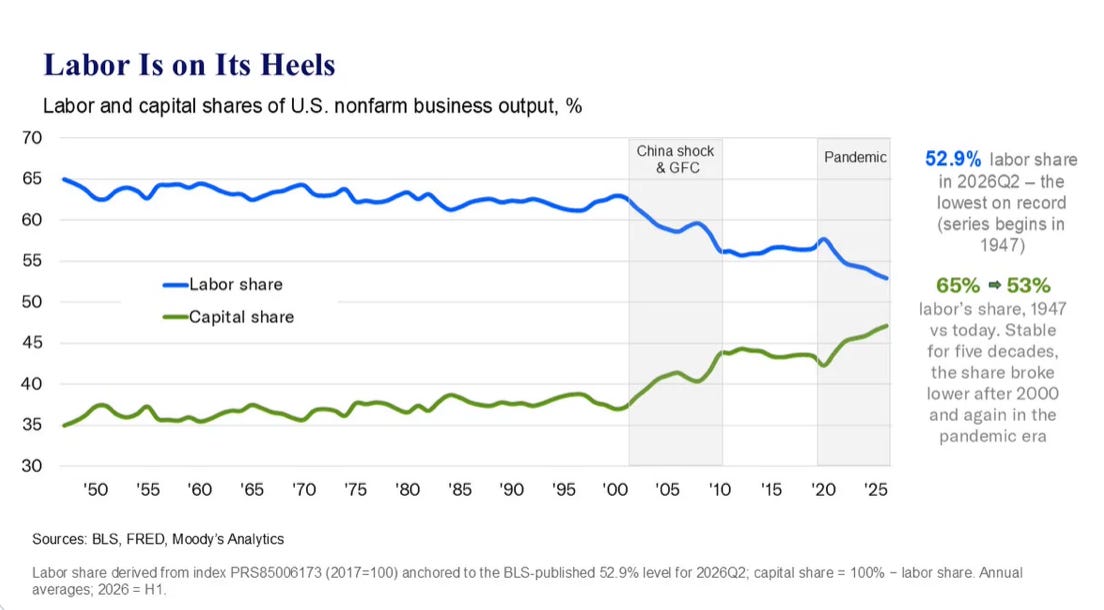
“From WWII to Y2K, workers received close to two-thirds of the pie, while capital received the other one-third,” Zandi explained. Now, “the split [is] closer to fifty-fifty.”
Zandi suggests the two biggest factors in the loss of worker wealth are the emergence of China as a world economic power and the pandemic. I’d argue that the three pillars of trickle-down economics—tax cuts for the rich, deregulation for the powerful, and wage suppression for everyone else—are much more likely to blame.
The economy is much healthier when workers own more of the economy. In general, the more consolidation we see, the unhealthier the economy is—it’s just as true when discussing monopoly power as it is when we talk about trillions of dollars in the hands of a few guys in suits.
These two charts, and in fact pretty much every chart in this issue of The Pitch, indicate to me the most important economic mission of the next time middle-out leaders win elections. It’s beyond clear that the people who gain their wealth through the accumulation of capital—that is, people who passively make money on stocks and other investments—are being preferred over people who gain their wealth by working for a living. In our tax code, we tax the profits made from an hour of work more than the profits made from an hour of sitting on top of a massive stock portfolio.
That needs to change. We need to revise our economic systems so that they once again respect the power of a hard day’s work more than they respect a private equity executive who shutters businesses, lays off workers, and pockets millions of dollars before lunchtime on a Monday. That’s the next great goal for the American project, and it is a goal that I believe we can win.
Be kind. Stay strong.
Zach
Comments
Nothing yet. Say the first thing.
Sign in to join the conversation.