
As many of you know, I’ve looked at AI based patent infringement tools in the past, having previously presented two analyses of tools. In the first analysis, the AI tools converged on a number of targets, several of which turned out to be infringing. In the analysis of the second portfolio the initial results showed a lack of convergence, which I later attributed primarily to vendor methodology, with model variability also contributing.
This expanded benchmark covers 51 patents in which 6 vendors (Patlytics, PioneerIP, PatentWatch, Techson, ClaimHit, and IP Copilot) used their platforms to look for company-product combinations where infringement was likely, rating that on a 0 – 1 (0 – 100%) certainty range or on a “high,” “medium” or “low” scale. One vendor, Techson, uses a “Tier 1”, “Tier 2” and “Tier 3” ranking. The non-numerical scores were converted to numerical scores according to high or Tier 1 = 0.9, medium or Tier 2 = 0.6, and low or Tier 3 = 0.2.
The combined analysis across all vendors found an astounding 12,049 possible company-product infringements, but only 373 of the combinations were found by 2 or more vendors and 66 combinations were flagged by 3 or more vendors. At the company-product level for an individual patents vendor reads barely overlapped and there was significant disagreement on the strength of the read when multiple vendors reported possible infringement. Sixteen company-product reads were found by 4 or 5 vendors (13 by four vendors, 3 by five). Of those 16, 12 fall in the 0.5–0.9 average-score band. This suggests convergence in a very small number of instances.
Focusing at the company level, the results were more encouraging on coverage: 421 companies were corroborated by 3 or more vendors, though their average infringement scores spanned a wide 0.17–0.93 (median 0.50), with roughly half falling between 0.4 and 0.6.
Looking across the entire patent portfolio, there was strong convergence on the top likely infringers (companies), as shown below. Strong reads are shown in red, weak reads in light yellow, with scores in between in shades of orange.
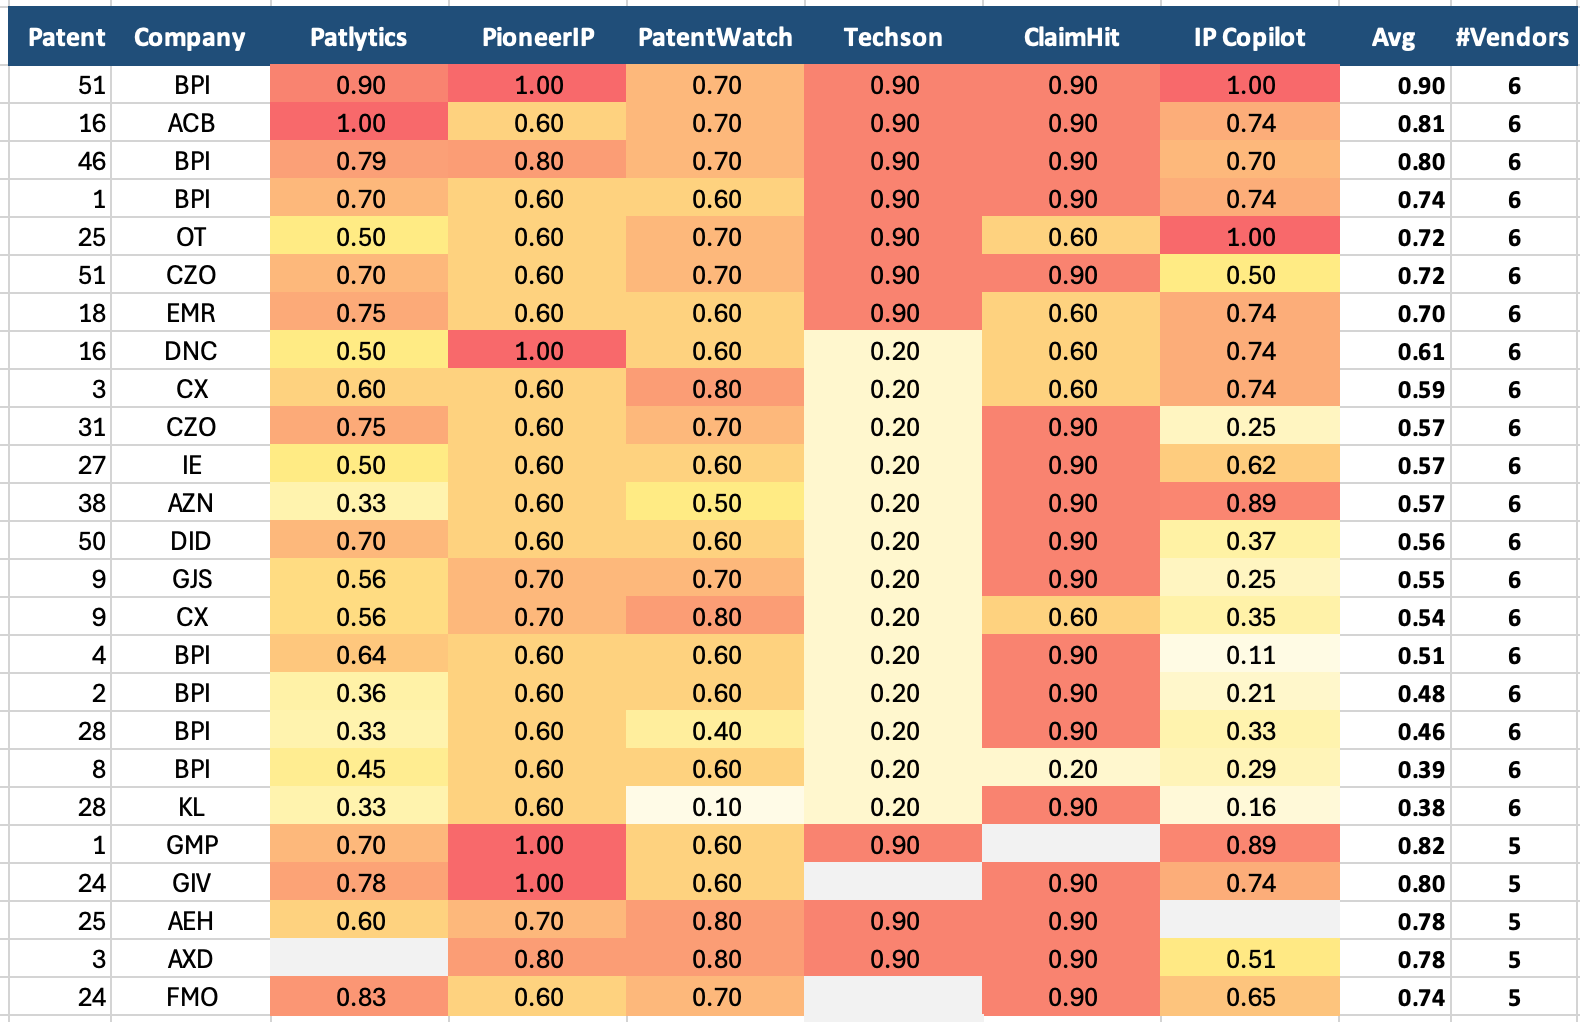
There is a lot of noise in the tools, but they produced a clear indication of use in specific fields through the identification of coherent company-product combinations (sampling of the results did not identify any reads that were completely off base) and identified the top assets and companies with product lines that need to be further examined.
Because of the volume of leads surfaced, we were not able to manually verify a large number of the proposed reads, but the reads we did investigate indicated that while the tools navigated to the right product space, individual tools missed many opportunities, as well as generating many false positives.
At the end of this article, I provide more specific recommendations but the short version is that while these tools save hundreds of human research hours and tens of thousands, if not hundreds of thousands of dollars looking for possible infringers, it is necessary to use at least two tools to reduce the risk of missing important product areas and possible infringers. The other recommendation is that although this work was done on a single pass basis, having at least one subscription-based tool to iterate on specific companies and product lines would appear to be necessary. As I’ve previously mentioned, using these AI tools replaced the problem of finding a needle in a haystack with the problem of having haystacks of possible needles to look through. Without a doubt, using two tools will provide a good overview of what product spaces and companies to investigate, but iterative analysis is necessary to refine the view and get a pile of true “needles.”
As a reminder, detecting possible infringement of a patent is just the first step in an arduous process to monetize the patent. The infringement needs to be thoroughly documented in a 2- or 3-column claim chart (claim language and evidence, with the optional third column being support from the specification to determine how claim language might be interpreted) and reviewed by a qualified patent attorney. Even if the claimed technology is in use, the validity of the patent needs to be assessed. This requires a prior art search, assessment of the prosecution history, and evaluation of all possible ways the patent might be shown to lack validity including anticipation, obviousness, lack of support in the specification, and non-statutory subject matter, just to name a few. Even if that is a go, and if there are significant economic damages, it’s somewhat unlikely the infringer will take a license, although one can (and I think should) try to come to a business arrangement. Patent litigation, when necessary, is extremely costly, sometimes being referred to as the “sport of kings.” In this go-go era of AI it’s tempting to think of patent infringement detection as scratching off a winning lottery ticket, but it’s just not that easy. If it were, I’d be writing this from a yacht or private island instead of Bushwick, Brooklyn.
To get started on this analysis, let’s look at results from two exemplary patents.
The results for company-product detection for the first exemplary patent (Patent #24) for the strongest 25 reads (based on average infringement likelihood scores) are shown below. As can be seen, the issue of single-vendor detections is striking as the vast majority of the possible reads have been determined by one tool. I call these reads “singletons.” In this example, of the 25 suggested reads, only 3 company-product combinations were suggested by multiple vendors.
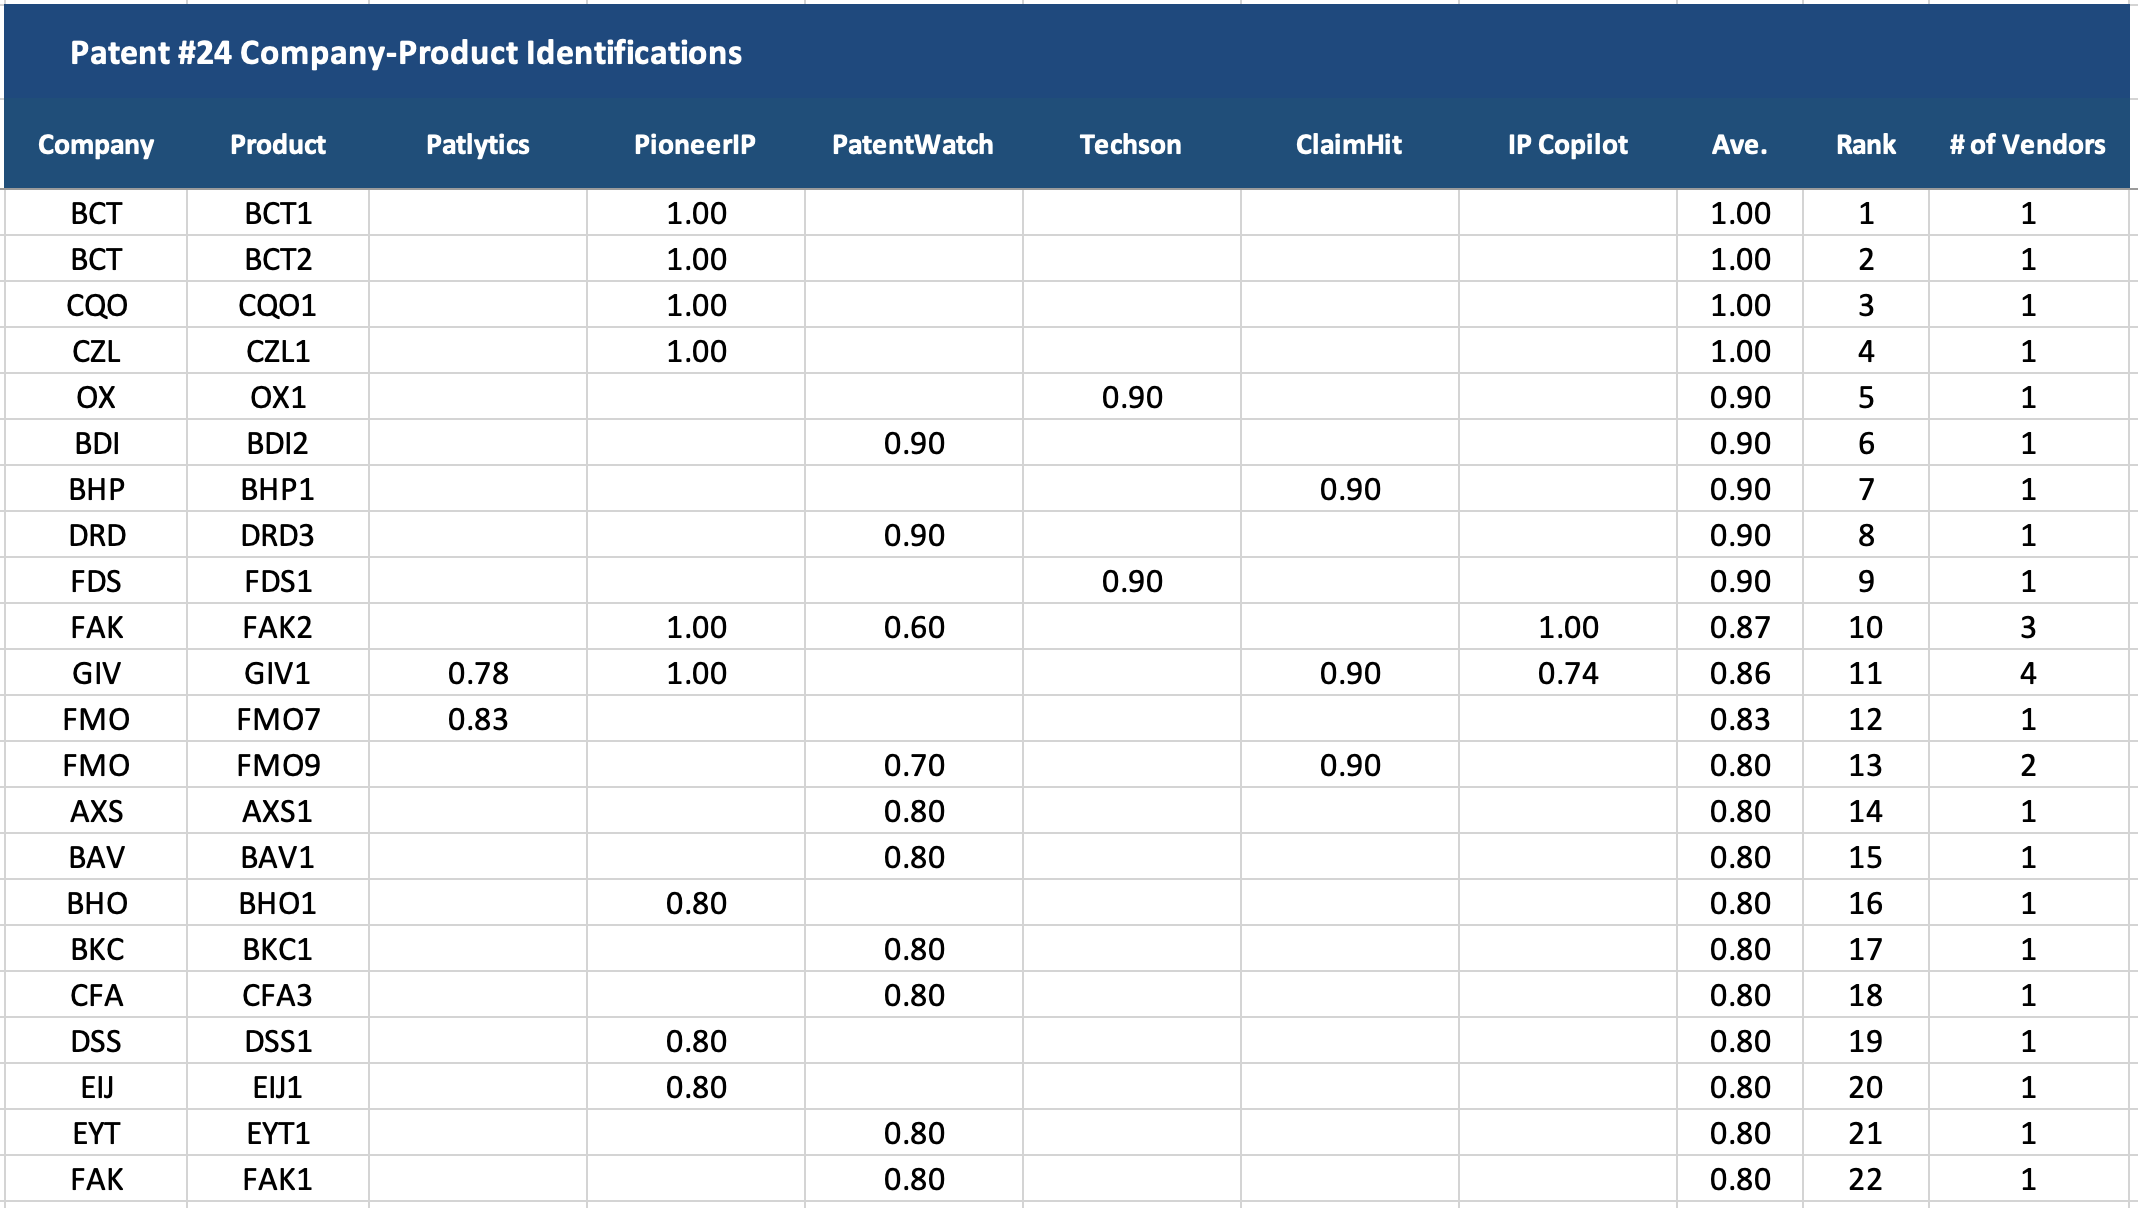
Now in comparing tools it is often the case that tools from different vendors identify the same product by slightly different names, or find similar products with different names, so a comparison like the one above might suggest that the lack of convergence is worse than it actually is. It’s difficult to completely identify and eliminate the redundant or similar product identifications, but we can look at the results on a company basis, ignoring the names of the specific products. In practice an analyst would then review the product lines for that company to determine the exact products that would need to be looked at in detail. The company-only results for Patent #24 are shown below.
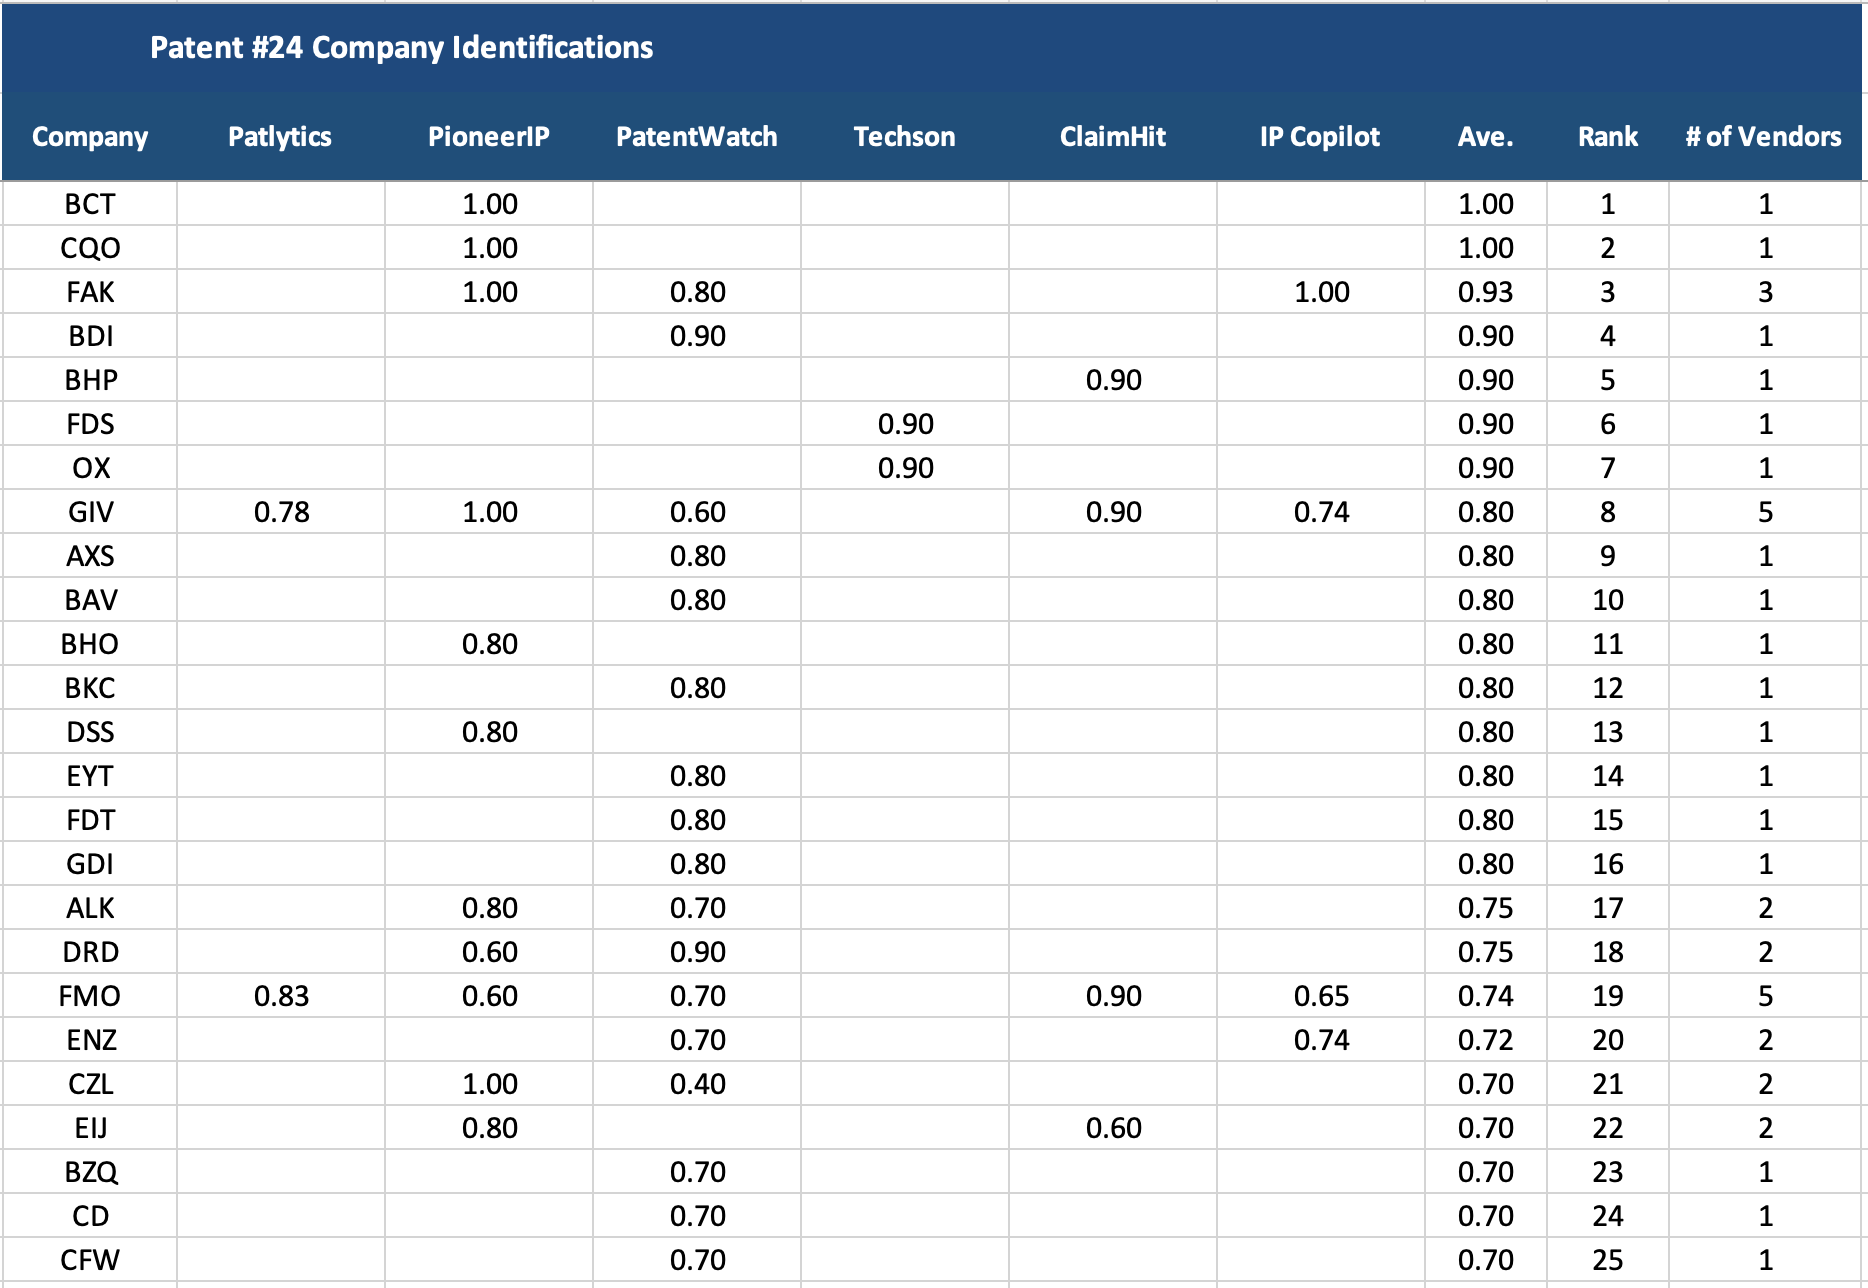
This view improves the situation slightly, with 8 of the 25 companies being identified by 2 or more vendors. That’s a little bit more convergence, but not much.
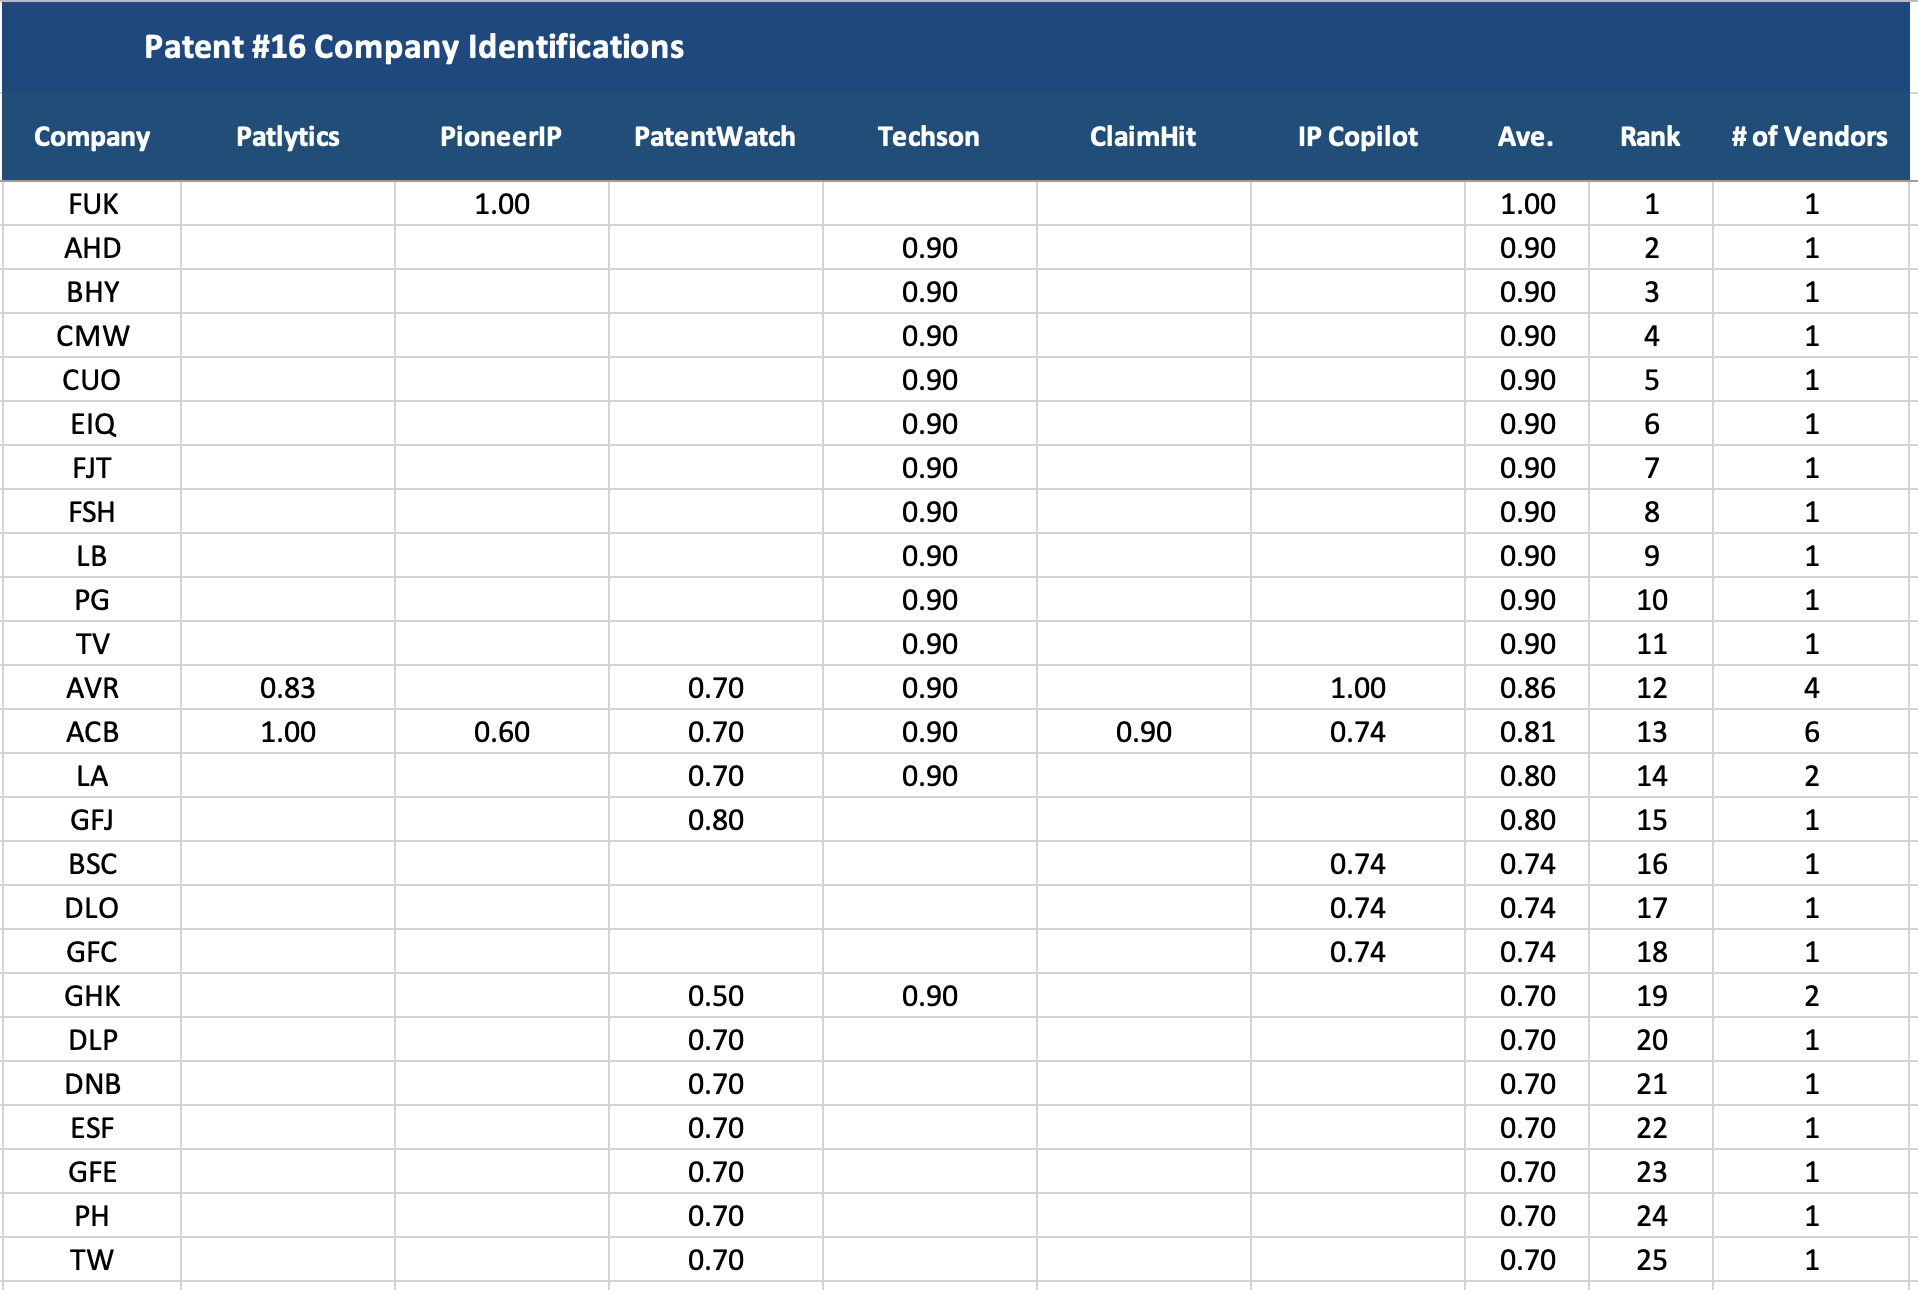
Looking at another example, Patent #16, there is even less convergence, with only one of the company-product combinations being found by more than one (in this case 3) vendors.
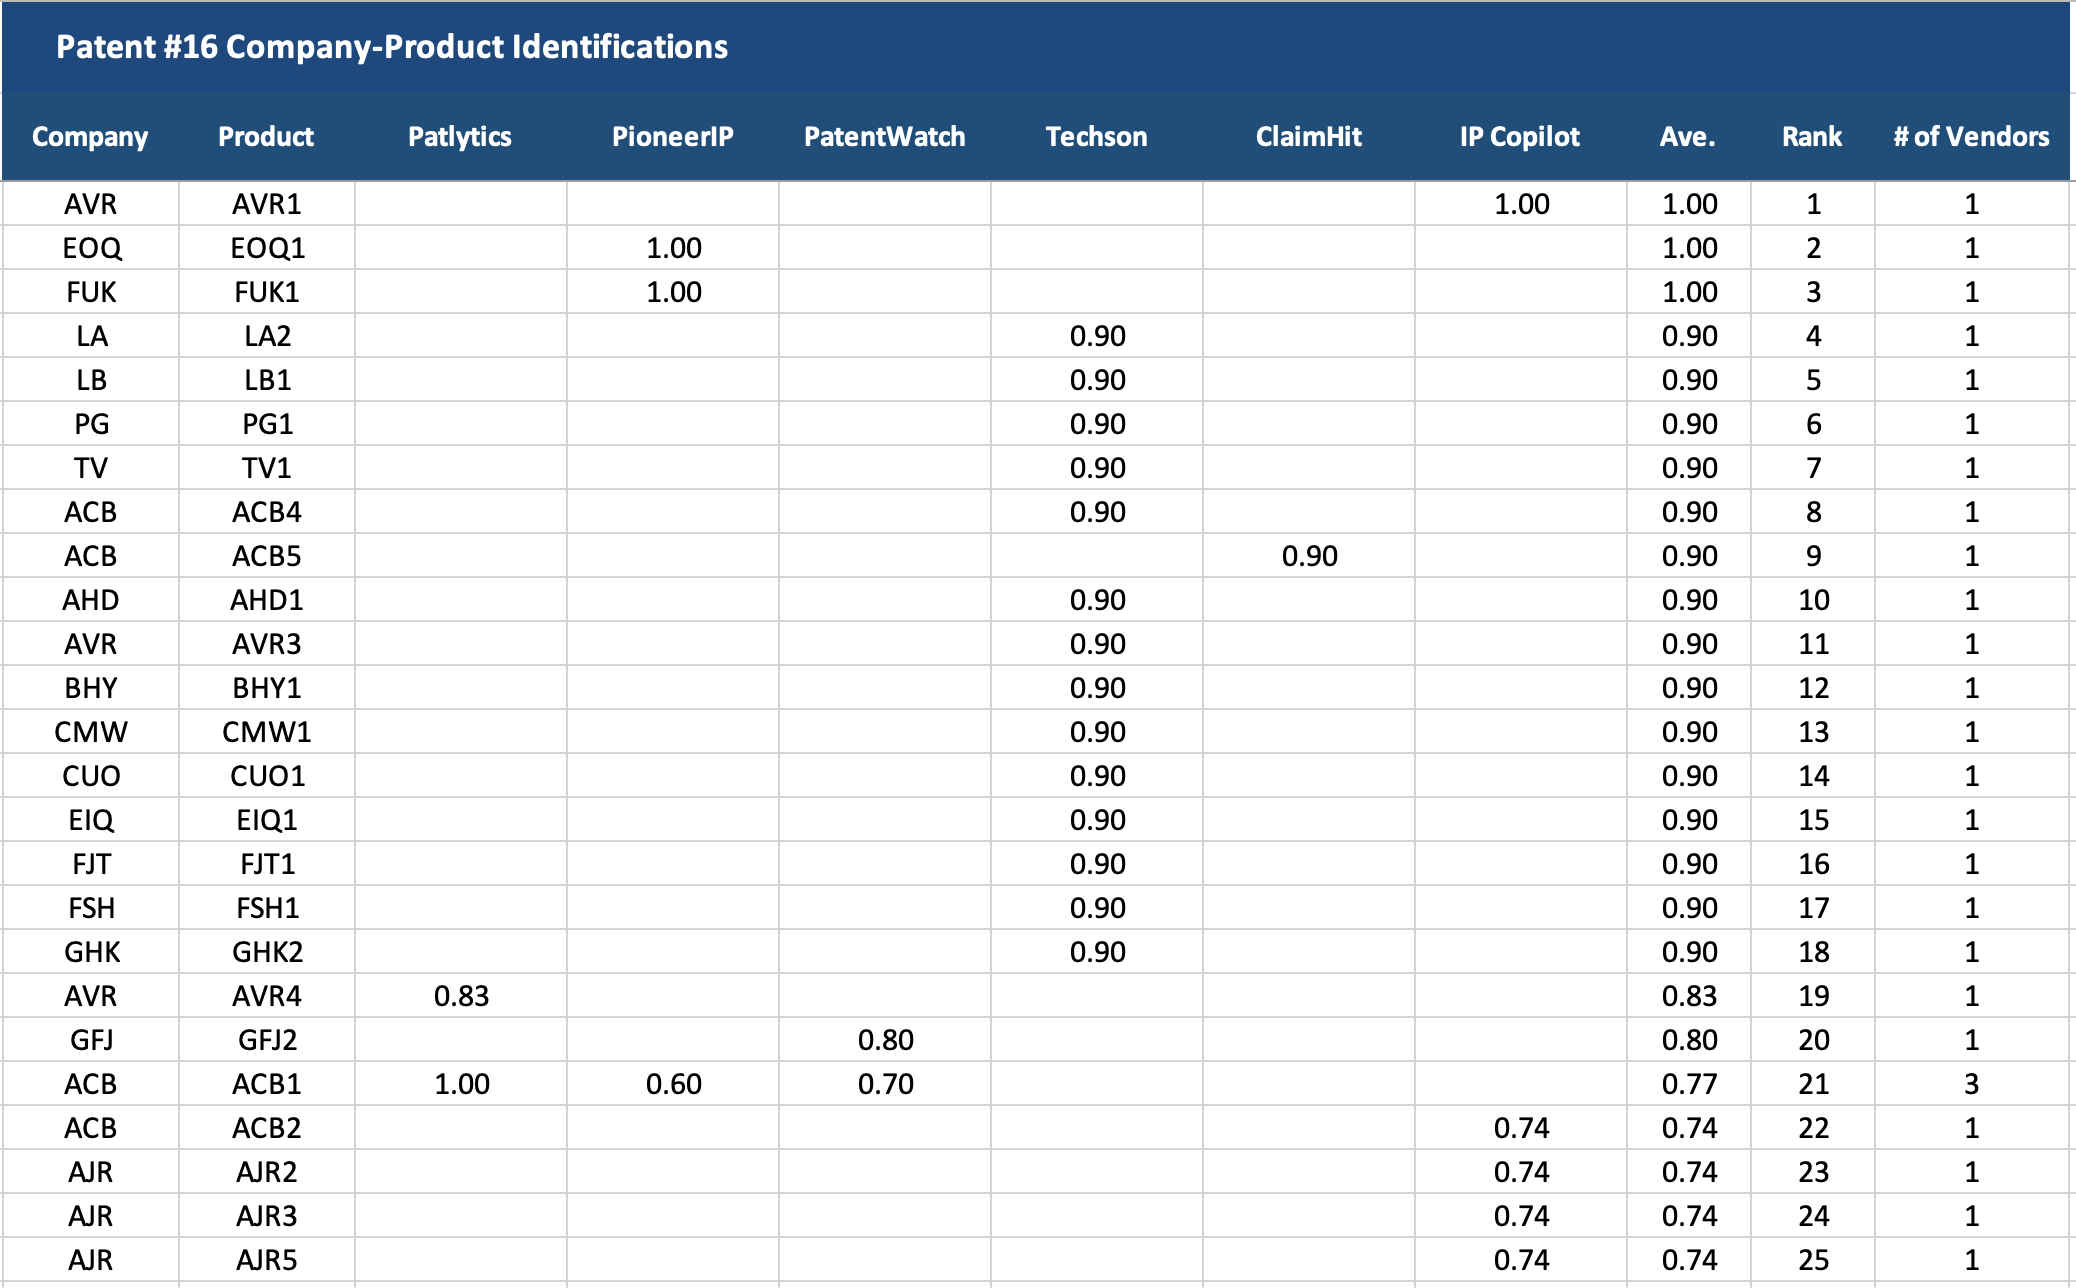
At the company level, the situation only improves slightly, with 4 out of 25 companies being identified by 2 or more vendors.
Before we get too far into trying to figure out what this all means, let’s look at some of the similarities and differences between the tools. Having a statistically significant number of potential reads means we can gather some useful information.
The first parameter to look at is what I refer to as the “gain” or “sensitivity” of the tool in looking for possible reads. Some tools tend to produce more reads than others for a given patent. Looking across the complete portfolio we can get the picture of the total number of leads produced for each vendor, or the vendor gain/sensitivity as shown below.
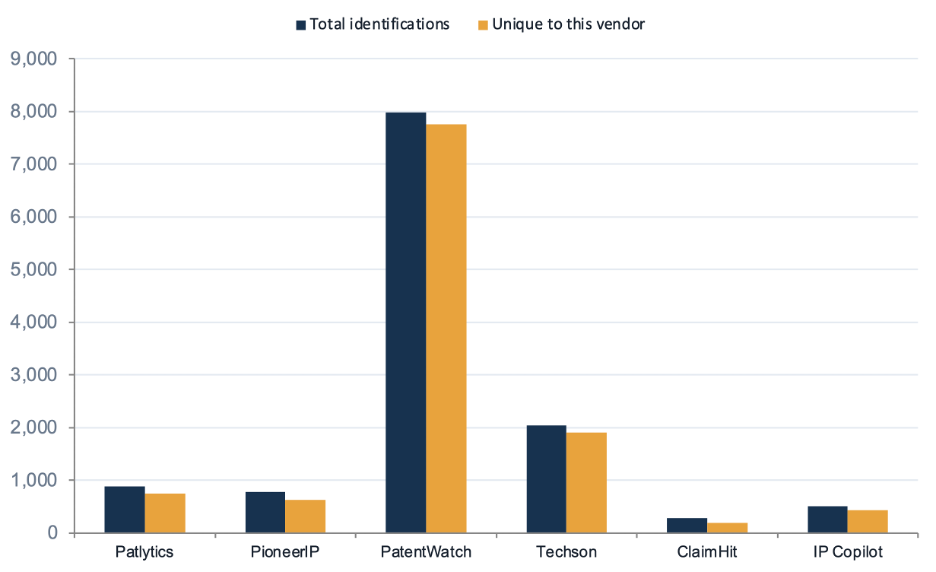
PatentWatch has the gain turned way up, producing close to 8,000 potential reads, with 7,756 of those being singletons, not having been identified by any other vendor. Techson also appears to have a relatively high sensitivity with 2,040 reads, although not nearly has high as PatentWatch. ClaimHit identified the least number of possible reads at 293, with the other vendors coming in at 893 (Patlytics), 786 (PioneerIP), and 515 (IP Copilot). Notably, the “unique” share is high across the board,7,756 of PatentWatch’s 7,980 reads were singletons, 1,902 of Techson’s 2,040, and 756 of Patlytics’ 893 were flagged by no other vendor, underscoring how little the vendors overlap.
The other parameter to look at is the vendor’s strength of read calibration, meaning how aggressive or conservative the tools are with their ratings of possible infringement. The average read strength for the different vendors across the entire portfolio is shown below.
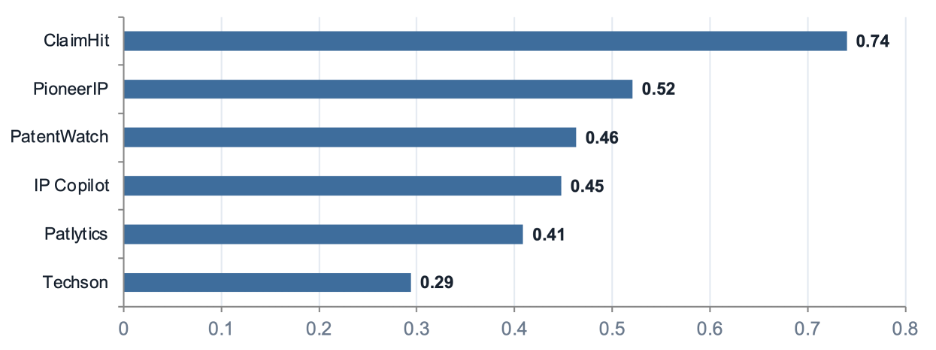
From this we see that ClaimHit is the most aggressive, suggesting that although they don’t identify a lot of possible infringements, they are bullish on the ones they do identify. At the other end of the spectrum is Techson, which appears to be conservative in their ratings. Recalling that they were second in the number of leads they generated, that is an interesting result and might suggest that although they generated a significant number of leads, they have significant confidence in their “Tier 1” reads as they call them. PatentWatch is moderately optimistic in their reads, creating a potential problem given the overwhelming number of leads they generated.
While you might hope that this work results in some confident ranking of vendors in terms of their ability to find possible infringements, it is impossible to do that without verification of the suggested reads via comparison with detailed human assembled Evidence of Use (EoU) slides or claim charts which map the parsed language of each claim element specifically to the product information, test result, or other evidence. AI is simply unable to do that effectively, at least at this point. Having humans attempt to create those EoUs or charts is clearly infeasible for the 12,049 company-product infringements, and providing this analysis for even the smaller sets of 373 combinations found by 2 or more vendors or 66 combinations flagged by 3 or more vendors is costly.
That being said, we can provide some examples of how this picture looks when we start verifying possible infringements via human-driven pencil and paper, so to speak. We’re continuing to analyze this portfolio and the many monetization opportunities that it presents.
The first example is a patent with independent claims that appear to map to many products across multiple companies. In verifying the vendor reads we developed EoUs and ranked those reads as high, medium, or low, corresponding to our determination of likely infringement. This is shown in the rightmost “Strength of Read” column. We then “graded” the vendors for their reads on that patent by assigning a green color if they both identified the possible infringement and gave it the same score (in the high, medium and low ranges), yellow if they gave it a score that was one away from our high or low score, red if they failed to identify a product where our score was high, and yellow if they failed to identify a product where we determined a medium likelihood of infringement. Furthermore, a red box (low score) was assigned if they suggested a high degree of infringement on something we found no likelihood of infringement for as it results in an inefficient use of human resources (“tilting at windmills”). A green box (high score) was awarded for not identifying a product that we rated as having a low likelihood of infringement but which was identified by another vendor as a high or medium, since based on our analysis it was a low- or no-value read and spending resources on evaluating that lead would be pointless. The results, for patent #51 are shown below.
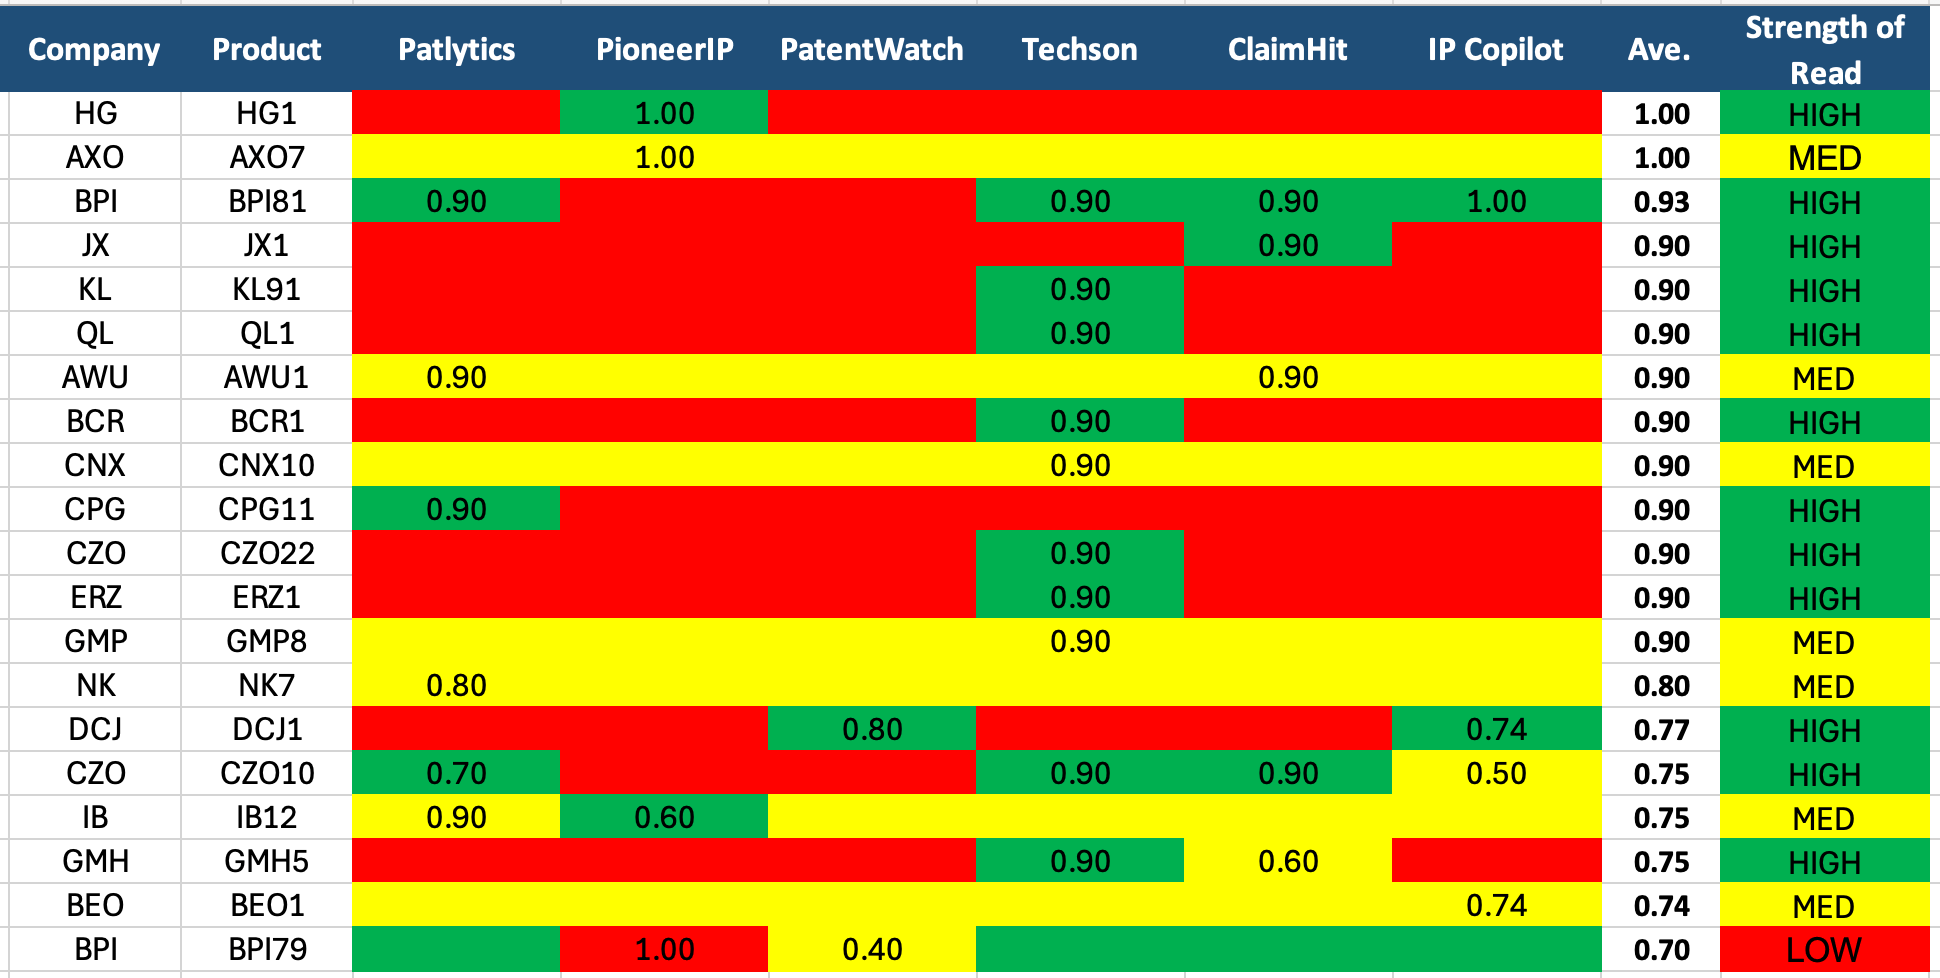
Accepting the accuracy of our human generated EoUs (but acknowledging they are inherently subjective) we can see that Patlytics, Techson, ClaimHit, and IP Copilot all found the same high ranked company-product combination we also saw as a high read (row 3), but only Techson found a significant number of the other high ranked reads we confirmed.
Before reading too much into this result, let’s take a look at another example, a patent (#6) which has an interesting backstory in that the claims at hand were developed with two specific products (top two rows) in mind. As such, we knew, a priori, who the two most likely infringers are. The results of our verification are shown below.
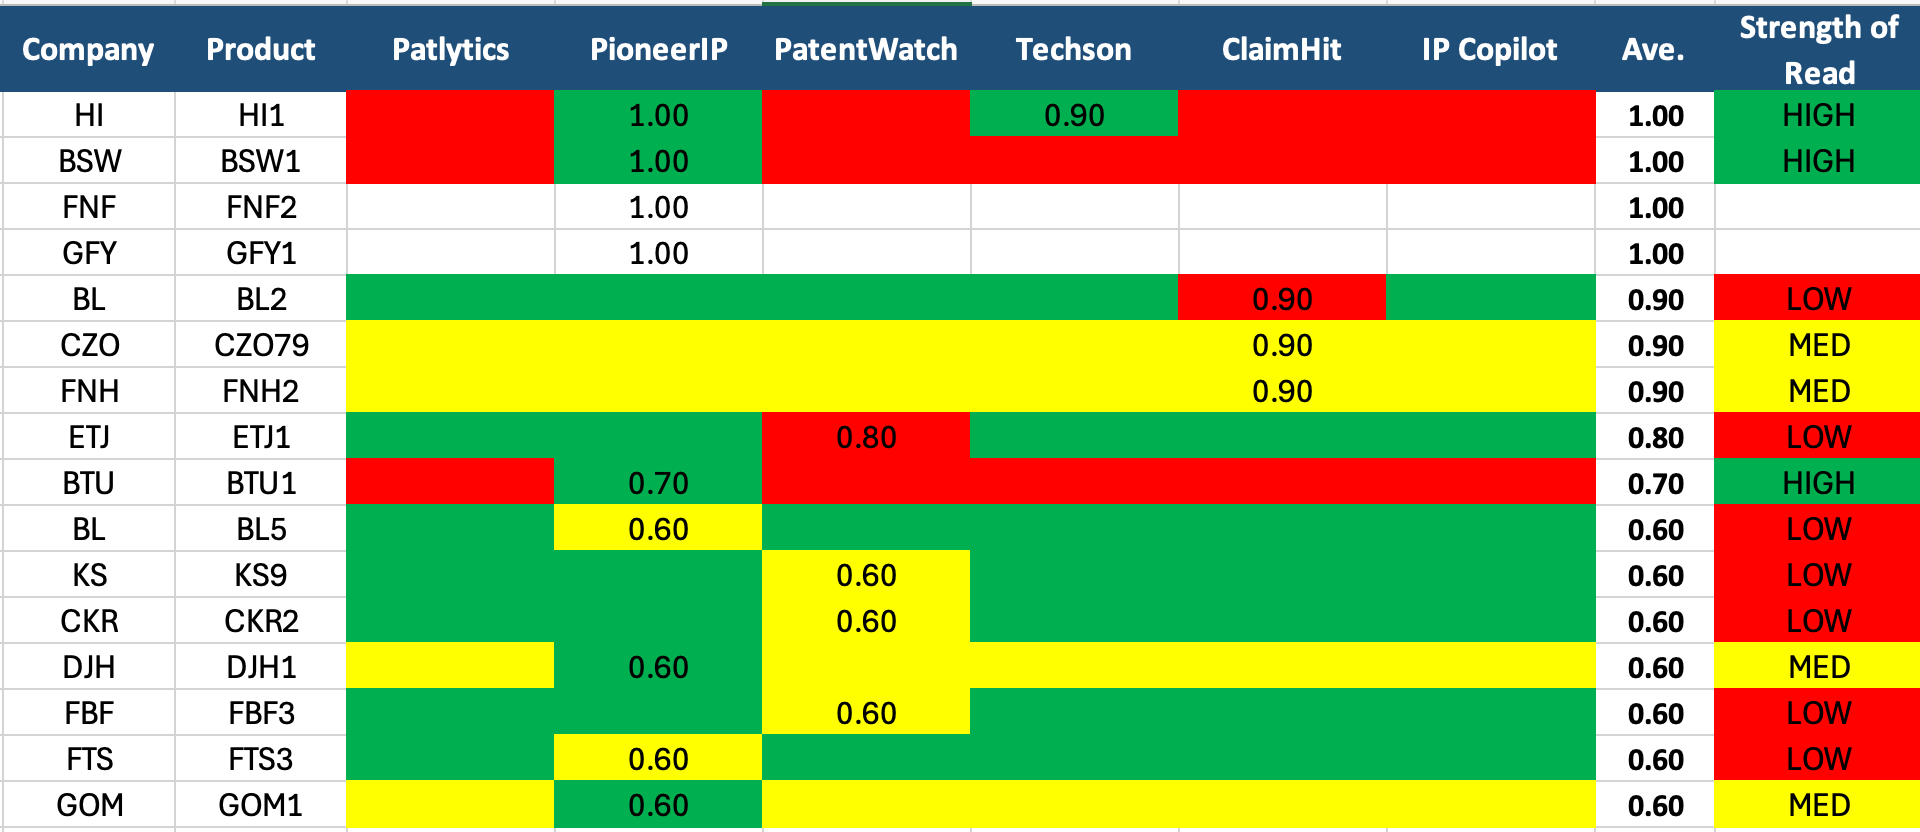
In this instance, PioneerIP correctly identified the two top targets, with Techson identifying one, but not both of those targets. PioneerIP then identified the same product as that in row one two more times, not resolving the differences in company names (they are all the same entity) so that suggests some noise in their company-product identification, at least in this example. As such, the two uncolored rows are actually the same product as row one and were left ungraded. ClaimHit did not identify either of the top two leads, and Patlytics and IP Copilot failed to identify any products in the space.
This gets to a fundamental issue that appears to be distinguishing vendors, and that is where they focus their searching for company-product combinations and how they perform that search. To use the analogy one vendor provided me with, it’s like you are pointing a flashlight into a large dark room and picking a spot to look at. Now where you look at after that, and how you control the search are also variables, but it’s clear that the more you search the higher your costs will be, so choosing the initial search area is important.
I believe that where the flashlight gets pointed initially depends on the search criteria that is generated from a Markman type analysis of the claim language, where more descriptive versions of the claim language are developed based on the specification as well as knowledge of the field. In prior art searching the term “adversarial language” is sometimes used to describe language a searcher uses that is substantially different than the claim language and likely to surface invalidating art, frequently from a slightly different field where the language may describe the same concept, but in different words. In this instance we might refer to the language developed for the product search as “opportunistic language.”
If the opportunistic language used to characterize the claim results determines where the flashlight is initially pointed the issue of how the flashlight is scanned or repointed to another product space arises. Where you repoint to and how long you keep searching sounds like tricky (and potentially expensive) business so better to do a good job aiming the flashlight the first time.
I would also point out that some vendors have suggested that their search criteria are moderated by the size of the company and the implied revenue of the targeted product line. While that may be a means of controlling costs for them, it doesn’t benefit the patent holder, who wants to know of any and all possible infringements to determine if their claimed technology is in use, and how to manage the portfolio in terms of continuations, corresponding foreign assets, and cost control via pruning. To the extent that type of lead screening is being done by some vendors, it may explain why they are missing leads.
In spite of not being able to provide a vendor ranking, some clear recommendations are possible:
Use two tools to confirm the companies that are being surfaced so that the product lines can be more closely examined. The “singleton” problem won’t be eliminated, as each vendor generates a significant number of unique leads, but confidence in the companies to be examined, and the specific types product lines to investigate, will increase.
Perform iterative analysis using at least one tool to further inspect the product lines of the identified companies and look for other company-product combinations based on the identified pairs.
Use AI post-processing systems, in the form of commercial tools like Claude Cowork, or custom solutions, to parse the verbose “claim chart” vendor output and guide human analysts to the best evidence for building EoUs or actual claim charts.
A natural question that arises is “which two tools?”, the answer to which depends largely on business, rather than technical issues. I have not compared the pricing of the vendors in detail, and am reluctant to do so since I am almost certain it is in flux, but can offer some observations about the marketplace as it stands today.
Patlytics is the largest player, having raised approximately $65 million to date, and offers a comprehensive platform on a subscription basis. Needless to say, it’s not the lowest cost, or even a low-cost, solution but is a comprehensive tool for all aspects of patent management. At the other end of the spectrum is Techson, a patent advisory service founded in 2015 which provides access to their AI powered Limestone tool on a Results-as-a-Service (RaaS) basis which is priced per asset. For users with a subscription to Patlytics, combining the heatmaps with an analysis from Techson is both an efficient and cost-effective solution. The results of this study indicate that the Techson tool generates many significant leads. Based on the initial results from both platforms iterations can be performed using the Patlytics heatmap tool. As such, if your organization has already shelled out the bucks for a Patlytics license, it’s logical to use it as one of the tools and for iterative analysis, supplementing with a single pass report from Techson.
Comparing other combinations is difficult as the range of services offered and corresponding pricing varies substantially between vendors. PioneerIP offers both subscription plans and search packages and can be used either way and combined with analysis from another vendor. In addition, the individual patent data presented here, although only a sampling, does suggest that the PioneerIP tool has a high degree of accuracy in locating reads. They were the ones to give me the flashlight analogy, so kudos to them for having a seemingly good pointing algorithm for their flashlight. IP Copilot provides a suite of invention management tools including invention discovery, prior art search and portfolio management, so infringement detection is only one part of their offering. As such, users with a subscription to that tool for invention management may find it an appropriate platform for iterative analysis, combining it with a single pass view from another vendor. PatentWatch and ClaimHit are, for the moment, focused on infringement detection and offer customized pricing as well as continuous portfolio mining, so they could presumably be used for subscription based mining and iterative work as well as single-pass portfolio examination.
As I’ve mentioned in previous articles, I’ve found the vendors easy to work with, flexible, and looking for business. The data provided here should provide some guidance for selecting combinations of tools. Getting the best pricing and exploring the interfaces and iterative features of each tool is left as an exercise for the reader.
Post processing of data, especially with data from multiple vendors, remains a challenge. I’ve had clients build their own internal systems to sort through the hundreds of pages of “claim chart” materials from multiple vendors and allow human patent analysts to home in on the specific evidence they need for an EoU or actual claim chart. I suspect vendors will begin to build such features into their tool, or other vendors will develop tools that can incorporate the output from multiple vendors and present it in an interface that facilitates development of a chart or EoU but a human analyst. Maybe a plug-in for PowerPoint or Word that allows the analyst to search the composite tool output based on a specific claim element, perform additional web searches, and find the evidence to place in the EoU or chart will be forthcoming.
I’d like to thank all the vendors for their generous contribution of both time and tokens. They have been genuinely great to work with and contributed to this effort in the interest of improving the accuracy of the tools. With some luck that will lead to not only increased accuracy but healthy competition on other aspects and features of these powerful platforms.
A big shoutout to my colleague, Khaliq Chou-Kudu, who scrambled to pull together enough EoUs to begin to understand these results. His expertise as a patent analyst, using his engineering expertise with his recently obtained patent agent registration, has been invaluable.
And finally, thanks to you readers for supporting this work and providing valuable feedback. I’m sure many of you (including my wife) went from the summary directly to the recommendations but you are highly valued, nonetheless. A special thanks to the patent nerds with the endurance to read this entire piece.
As a note, neither I nor my company, CAsE Analysis, Inc. (who performed the study) have any affiliation with any of the vendors mentioned in this report. The work was funded by CAsE Analysis, with the goal of better understanding the operation and performance of the tools and for the benefit of the industry.
No posts
Comments
Nothing yet. Say the first thing.
Sign in to join the conversation.