
A few weeks ago, I published the first version of an interactive dashboard tracking fifty years of U.S. energy public funding. It covered eight technologies, about 40 funding streams, and roughly $700 billion in cumulative support.
This next version covers fourteen technologies, 70 funding streams, and roughly $1.8 trillion.
You can explore it here. The source data spreadsheet is downloadable directly from the dashboard.
To put it simply, the number is bigger because I added more stuff. But the additions forced me to confront a question that could take me down an endless road of data: What is public funding?
Version two adds six new technology categories: energy efficiency, biofuels, grid and transmission, hydrogen, hydropower, and biopower (biomass electricity). Each required its own data sourcing and, in the process, pushed my thinking on what “public funding” means and on the value-neutral approach of this project.
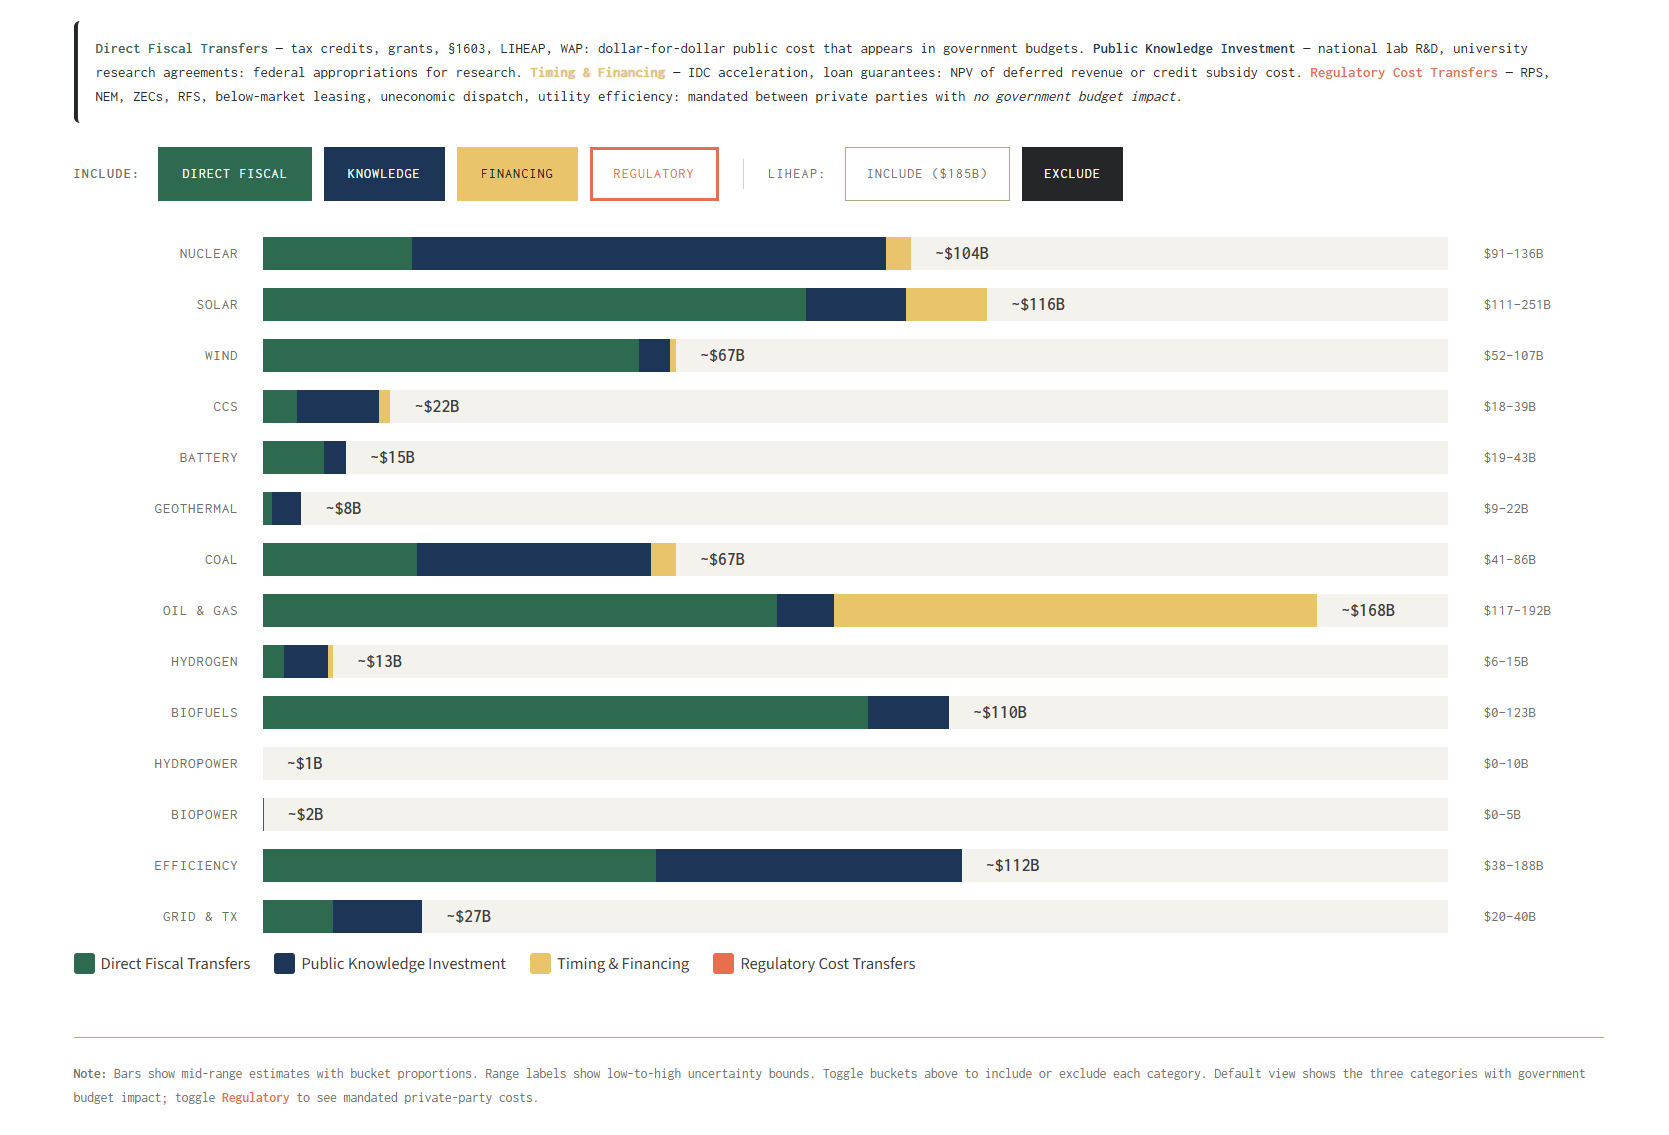
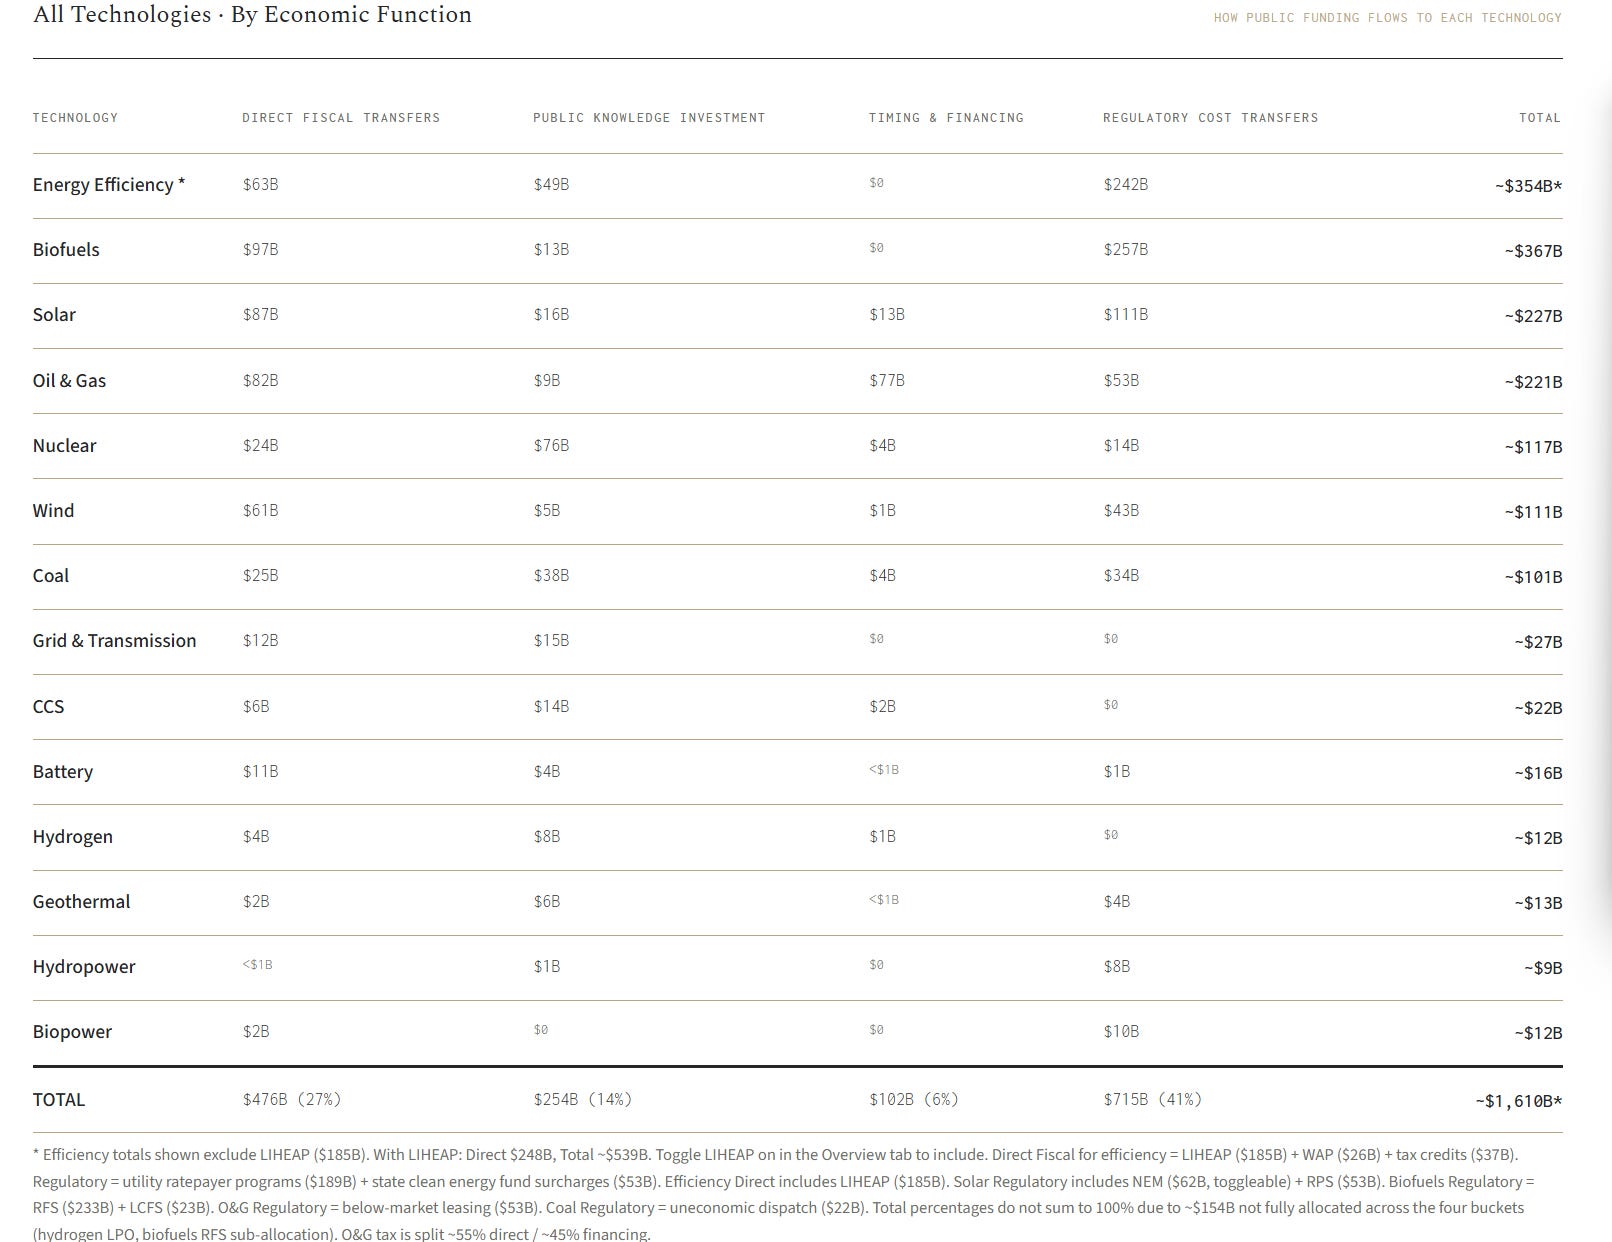
Energy efficiency turned out to be the largest category. At roughly $354 billion (excluding LIHEAP), it surpasses every other energy resource. The three largest streams are utility ratepayer-funded demand-side management programs ($189 billion, sourced to ACEEE State Scorecard data), state clean energy fund surcharges ($53 billion, cross-validated against NYSERDA, NJ BPU, and CT Green Bank annual reports), and DOE weatherization and buildings R&D. I also got data for the low-income home energy assistance program (LIHEAP). If you include LIHEAP ($185 billion), efficiency reaches $539 billion. The dashboard lets you toggle LIHEAP on and off because reasonable people disagree about whether a poverty alleviation program belongs in an energy technology analysis. I decided to include it because public funds were spent on it. However, I personally think this program has high societal value and importance. Although it is a high spend, I think there are good reasons to spend that money.
Biofuels is the second largest, at $367 billion. The Renewable Fuel Standard (RFS) alone accounts for $233 billion in compliance costs, sourced to Irwin, Gerveni, and Hubbs (2025) and cross-validated against AFPM industry estimates. The California LCFS adds $24 billion, calibrated to Cullenward’s October 2024 Kleinman Center analysis.
Hydrogen, grid, hydropower, and biopower are smaller but fill gaps in the total view of energy resources. Hydrogen ($12 billion) is almost entirely R&D and IIJA hub grants (which may or may not actually be administered), with very little deployment incentive to date. Grid ($27 billion) captures ARRA Smart Grid and IIJA transmission programs. Hydropower ($9 billion) includes Power Marketing Administration below-market electricity pricing. Biopower ($12 billion) fills a cross-subsidy gap where biomass PTC and RPS compliance costs were not previously allocated to any technology. Much of the federal funding for hydro was previous to the 1975 cutoff for this analysis.
Beyond new technologies, version two includes several new streams within existing categories. Federal coal leasing ($12 billion, sourced to ONRR royalty data and Headwaters Economics) and below-market oil and gas leasing ($53 billion, sourced to ONRR and benchmarked against the IRA’s 16.67% royalty rate) are both classified as regulatory cost transfers. Coal’s total went from $65 billion to $101 billion with the addition of leasing and uneconomic dispatch. Oil and gas went from $158 billion to $221 billion.
I also corrected several data streams against primary sources. LIHEAP now has 46 annual keyframes from the LIHEAP Clearinghouse instead of interpolated estimates. ONRR leasing royalties use calendar year data from 1982 through 2025. ACEEE utility efficiency spending is anchored to Figure 2 of the State Scorecard (1993 through 2023). CARB LCFS uses December year-end credit transfer reports for 2019 through 2025. In each case, the correction moved the confidence rating from MID or LOW to HIGH.
In the first post, I mentioned wanting to build a more principled classification of public funding by economic function rather than just instrument type. It’s important to understand what kind of funding went to each technology, and how that funding hits, or doesn’t hit, government budgets. Every stream is now assigned to one of four buckets:
Direct Fiscal Transfers ($476 billion): tax credits, grants, Section 1603 cash grants, LIHEAP, WAP. Dollar-for-dollar public cost. This money shows up in government budgets.
Public Knowledge Investment ($254 billion): national lab R&D, university research agreements, DOE program office budgets. Federal appropriations for research. Also shows up in government budgets.
Timing and Financing Advantages ($102 billion): IDC expensing acceleration, loan guarantees. The NPV of deferred revenue or the credit subsidy cost of loan programs. Has government budget impact, though the mechanism is less direct.
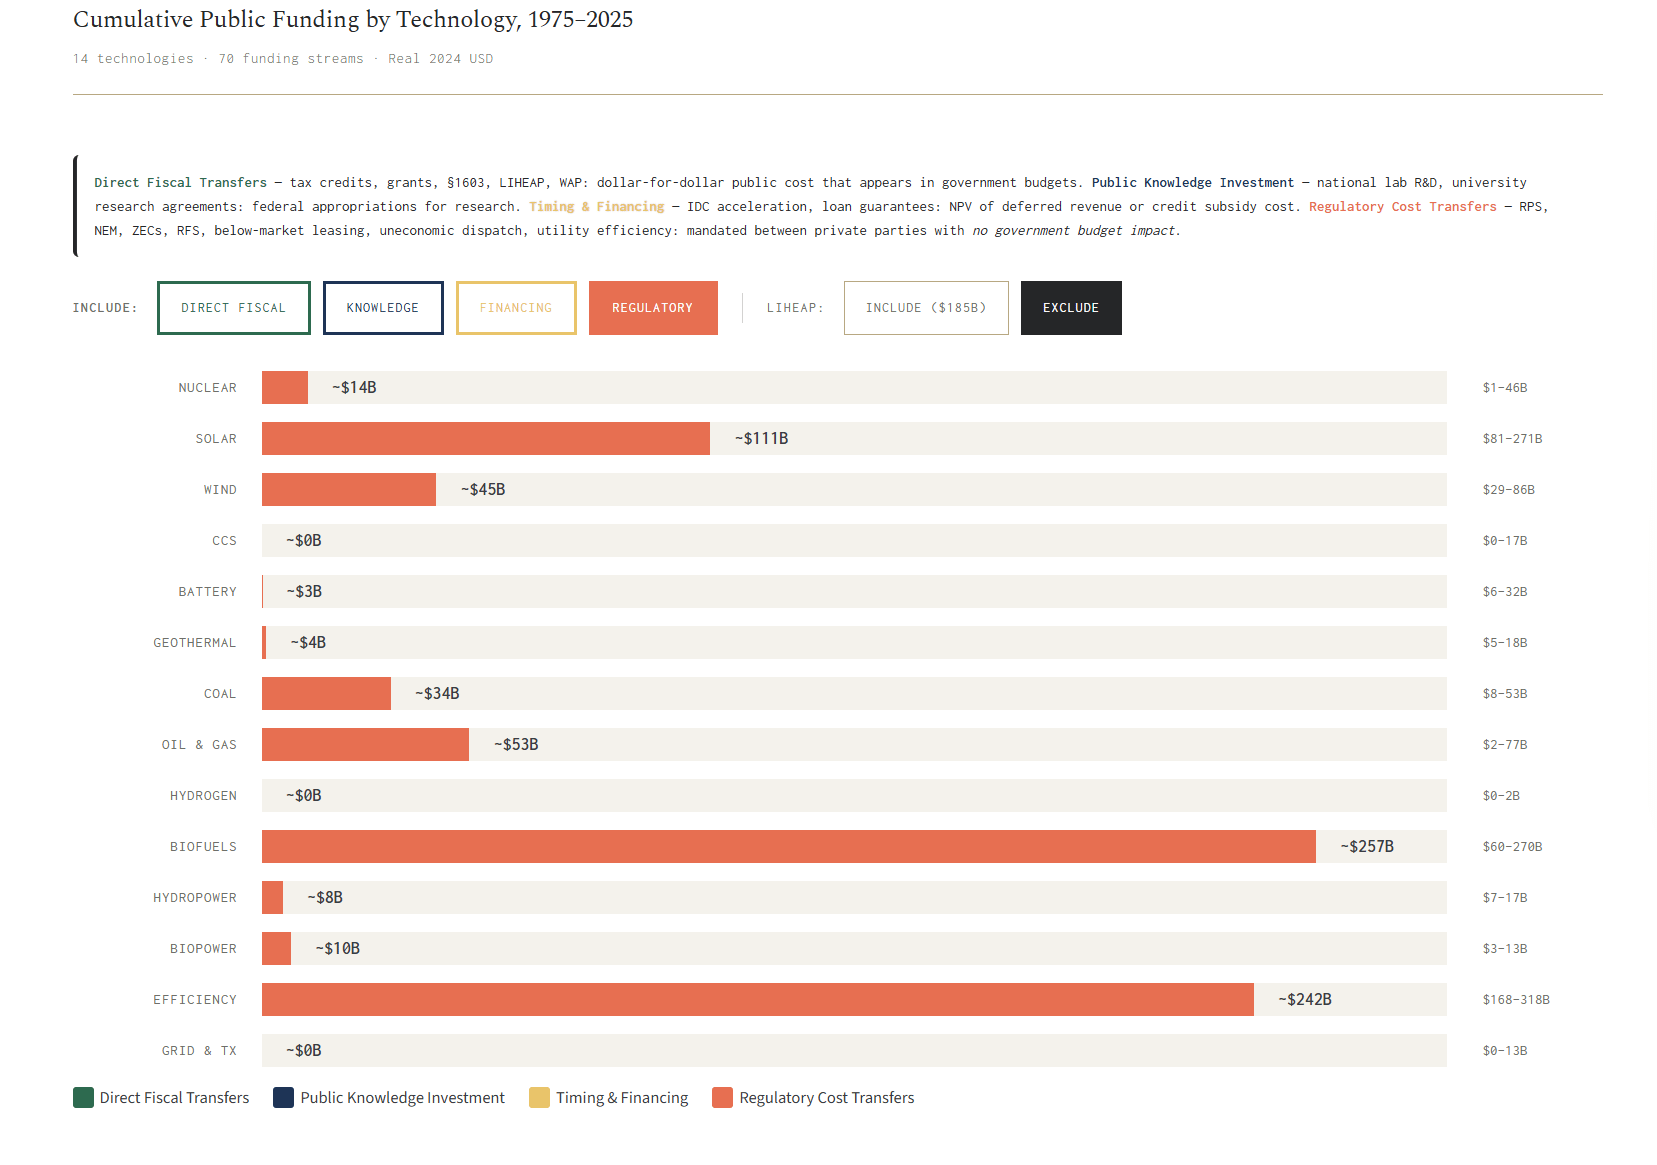
Regulatory Cost Transfers ($715 billion): RPS compliance costs, the Renewable Fuel Standard, net metering, utility efficiency mandates, below-market leasing, and uneconomic coal dispatch. These are mandated between private parties or represent foregone public revenue. They have either no government budget impact or a different one, such as forgone revenue. No congressional appropriation, no line item in any budget, no JCT score. But they are real costs borne by real people.
The dashboard lets you toggle each bucket on and off independently. The default view shows the first three buckets (roughly $832 billion with government budget impact) and excludes regulatory cost transfers. You can add them back with one click.
This is the section that matters most, and the one I expect will generate the most disagreement.
The $715 billion in regulatory cost transfers includes the six largest non-budget funding streams in the dataset: the Renewable Fuel Standard ($233 billion), utility ratepayer efficiency programs ($189 billion), RPS compliance costs ($103 billion), net metering ($62 billion), below-market federal leasing ($65 billion across oil and gas and coal), and uneconomic coal dispatch ($22 billion). Together, these six streams are larger than the entire federal tax credit category.
None of them involves direct government spending. The RFS mandates that refiners blend renewable fuels or purchase RIN credits from those who do. RPS mandates require utilities to procure renewable electricity or buy RECs. Net metering requires utilities to compensate distributed solar at retail rates. Utility efficiency programs are funded by per-kWh surcharges on customer bills. Below-market leasing means the federal government charges less for publicly owned resources than the market would bear. Uneconomic dispatch means regulated utilities run coal plants when cheaper alternatives are available and pass the cost to ratepayers.
In every case, the cost is borne by energy consumers, fuel purchasers, or the public treasury (through foregone revenue). By way of policy or regulation, either ratepayers or taxpayers are bearing the cost. The costs show up in electricity bills, fuel prices, and government balance sheets. But they are not public funding in the way that a tax credit or a research grant is public funding. They are not direct transfers or knowledge generation.
This is where the energy policy debate gets contentious, and where I want to be transparent about the choices I made.
The case for: EIA explicitly acknowledges excluding these programs from its subsidy reports, and notes that “state and local programs, although significant in several cases” are outside its scope. The RFS alone transfers more value annually than the entire federal renewable energy tax credit portfolio. Excluding $715 billion in costs can be justified, but doesn’t fully capture the cost of what the public is funding across energy sources.
The case against: Industry groups on both sides of the energy debate will object. The ethanol industry argues that RFS compliance costs are near zero because ethanol is cost-competitive at the blend wall. Solar advocates argue that NEM is fair compensation for grid services, not a cost transfer. Oil and gas groups argue that below-market leasing is a deliberate policy choice, not a subsidy. And nearly everyone argues that using an expansive definition of “public funding” inflates the total and confuses the public debate.
My approach: Include everything, label everything, and give the reader the tools to make their own judgment. The toggle is not a cop-out. It is a design choice that reflects the genuine ambiguity in this data. A dollar of LIHEAP came from congressional appropriations. A dollar of RFS compliance came from fuel consumers. Both are real costs directed at energy outcomes, but through fundamentally different channels. The dashboard shows both, explains the difference, and lets you decide what to count.
I will note that this is also why the default view excludes the regulatory bucket. I want the first thing you see to be the most defensible, most conservative number. If you want the full picture, it is one click away.
Version two was cross-validated against five external benchmarks:
EIA’s FY2022 federal subsidy report: our solar and wind figures match at 1.04 and 1.05 ratios, respectively.
AFPM’s RFS compliance cost estimate for 2021: 0.94 ratio.
Cullenward’s LCFS analysis through 2023: exact match (calibrated).
ACEEE’s 2023 utility efficiency spending: exact match (anchored).
CRS R&D allocation shares: within 5 percentage points across all categories.
Where we diverge from other analyses, it is generally because we include state-level programs that those analyses exclude by design. The TPPF “Siren Song“ report, for example, shows wind at $65 billion for 2010 through 2023 versus our $44 billion for the same period. The difference is methodological. We use a narrower definition of what constitutes a wind-specific tax expenditure and exclude items that TPPF includes as renewable subsidies.
The dashboard is retrospective. It covers 1975 through 2025 using actual data and does not include IRA projections. The IRA created large, uncapped, demand-driven tax credits whose future cost depends on deployment rates, Treasury rulemaking, and FEOC enforcement. JCT, Treasury, Goldman Sachs, and Princeton REPEAT have published projections ranging from $180 billion to $1.2 trillion over 2023 through 2032. When IRS publishes actual claims data for FY2023 and beyond, I will incorporate them.
The 1975 start date means we miss pre-1975 oil and gas tax expenditures (roughly $300 billion or more per Pfund and Healey), Atomic Energy Commission R&D, and Bureau of Reclamation dam construction. These are acknowledged in the methodology.
Tax abatements or severance taxes for all technologies are currently not included. That data is either impossible to get or scattered across state, county and local databases. I need to get all available data across all the affected technologies before I feel comfortable including them. But the impact would be in the tens of billions.
Approximately 86% of the dollar-weighted values in the dashboard are anchored to government or institutional source data. The principal estimates without direct government sourcing are net metering ($30 to $65 billion, LOW confidence) and state clean energy fund surcharges ($53 billion, now MID confidence after validation against NYSERDA, NJ BPU, and CT Green Bank data).
I’m thinking about what other data could be included. There is a real question about whether capacity markets should be in the data set under regulatory cost transfers or cap and trade programs. They are consistent with the methodological approach, but teasing out the public funding on each energy resource is more challenging for some of those programs. It also begs the question, what is “public funding” and pushes the bounds of being a value-neutral exercise. For example, you could argue that capacity markets create reliability and resiliency for the grid, and those are good things. However, Texas doesn’t have a capacity market and functions relatively well. So the inclusion or exclusion of capacity markets gets to the heart of “value”.
I’m also going to embark on some analysis on what the public has received from the funding. To start, I’ll look at the CCS bucket, and pick apart what funding streams have been utilized, and begin to explain why we have seen the relative success (or lack thereof) of CCS deployment in the United States.
The dashboard and source data remain free and open. The downloadable spreadsheet includes 70 streams with 51 years of annual data each, source citations, and confidence ratings. If you find an error, I want to know. If you find a better data source, I want to know that too.
Explore the dashboard here
No posts
Comments
Nothing yet. Say the first thing.
Sign in to join the conversation.