
We recommend starting with the intro in Part 1 of this series.
When we look at EC and TA per individual soil–feedstock combination, the dataset gets more honest. Some variations show a tight EC–TA relationship. Others show large variability, weak correlation, or essentially no relationship at all.
To evaluate whether EC tracks the treatment effect (TA increases relative to control), we computed Pearson r for each treatment pooled with its control. The logic is: we’re not just asking whether a soil has an EC–TA relationship, but whether the feedstock shifts the chemistry in a way that EC captures reliably.
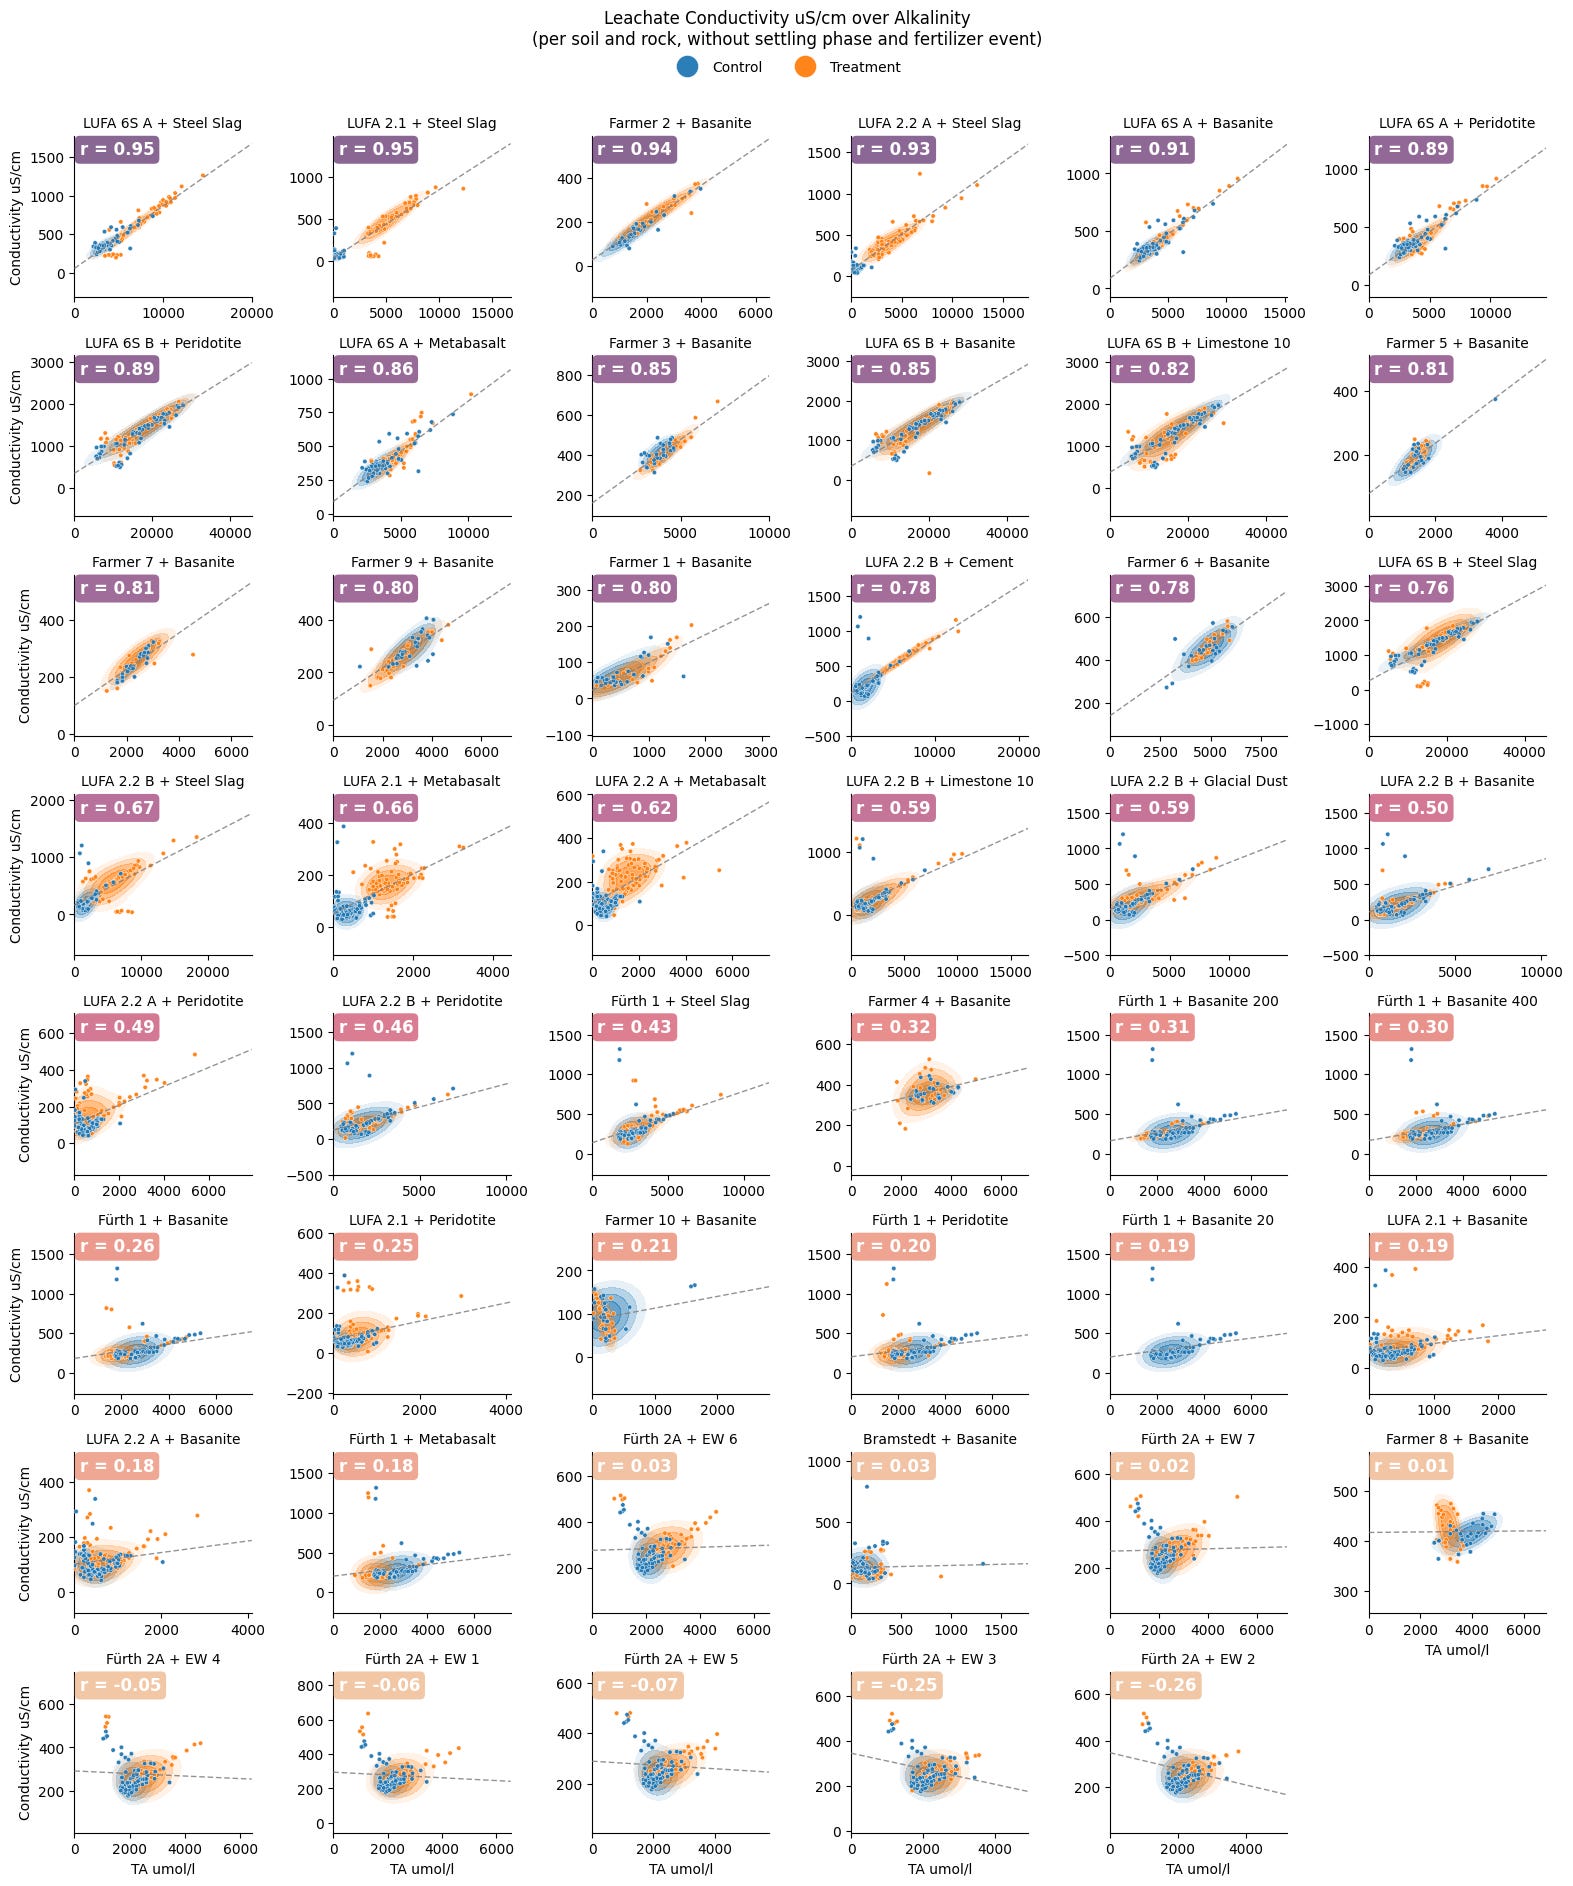
Figure 7: EC vs TA plots by treatment (with linear regressions), excluding settling phase and fertilizer event. Many treatments show strong EC–TA correlations (r > 0.7), but several show weak correlations.
When looking at these plots, we made an observation that matters for MRV: All variations with low EC–TA correlation generally do not show signs of weathering or show very slow weathering — meaning there is no significant TA increase of treatment over control.
Whenever the formation of weathering products differentiates the treatment from the control (more cations and TA in leachate), r-values increase. Without that differentiation, the analysis becomes dominated by measurement noise and intra-replicate differences.
In 29 out of 47 combinations, the EC–TA r value is below 0.7. Across three quarters of soil treatments, EC remained a robust proxy across the tested feedstocks. But some soils showed inconsistent or poor correlations depending on feedstock (examples highlighted in the document include Bramstedt, Farmer 10, Farmer 4, Farmer 8 — especially with basanite).
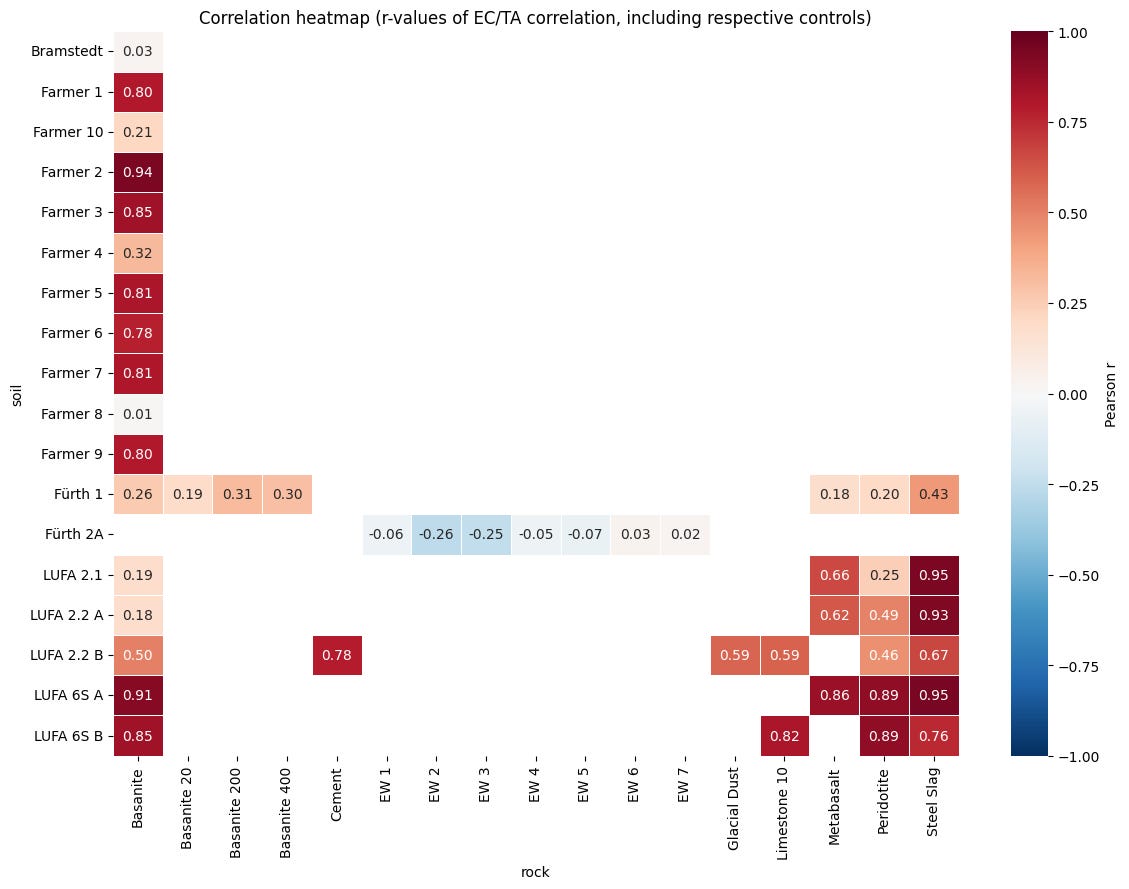
Figure 8: Heatmap of Pearson r for EC–TA by treatment (excluding settling phase and fertilizer event). Many treatments show r > 0.7, but several are weak.
Highly reactive steel slag showed consistently high EC–TA correlations across all 6 soils types where it was tested. Limestone was combined with 2 soils and showed r above 0.59 and 0.82. Less reactive silicate feedstocks showed mixed results. Basanite — the most frequently used feedstock in this experiment (17 soils) — ranged from essentially no correlation (r = 0.01) to very strong correlation (r = 0.95).
This is a practical MRV insight: proxies become easier when the signal is strong.
The micro-scale breakdown was not unique to EC. Ca²⁺ and Mg²⁺ proxies also lost coherence with TA in specific soil–feedstock combinations.
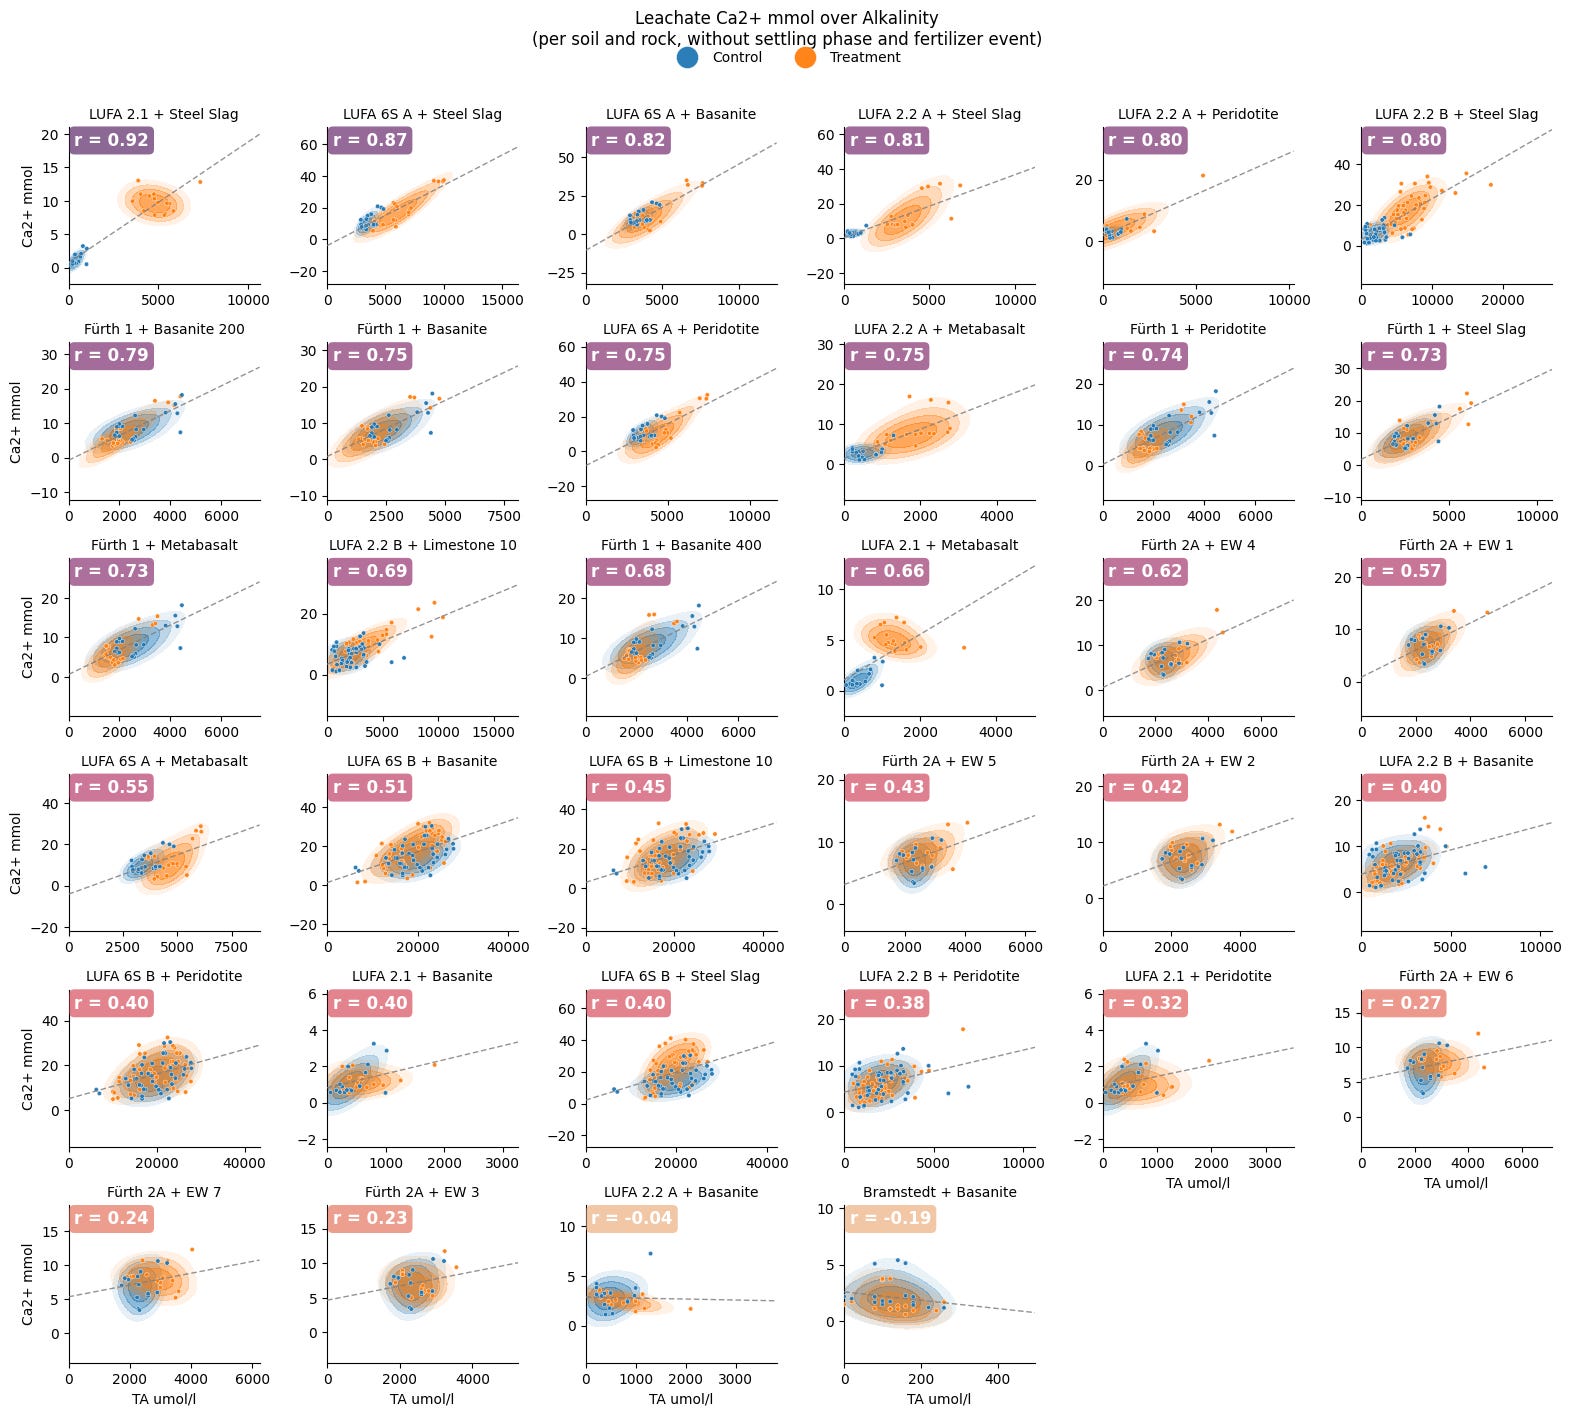
Figure A2: Ca²⁺ vs TA by soil/feedstock combination (Pearson r and scatter). Strong macro coupling often weakens at micro-scale.
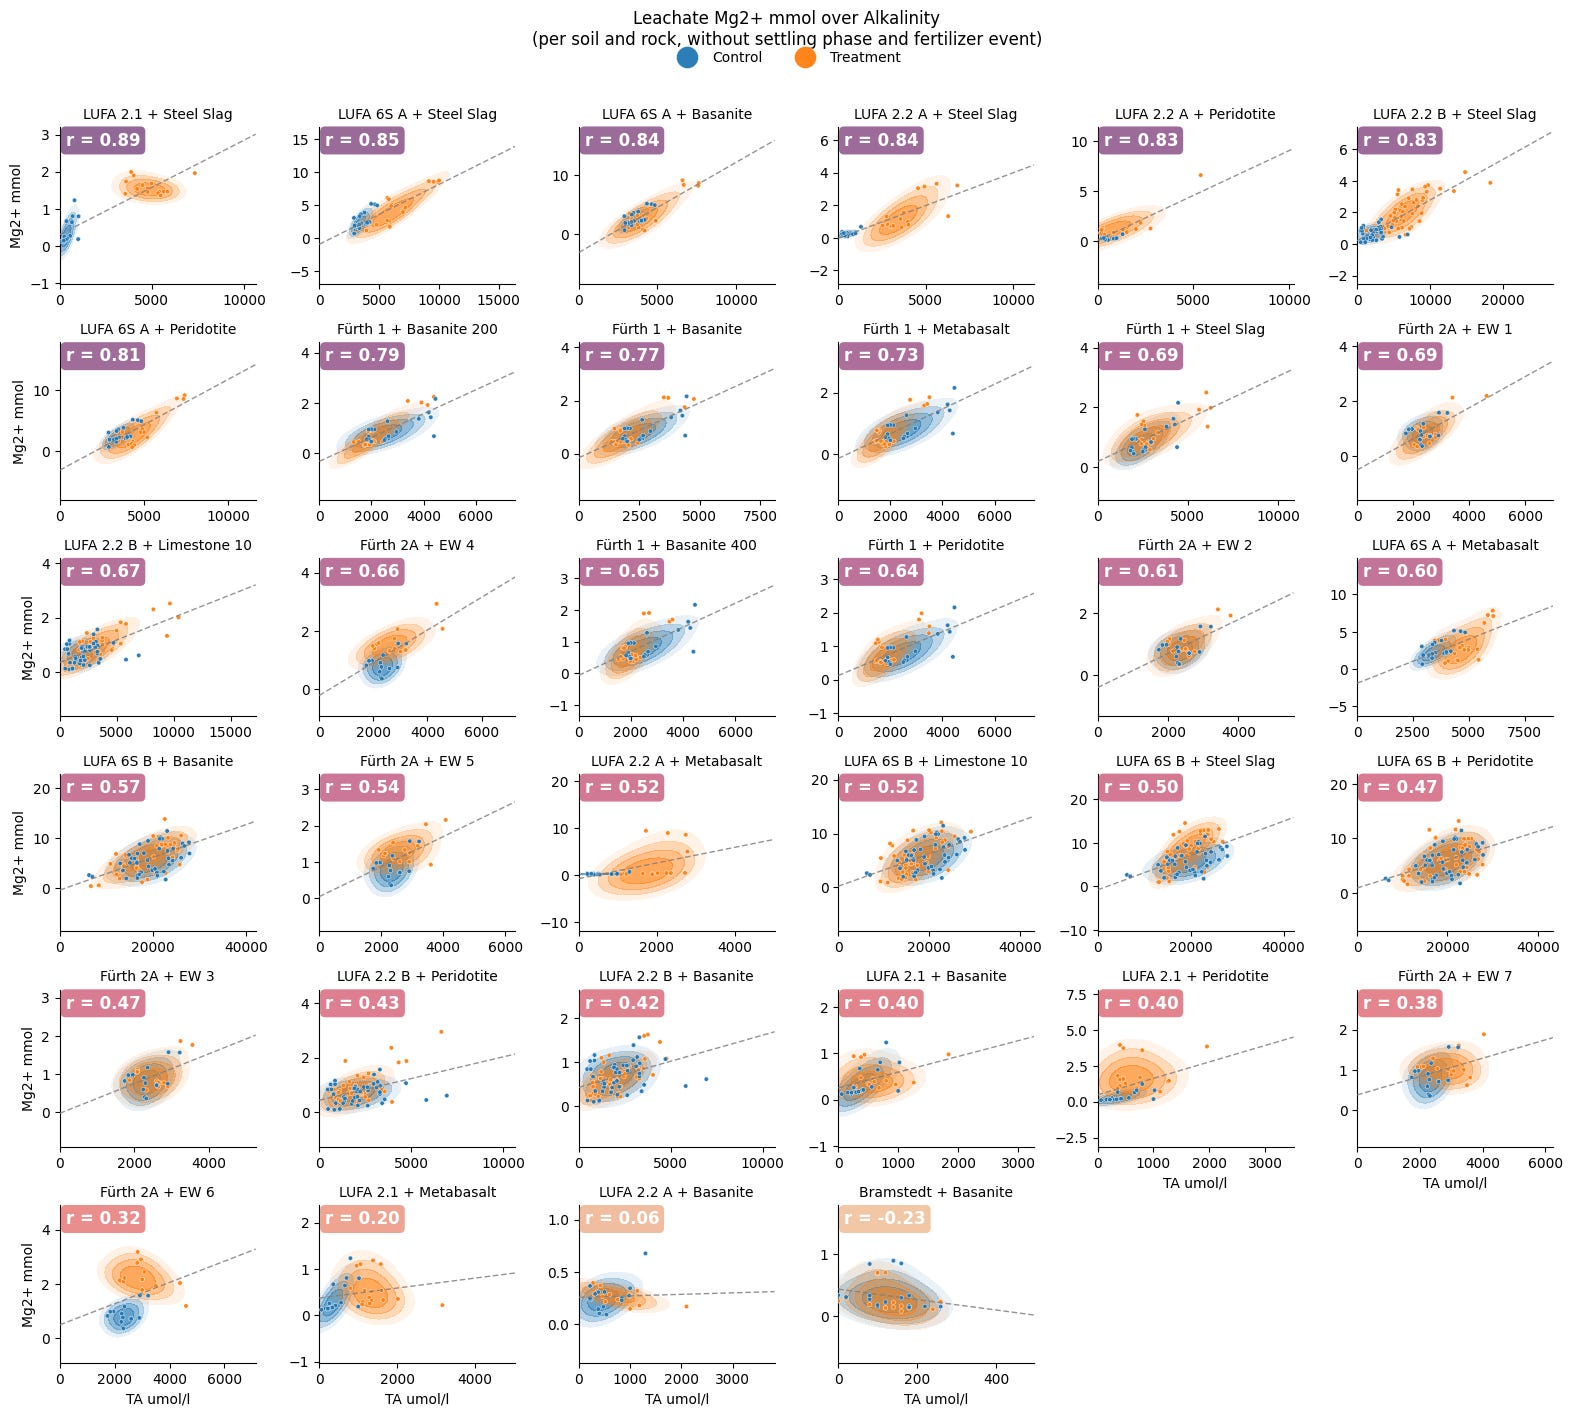
Figure A3: Mg²⁺ vs TA by soil/feedstock combination (same format). Similar micro-scale weakening.
This reinforces a key MRV reality: even chemically “obvious” proxies can be distorted by soil processes (retention, exchange, secondary reactions). In other words: calibration is not optional.
Figure 9 makes this link explicit:
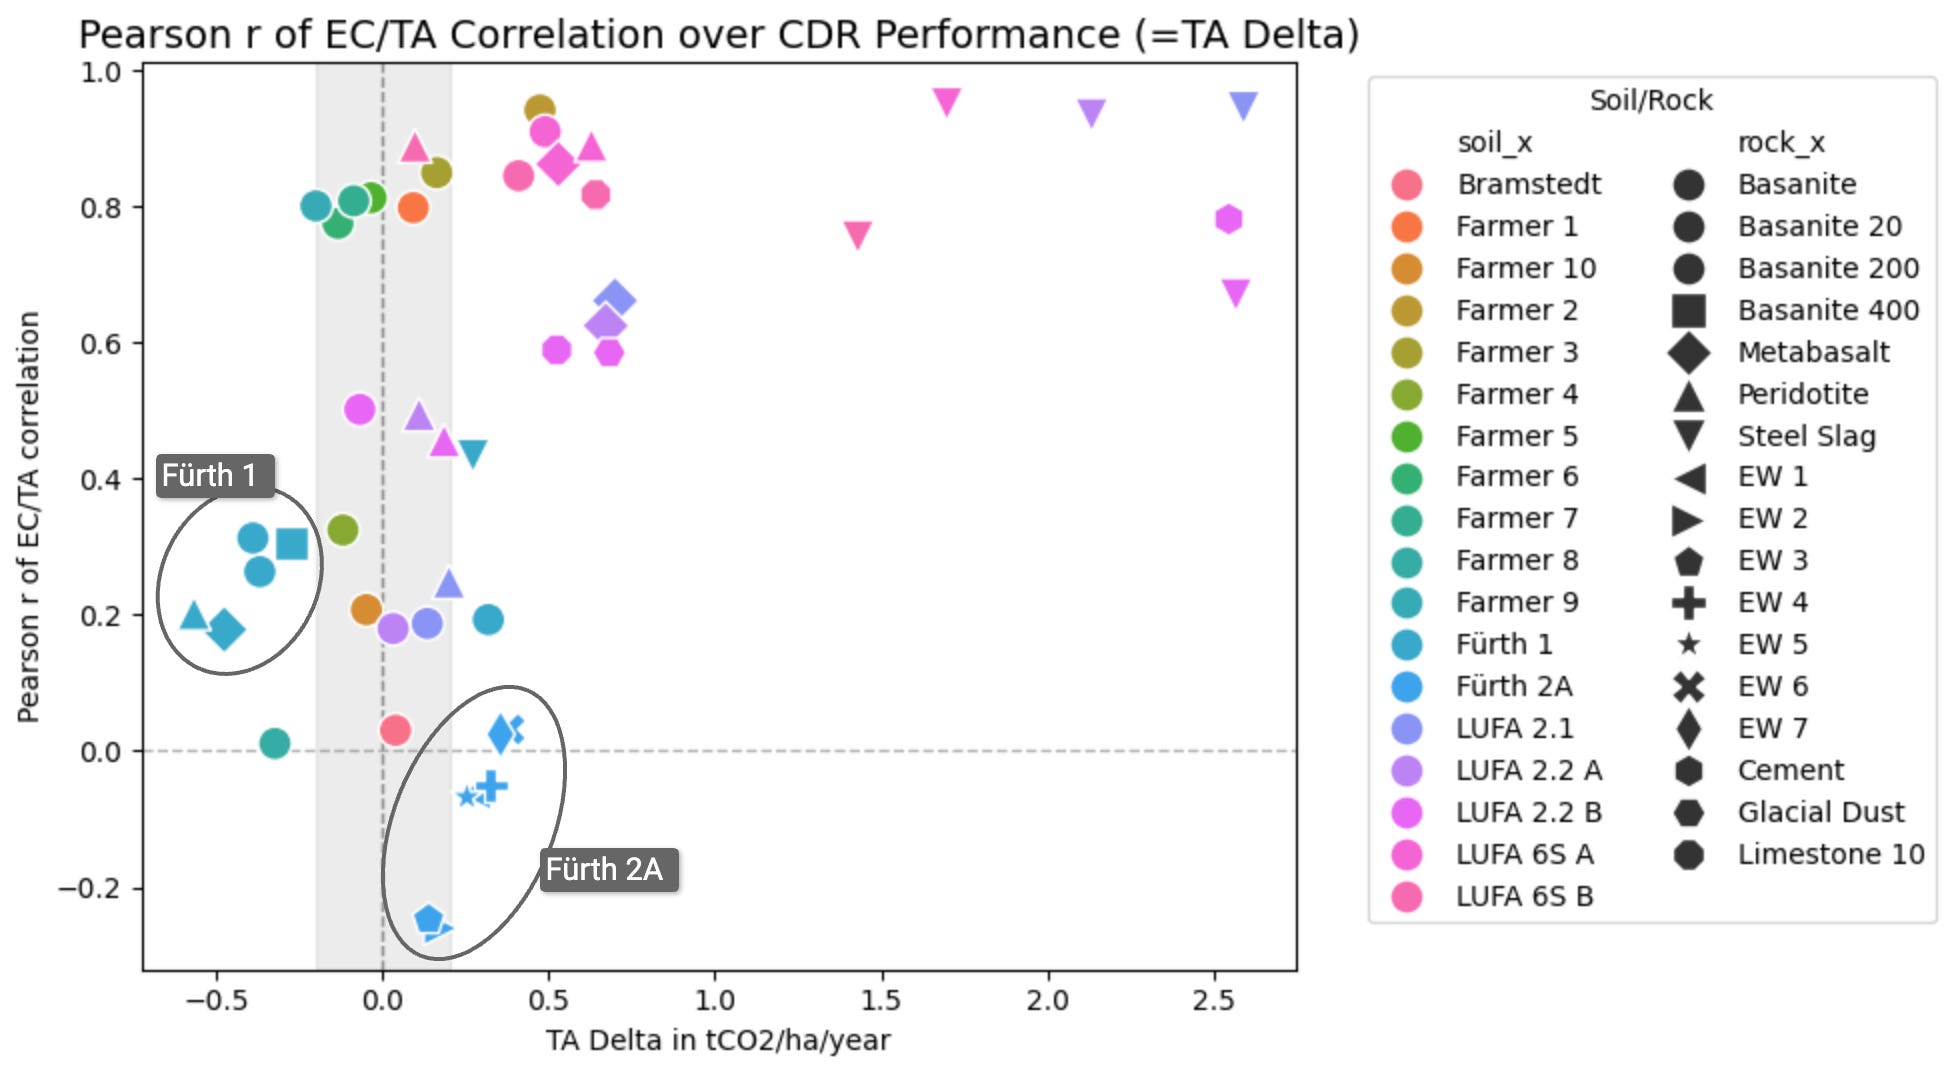
Figure 9: Pearson r of EC–TA correlation vs CDR performance (ΔTA of treatment over control, tCO₂/ha/year). Gray area indicates 95% CI uncertainty of TA data.
In our experiments, a significantly positive CDR performance (TA > 0.2 tCO₂/ha/year) almost always comes with a good (r > 0.7) or very good (r > 0.8) EC–TA correlation. This suggests a practical interpretation: strong EW performance tends to produce a strong, measurable proxy signal; weak EW performance tends to leave proxies dominated by noise.
Macro correlations are useful, but MRV happens at the site level. The micro-scale results show that EC can be a reliable TA proxy in many cases — but not universally.
A practical project implication is: you need an initial period with enough TA measurements to establish the EC–TA relationship for that specific soil/feedstock/crop/climate/management combination. Then you need continued checks because the relationship can shift with disturbances or evolving soil processes.
Next up: Part 8 — Substituting TA measurements with EC measurements
Download the full PDF companion report (PDF, 4 MB, DOI https://doi.org/10.13140/RG.2.2.23232.39688) which is the reference backbone for the series. The data is available on Github https://github.com/dirkpaessler/carbdown_greenhouse_2023_2024 and via DOI https://doi.org/10.5281/zenodo.18360183.
No posts
Comments
Nothing yet. Say the first thing.
Sign in to join the conversation.