
Good morning - here are some comments from today’s Opening Look note.
Also, check out my CNBC segment from (very) early this morning. We discussed SPX, bonds, retail, and seasonality.
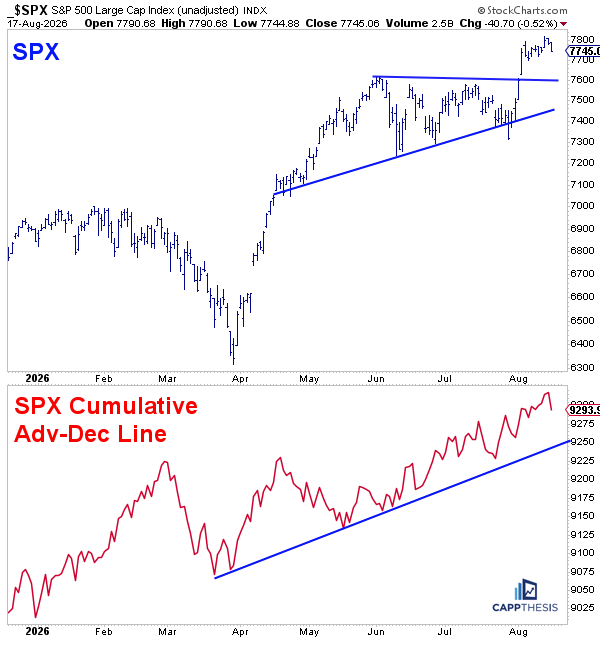
The SPX’s recent breakout to new all-time highs has kept the bigger-picture trend firmly intact. But after one of its strongest four-day moves in years, the market has started to pause, and a few indicators are worth watching more closely.
Two stand out right now: market breadth and MACD momentum.
Neither is flashing a definitive warning yet. But if both begin to deteriorate at the same time price starts breaking down, the message would become much more important.
As we know, strong breadth has been one of the most important drivers of the market all summer.
It helped the SPX stay near its highs in June and July while Technology came under pressure. Instead of weakness in the largest growth stocks dragging everything lower, strength underneath the surface helped keep the broader market afloat.
More recently, that participation supported the SPX’s breakout to new all-time highs.
That remains an important positive.
In fact, both the S&P 500 and the cumulative advance-decline line made new highs last week. When price and breadth are confirming each other in that fashion, it is difficult to argue that there is a major breadth problem.
At least not yet.
Yesterday, however, provided something different. Just 26% of S&P 500 stocks advanced, the weakest breadth reading since July 8, when only 22% rose.
One bad breadth day by itself isn’t enough to change the trend. We’ve seen plenty of sharp one-day reversals during this advance that ultimately proved temporary.
But if yesterday’s action proves to be more than a one-day blip, it would represent a meaningful change in character.
That becomes especially important because the SPX is currently working through several bullish pattern breakouts. Strong breadth has helped support those moves. If participation begins to deteriorate while those patterns start failing, the technical backdrop would look considerably less constructive.
For now, breadth deserves the benefit of the doubt. The next few sessions should tell us whether yesterday was simply noise—or the start of something more meaningful.
The second development to monitor is the SPX’s daily MACD indicator.
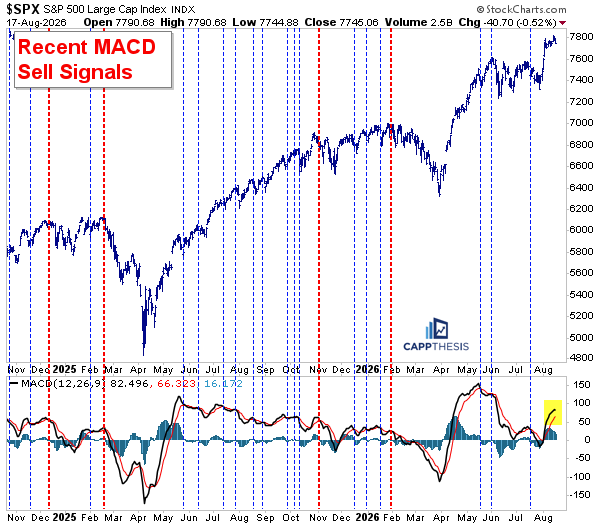
Looking back at all of the MACD Sell signals since the fall of 2024, the track record has been mixed. The red lines on the accompanying chart highlight signals that correctly preceded meaningful weakness, while the blue lines show the head fakes when the market simply continued higher.
The takeaway is pretty clear:
There have been far more head fakes than reliable sell signals.
Since the comeback earlier this year, three MACD Sell signals have triggered. None produced a major decline, with the market experiencing only modest pullbacks in June and again in late July.
Currently, we’re still a few days away from another potential signal, as highlighted in yellow.
Given that the SPX is at higher levels and recently logged one of its strongest four-day moves in years, some momentum deterioration wouldn’t be surprising. Markets rarely move straight up, and the recent pause could eventually be enough to produce another MACD Sell signal.
But the signal itself won’t be the most important development.
As always, confirmation from price matters more than the indicator itself.
If another MACD Sell signal triggers while the SPX’s bullish patterns remain intact, breadth stabilizes and price holds above the recent breakout zones, history suggests there would be little reason to overreact.
On the other hand, if breadth continues to weaken and the three bullish patterns discussed above begin to fail, the same MACD Sell signal would carry considerably more weight.
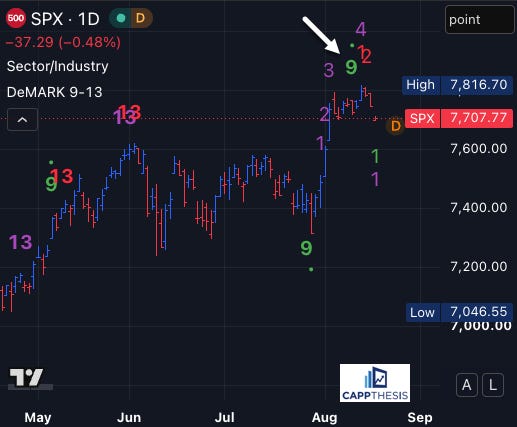
It also would line up with the recent DeMARK Setup 9 Sell signal, which thus far has yet to produce meaningful downside.
That’s why the next several sessions are important. We don’t have a confirmed bearish shift yet. But we do have several potential warning signs beginning to line up.
Price, breadth and momentum remain the key combination to watch - in that order. If all three start deteriorating together, the message will be much harder to ignore.
CappNotes offers a small window into the work we do at CappThesis - a technical analysis newsletter company focused on classical chart patterns, trend, and risk management. Explore the full range of CappThesis services here:
No posts
Comments
Nothing yet. Say the first thing.
Sign in to join the conversation.