
Happy Hump Day.
Here’s a piece highlighting some of the charts and commentary we’ve been discussing at CappThesis regarding the S&P 500 and Gold.
Also check out my latest LinkedIn piece here.
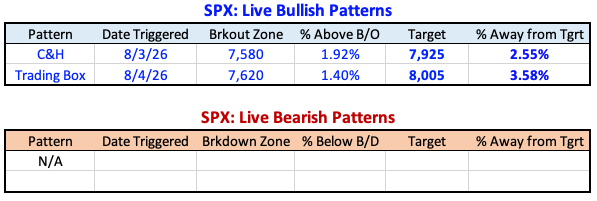
Coming into this week, the S&P 500 had two live bullish patterns in play after achieving the longer-term 7,680 objective:
The cup-and-handle breakout, which yielded an objective of 7,925
The trading box breakout, encompassing the entire trading range from June through early August, with a target of 8,005
As always, these are simply measured moves and derived target prices. They provide a roadmap, not a guarantee.
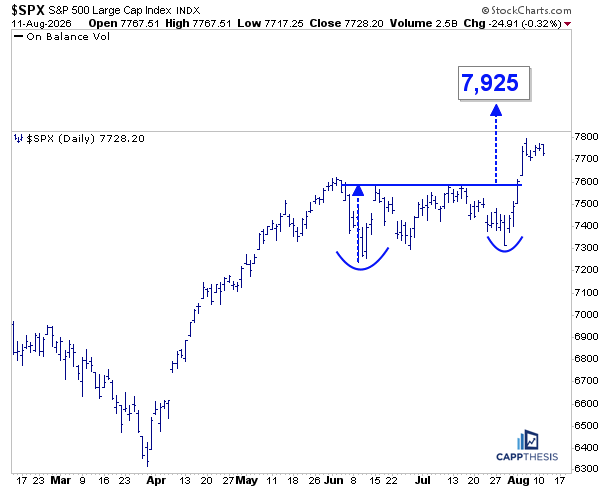
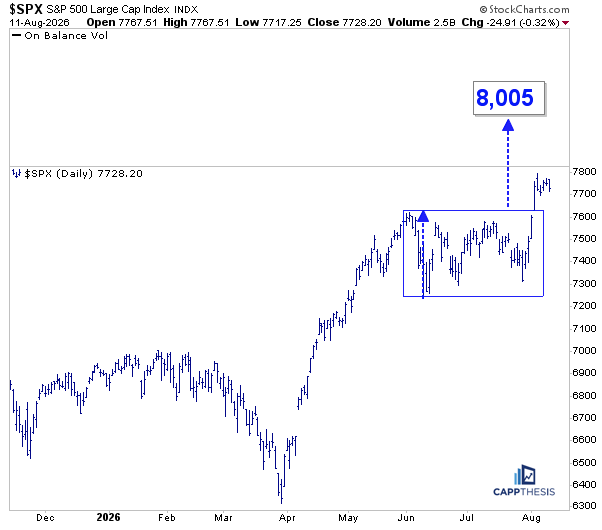
The pause over the last few days isn’t surprising given the strength of the preceding four-day advance, which included three gains of at least 1.5% in four sessions.
After a move like that, the hope is that some sort of digestive phase develops near the highs, eventually producing another bullish pattern.
So far, that may be happening.
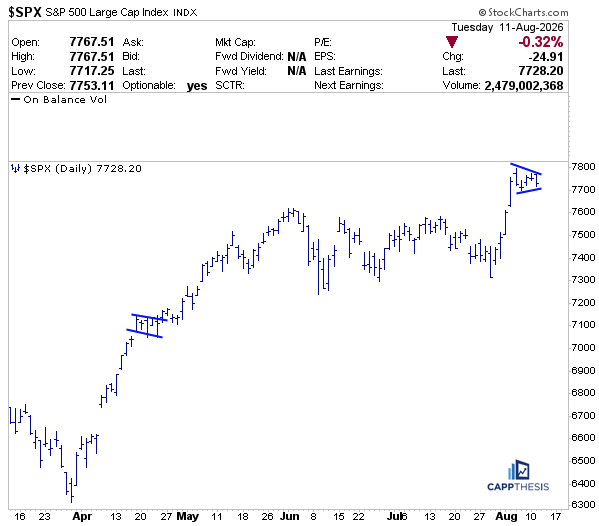
The recent consolidation has the early look of a potential pennant formation. It’s very small and short-term in nature, but that’s worth watching given what we’ve seen before.
Recall what happened in late April. The S&P 500 paused for just five days, formed a bullish flag, and then broke out. That was the formation that ultimately produced the 7,680 target.
We don’t take any of these patterns lightly. If another breakout occurs here, even from this relatively small formation, it could produce another substantially higher target.
At the same time, it’s important to understand how the market looks from a DeMark perspective.
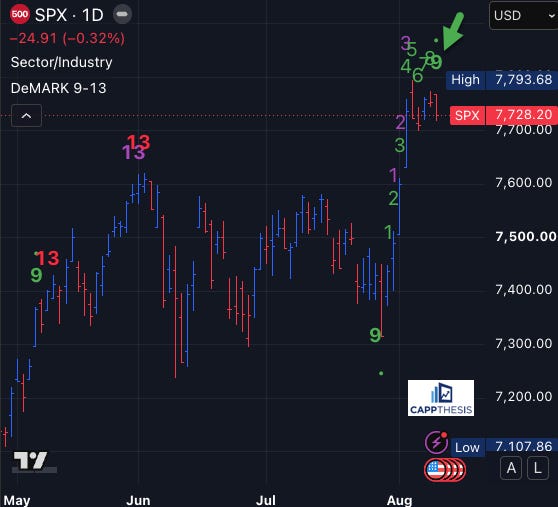
We’ve been tracking this closely with CappThesis clients over the last week, and following yesterday’s price action, the S&P 500 registered a DeMark Setup 9 signal.
Setup 9s can be helpful in identifying potential pauses after a market has become stretched. Interestingly, that’s exactly what happened following the previous two Setup 9 signals in April and May.
Neither led to meaningful downside. Instead, both were followed by a little more than a week of sideways action before the S&P 500 found another bid and continued higher.
That history is particularly relevant given the potential pennant now taking shape.
Whether you’re a trend follower or a mean-reversion trader, it’s important to keep both developments in mind because both ultimately can be right.
The S&P 500 may be forming another bullish continuation pattern. At the same time, the DeMark Setup 9 suggests the market could require more time to work off the short-term stretched conditions created by the recent advance.
If the current pennant doesn’t break out immediately, that doesn’t necessarily invalidate the bullish setup. It simply may need more time to develop into a larger consolidation pattern.
In other words, the next bullish pattern may already be forming—or the market may need a little more time before one becomes actionable.
Either way, the consolidation itself now becomes an important part of the roadmap.
Gold has continued to come back, which seems easy to see now. But we know that wasn’t the case for a long time.
For many months, I was asked about my opinion on gold, and there were three main reasons I was hesitant to get bullish:
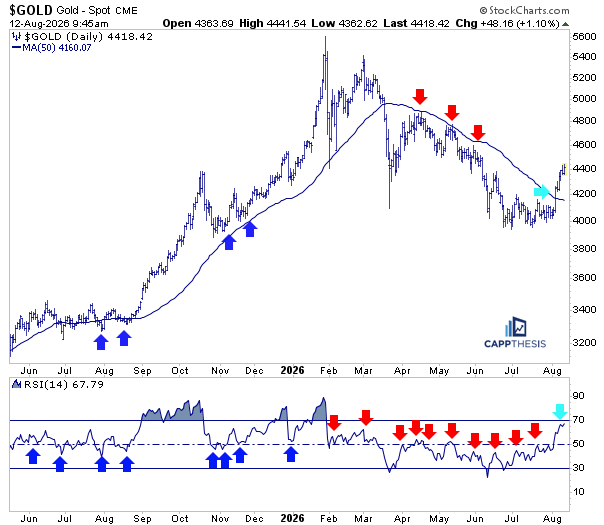
Gold continuously failed while its 50-day moving average was declining. This was a completely different scenario from what we saw on the way up. Going back to last summer, the pullbacks that did arrive consistently found support near a rising 50-day moving average. That helped the long consolidation through August eventually get leveraged, leading to one of the strongest uptrends we’ve seen through the beginning of this year.
RSI had struggled to get much above the 50 zone since February. As we know, when that occurs, it simply tells us that momentum remains weak.
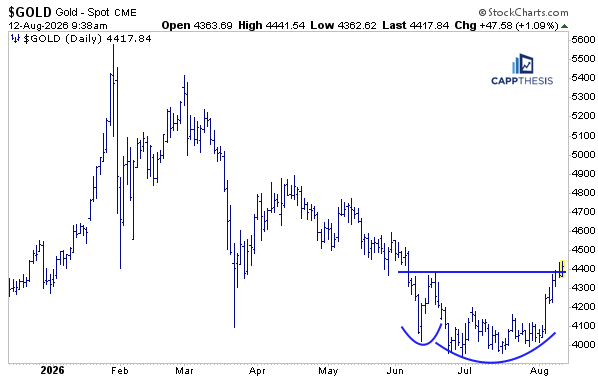
We had yet to see a bullish formation take shape, let alone get leveraged. That finally changed as well. Gold developed a symmetrical triangle-like pattern and broke higher from it. A basic measured move from that formation has already been achievedFrom there, we always talk about the advantage of seeing smaller bullish patterns form because they can eventually lead to larger foundations being leveraged.
Gold potentially has that scenario developing right now.
Where this current run ultimately stops will help determine what the next pattern looks like. But after the type of move we’ve seen over the last week, this is exactly the kind of scenario we want to monitor: a strong initial advance followed by a constructive pause that potentially creates another bullish setup.
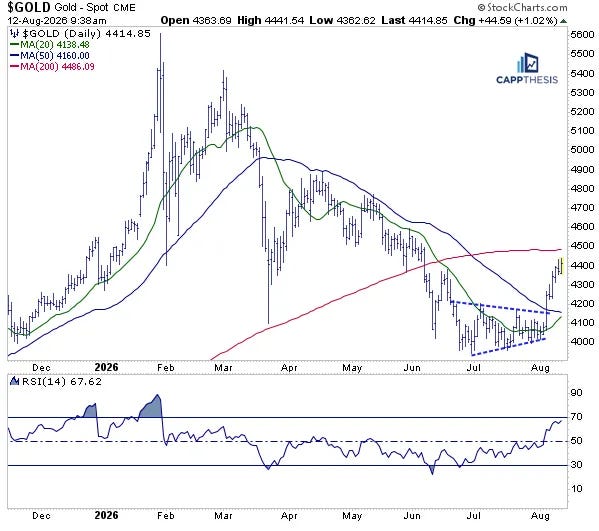
At the same time, the shorter-term trend continues to improve.
The 20-day moving average is now very close to overtaking the 50-day moving average, something that hasn’t occurred for a number of months. Gold also is getting closer to potentially testing its 200-day moving average.
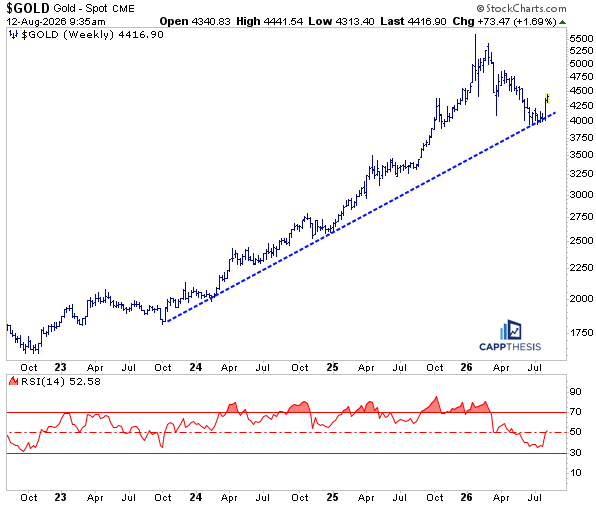
From a longer-term perspective, all of this occurred as gold tested its uptrend line on the logarithmic chart going back to the October 2023 low.
Gold had extended well beyond this trendline during its prior advance, meaning the line hadn’t really been a factor for the better part of a year and a half.
That changed during the recent pullback.
Even though gold didn’t produce a substantial bounce until the last week and a half, it continued to make marginally higher lows near that longer-term trendline. In other words, the primary uptrend remained intact even as the shorter-term technical picture deteriorated.
Lastly, we shouldn’t forget just how powerful the preceding rally was.
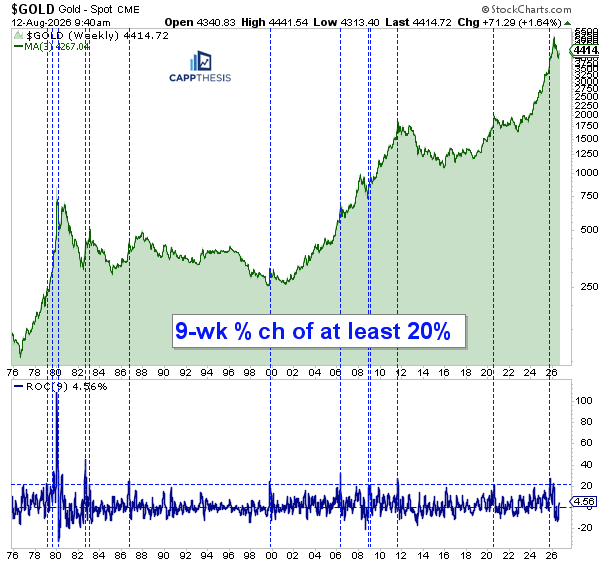
Over a nine-week period, gold gained more than 20%. Going back 50 years, moves of that magnitude over such a short period have been very rare.
Sometimes they occurred near marquee tops, including in 2011 and around the late 1970s and early 1980s. Other times, they simply represented a powerful leg within a longer-term uptrend. The most recent example of that occurred in 2020.
With that context, it wasn’t particularly surprising that gold eventually needed to cool off following its parabolic advance to start the year.
The bigger question was what would happen after that reset.
Now, after months of weakness, several technical factors finally are beginning to line up across different time frames: momentum has improved, a bullish pattern has been leveraged, the moving-average structure is beginning to turn, and the longer-term uptrend remains intact.
That’s a much different technical backdrop than the one gold faced just a few weeks ago.
CappNotes offers a small window into the work we do at CappThesis - a technical analysis newsletter company focused on classical chart patterns, trend, and risk management. Explore the full range of CappThesis services here:
No posts
Comments
Nothing yet. Say the first thing.
Sign in to join the conversation.