
Happy Sunday,
Here are this week’s five best charts, presented just as they originally appeared in the daily notes. At the end, we’re discussing a recently closed chart trade that gained 24% in 9 trading days.
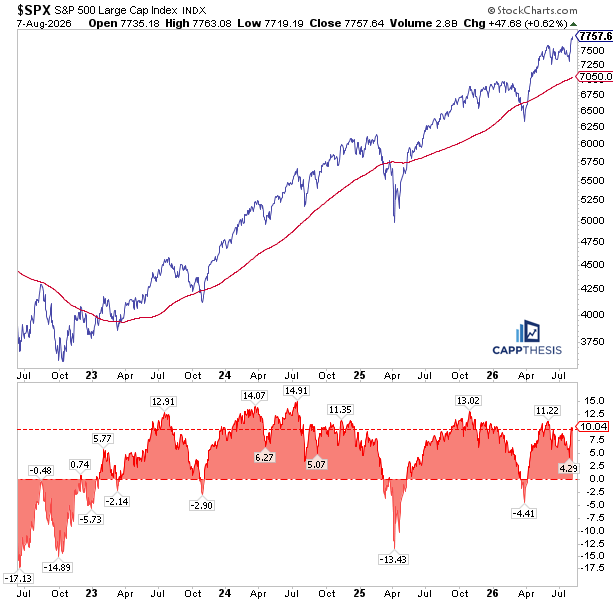
SPX vs. 200-DMA
The S&P finished last week 10% above its 200-day moving average, a level last seen in late May/early June, when the spread reached roughly 11%. Since the 2022 low, that gap has expanded toward 15% several times before eventually peaking.
More importantly, during the S&P’s strongest uptrends, it has shown an ability to remain 10% or more above its 200-day moving average while continuing to advance. Thus, reaching this threshold isn’t an outright sell signal.
The best-case scenario would be some short-term consolidation following last week’s surge, allowing the market to digest the move, regroup, and potentially continue higher.
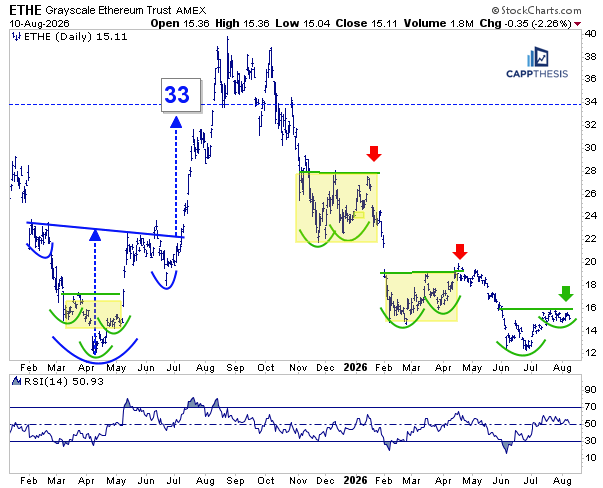
ETHE Ethereum
Overall, ETHE has been stuck over the last few weeks just below the 16 area, and we can see how important that level is from a pattern perspective: The ETF is now approaching its third bullish breakout attempt of 2026. As the red arrows show, the prior two failed, with significant weakness following soon thereafter.
That contrasts sharply with the spring and summer of 2025. Back then, ETHE broke out from a small bullish pattern, reached its target, and helped establish the foundation for a much larger bullish formation. That subsequent June breakout produced substantial follow-through, with ETHE reaching its 33-target and continuing higher from there.
It’s another example of why, when attempting to reverse a major downtrend, simply bouncing isn’t enough. Constructing and successfully leveraging an identifiable bullish formation can provide the foundation for a much larger recovery to develop.
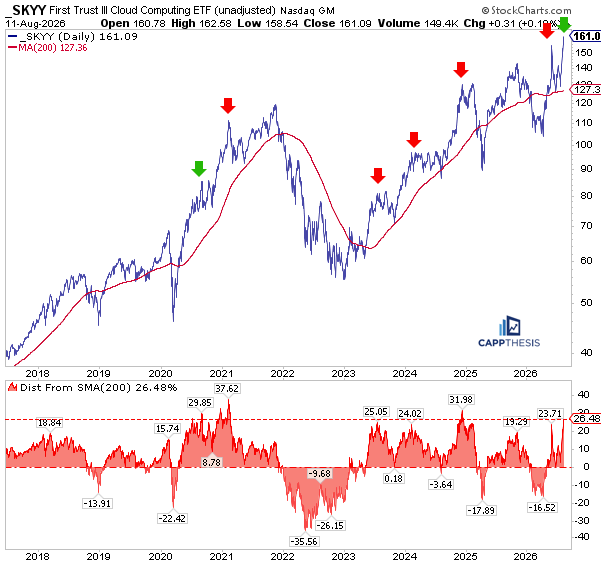
SKYY – Short-term Extended
SKYY has enjoyed a huge run over the last few weeks, gaining nearly 26% from its July 23 low through yesterday’s high and advancing in 12 of the last 13 sessions. Along the way, its 14-day RSI has surged from 37 to 76, putting the ETF firmly into overbought territory.
For context, SKYY rallied nearly 50% from its April 10 low through June 1 before suffering a roughly 20% pullback over the following four weeks. Thus, after another sharp run now, the question is whether it is again due for some consolidation.
The bottom panel adds to that concern. SKYY is now roughly 26% above its 200-day moving average, among its most extended readings since at least 2018. As the red arrows show, similar extremes typically were followed by some degree of mean reversion, whether through an outright pullback or several months of sideways digestion.
The major exception came during the powerful post-COVID advance in late 2020 (first green arrow). Otherwise, when SKYY has moved 20% or more above its 200-day, the gap eventually has narrowed considerably, making the current risk/reward increasingly stretched in the short term.
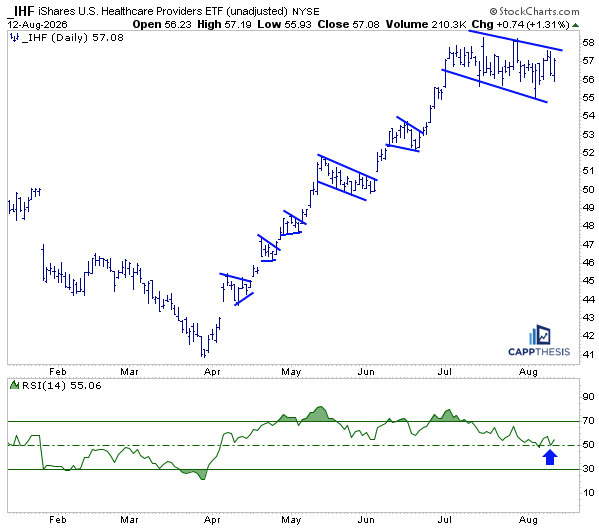
HF HC Providers
IHF, the Healthcare Providers ETF, gained 1.3% yesterday. This updated chart highlights how its comeback since late March has been defined by a series of bullish continuation patterns, each of which was eventually leveraged to the upside and helped build the current uptrend.
We highlighted this phenomenon again in early July. This time, however, the consolidation has lasted longer, creating the largest and longest trading range since the comeback began. Whether we classify it as a trading channel or bullish flag, the setup remains constructive as long as IHF can eventually break higher.
The timing also is important from a momentum perspective. The 14-day RSI is once again trying to hold near 50, a level it has remained above since late March. Before the comeback began, that same 50 area consistently acted as resistance.
It’s another good example of how price and momentum can work together to define a trend—with the RSI’s 50 level shifting from resistance during the downtrend to support during the advance.
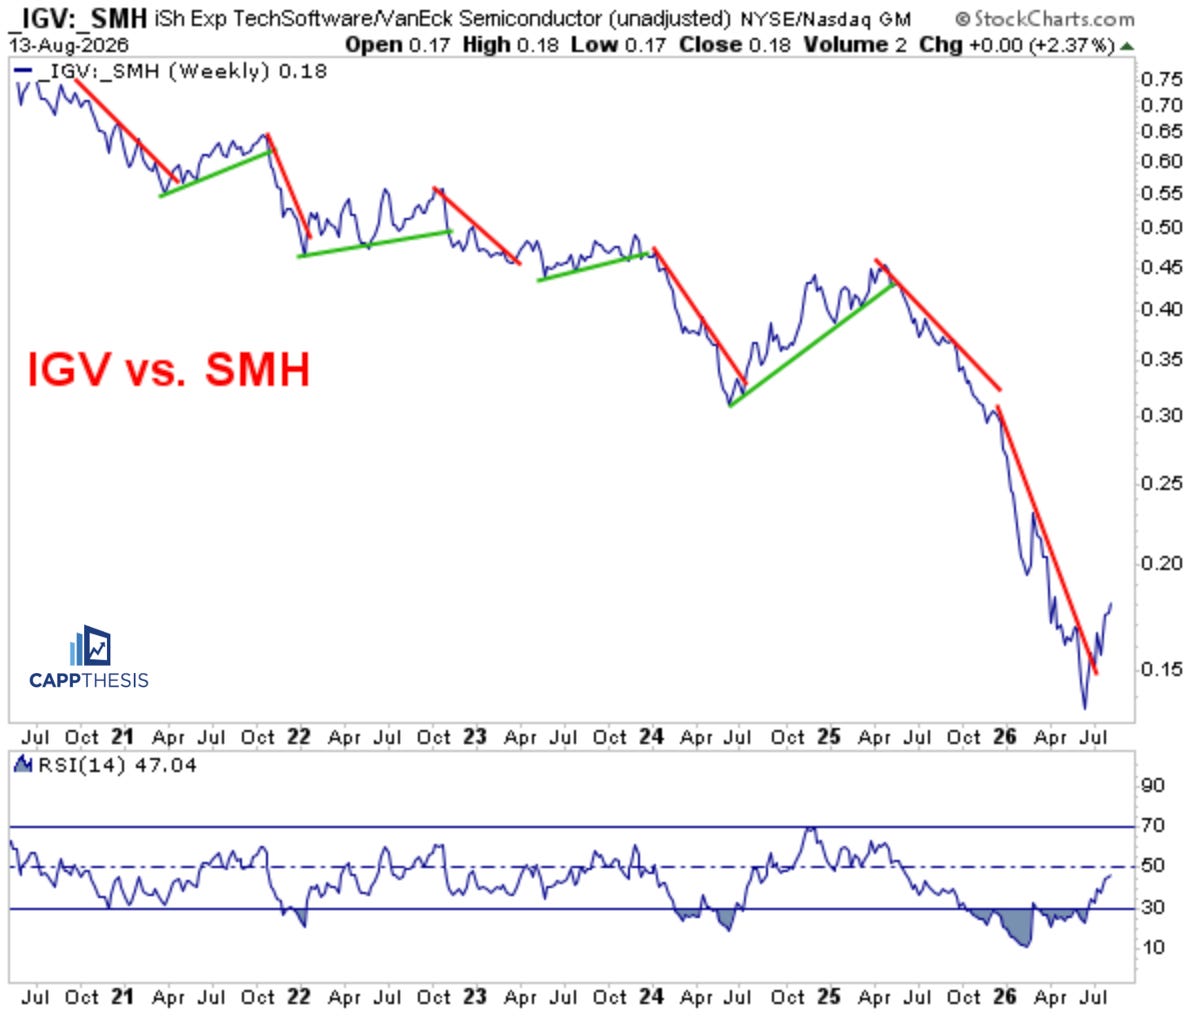
IGV vs. SMH
IGF also has finally started to leverage the extreme oversold condition vs. SMH. We can see how long this outperformance vs. SMH has lasted since 2021 when the IGV/SMH ratio broke through major downtrend lines.
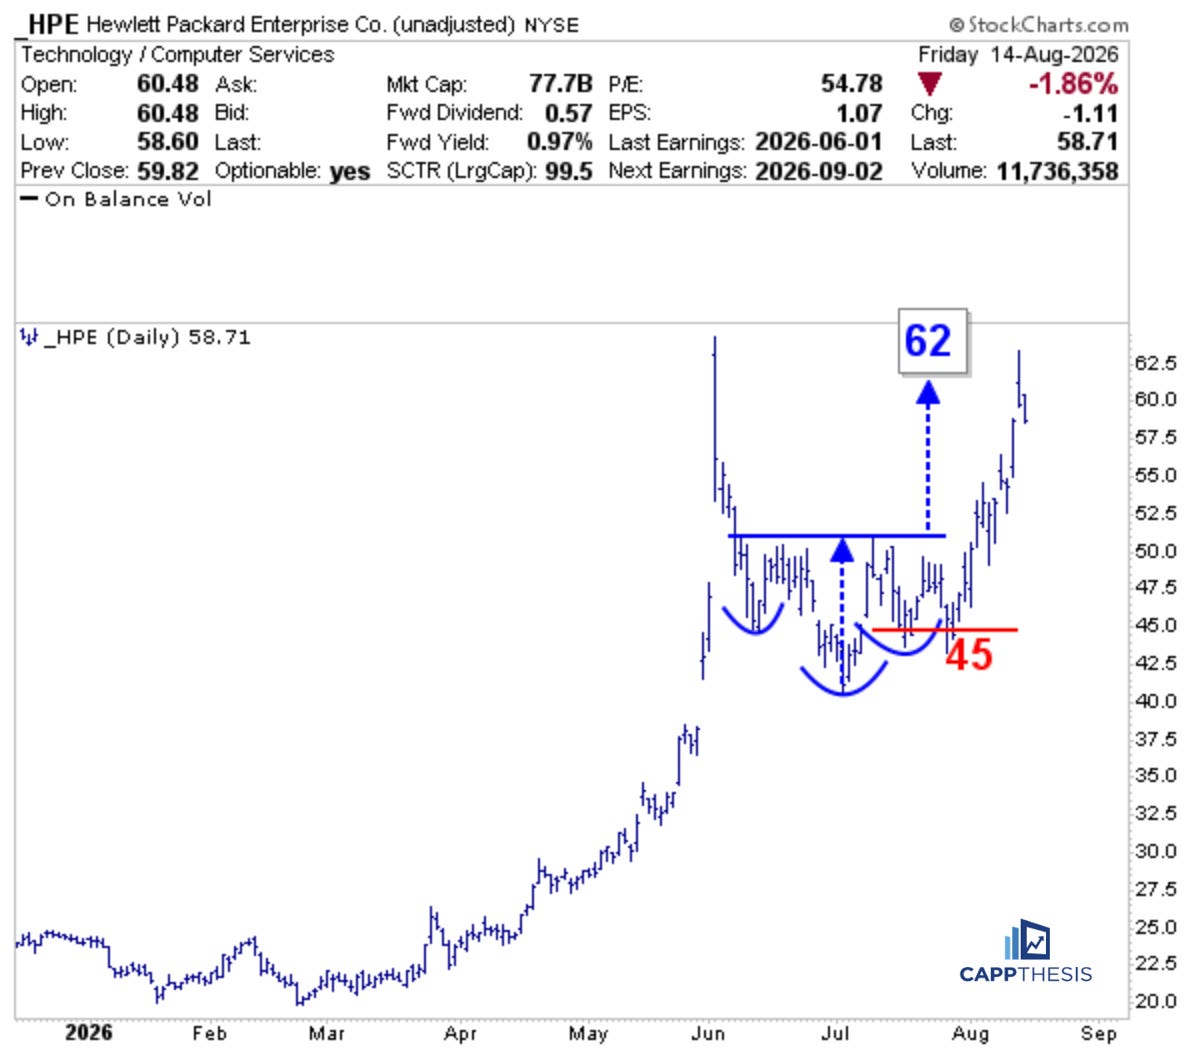
8/3/26 - Bought at 50
8/13/26 - Sold 62 target price
HPE has been on a wild ride this year. After rallying more than 220% and culminating in the parabolic spike, the stock reversed sharply, falling nearly 40% from its peak. Since bottoming in early July, however, it has staged a healthy rebound, carving out a potential inverse head and shoulders pattern.
Given how quickly momentum can appear, a breakout in HPE soon could attract additional buying interest. If that happens again soon with a move through the 50-zone, the upside target would be up near 62. We’re looking to establish a position slightly ahead of the breakout near 50.
The suggested stop-loss is near 45.
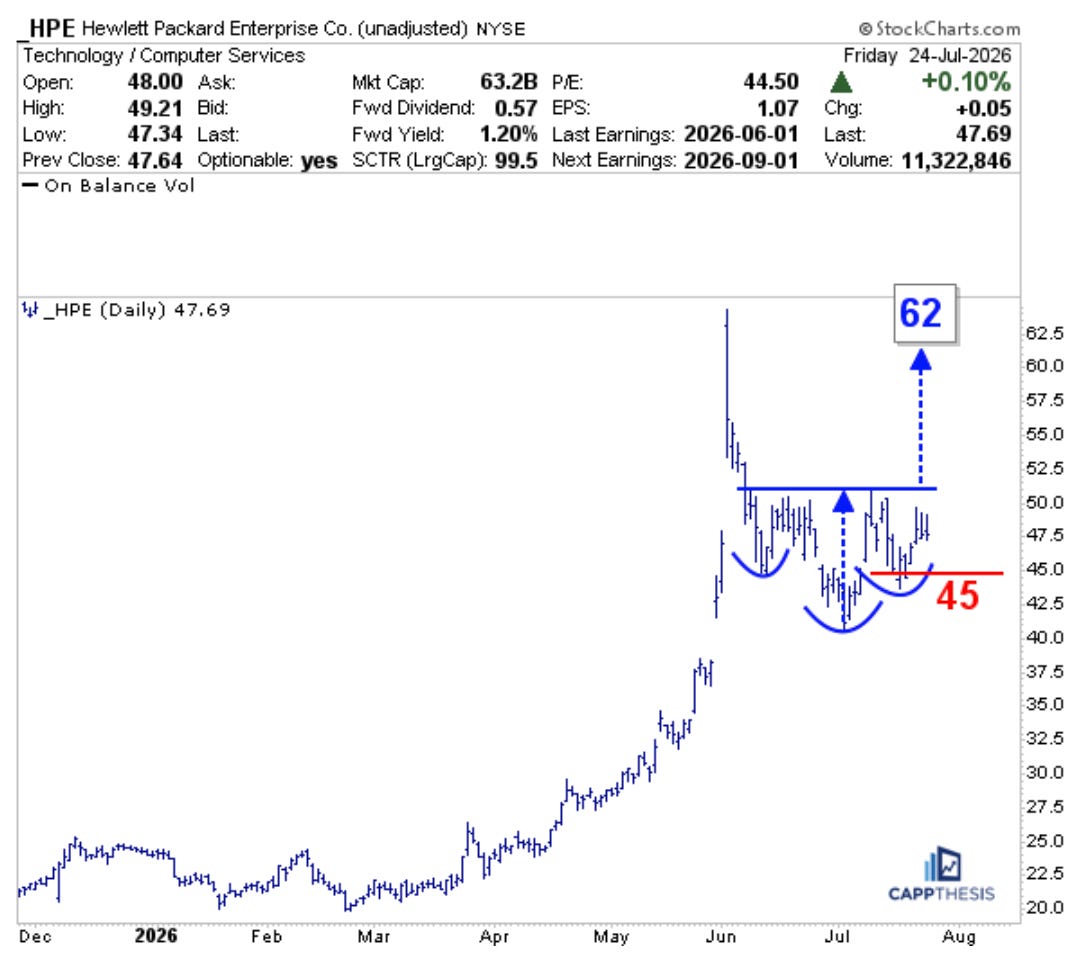
Chart as of 8/14/26
CappNotes offers a small window into the work we do at CappThesis - a technical analysis newsletter company focused on classical chart patterns, trend, and risk management. Explore the full range of CappThesis services here:
No posts
Comments
Nothing yet. Say the first thing.
Sign in to join the conversation.