
Happy Saturday,
Check out this week's five best charts, presented just as they originally appeared in the daily notes - with a highlight on a recently closed Chart Trade, as well.
Enjoy the rest of your weekend. Best, Frank
USO Crude Oil
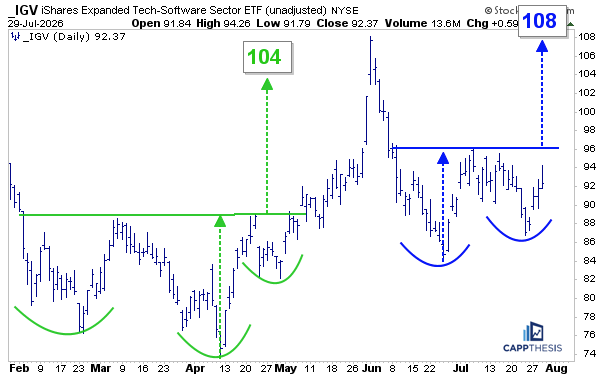
Coincidence or not, positive developments on the geopolitical front have arrived just as USO (and Crude Oil) rallied back to major resistance and returned to overbought territory. This is the same chart we showed on Friday.
At current pre-market levels, USO is set to pull back toward its rising 50-DMA, now near 125-26. Thus, anything that holds near that area would still keep the door open for a bullish continuation pattern to develop.
Again, headlines are clearly driving the price action, but it’s difficult to ignore how closely the news flow has aligned with the technical setup over the last several weeks.
European ETFs
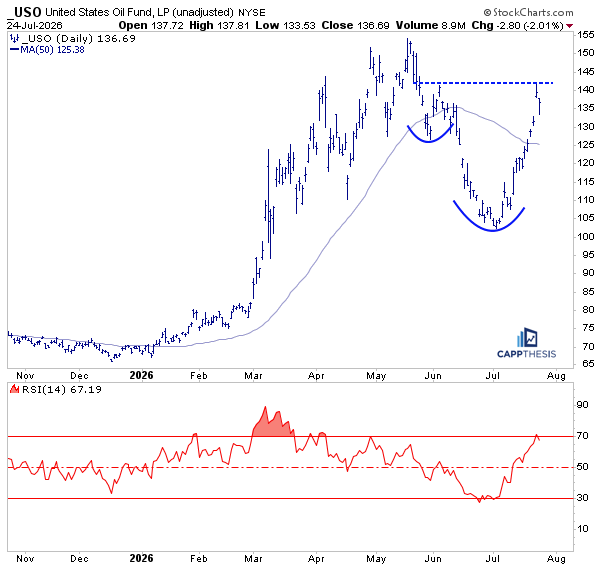
The interesting part is that, despite the U.S. dollar remaining strong over the last few months, many European ETFs priced in U.S. dollars have continued to hold up well. The four examples shown here all continue to display constructive bullish patterns.
These are just examples. Of the 170 ETFs we track, Spain (EWP) was one of only seven to register a new 52-week high yesterday. In other words, investors continue to show demand for European equities despite the potential headwind of a stronger dollar.
Sometimes price action tells us more than the narrative. If these bullish patterns continue to break out, it may suggest that investors are beginning to look beyond today’s dollar strength… or perhaps even anticipating that dollar weakness lies ahead. Again, it’s simply another clue to monitor as we think a few steps ahead.
SPX & FOMC
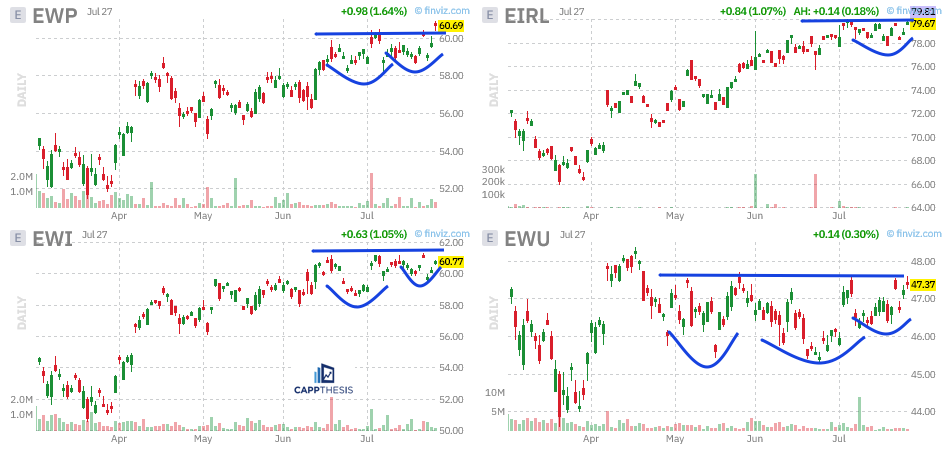
The SPX enters Fed Day trading slightly below where it stood ahead of the June 16 FOMC meeting. Although the index has gone essentially nowhere over the past six weeks, it did stage a short-term rally shortly after that meeting.
One interesting difference this time is the market’s short-term momentum. With the 14-day RSI currently at 46, this is the third-lowest RSI reading the SPX has carried into an FOMC decision since the beginning of 2025.
The only lower readings occurred in March of this year and March of last year, when the market was already in the midst of corrective phases. In both instances, the RSI eventually fell into oversold territory before the decline was complete.
Of course, this is not an apples-to-apples comparison. While the SPX has pulled back since early June, it remains just below an all-time high, unlike those prior periods when the market was already in much more established downtrends.
Even so, the comparison serves as a reminder that a sub-50 RSI heading into an FOMC decision has recently occurred only during periods of increased market stress.
GV – Another potential bullish pattern
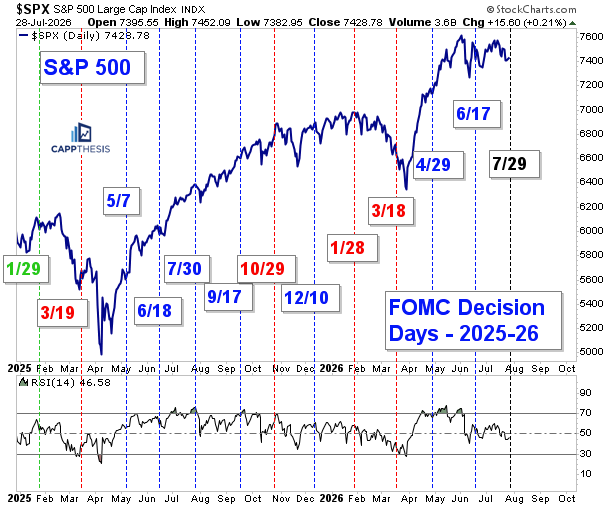
IGV noticeably outperformed the semiconductor group yesterday, and with this morning’s post-earnings strength, it is now approaching its July highs near 96.
We’ve been tracking this recovery over the last two months, watching potential bullish pattern develop. As is often the case, however, chart patterns evolve over time, and what initially appeared to be one formation can mature into another. In this case, the setup now resembles the pictured cup-and-handle pattern.A decisive breakout above resistance would project an upside target near 108, which would align closely with the late May/early June highs. We just need to see real follow through now.
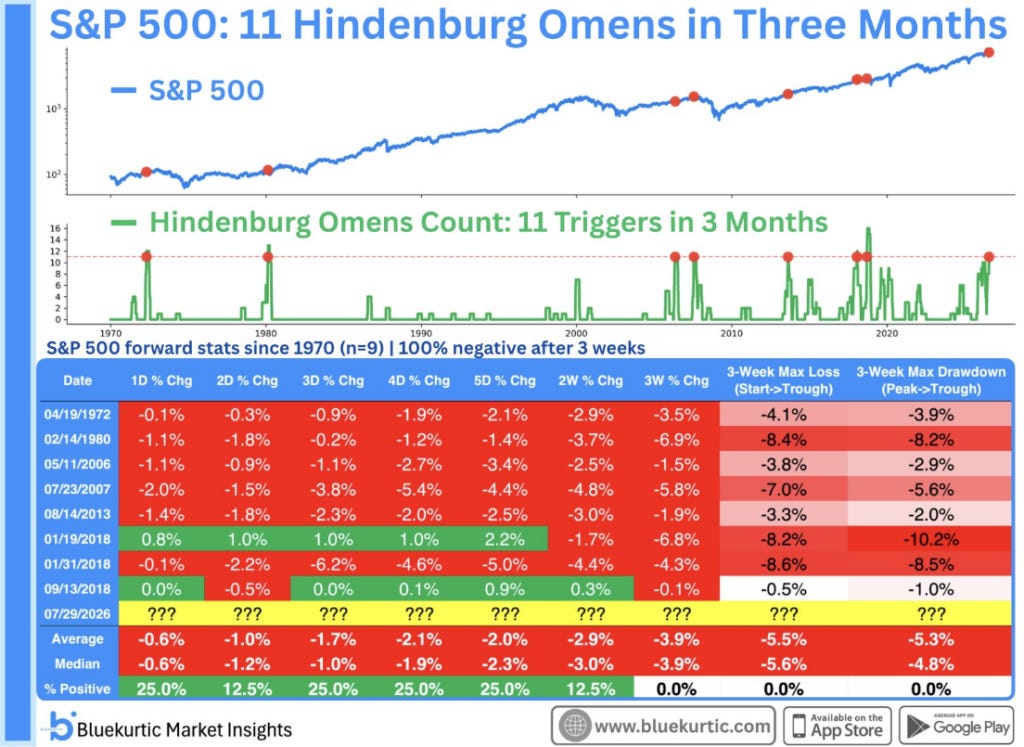
SPX – 11 Hindenburg Omens
Per BlueKurtic: “The Hindenburg Omen is back. 11th trigger in three months. Since 1970, the S&P 500 has ended lower three weeks later every single time, with a median loss of 4%.”
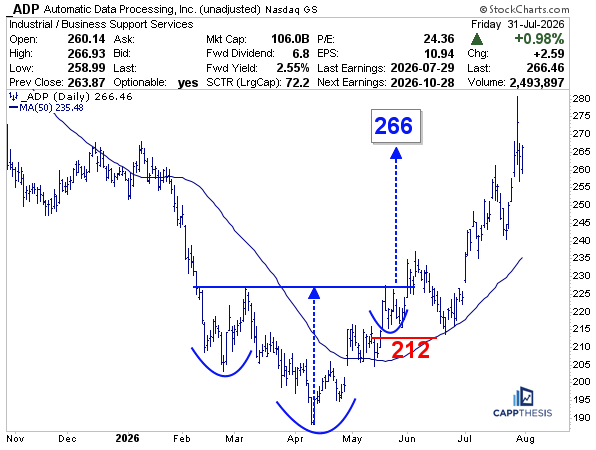
Last week three Chart Trades hit their target prices, while one was stopped out.
ADP was first triggered in late May, broke out, fell back to its 50-DMA, rebounded strongly and then made a series of higher lows and higher highs until achieving its 266 target last week - the day before it reported earnings.
CappNotes offers a small window into the work we do at CappThesis - a technical analysis newsletter company focused on classical chart patterns, trend, and risk management. Explore the full range of CappThesis services here:
No posts
Comments
Nothing yet. Say the first thing.
Sign in to join the conversation.