
Happy Saturday.
Here are this week's five best charts, presented just as they originally appeared in the daily notes.
Also, I had the honor of recording another video StockCharts TV and being a guest on both the Stock Trader Network and the Mining Stock Daily podcast with Trevor Hall.
Check out them here:
IGV Software
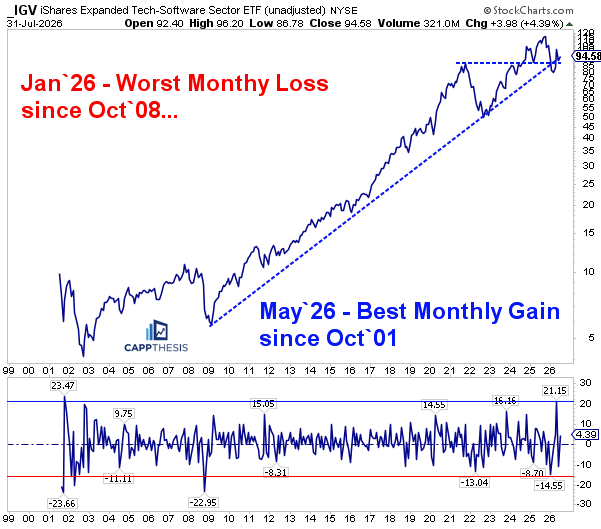
Here’s the monthly chart of IGV going back to its inception. We’ve been highlighting this chart for much of the year because January produced its worst monthly decline since October 2008, while May delivered its strongest monthly gain since October 2001—both occurring right at two major long-term support levels.
Thus far, IGV has respected that key support zone, preserving its long-term uptrend. While we’ve been focused on the ETF’s shorter-term pattern recently, this chart is a reminder of just how significant that long-term support hold has been.
XBI Biotech
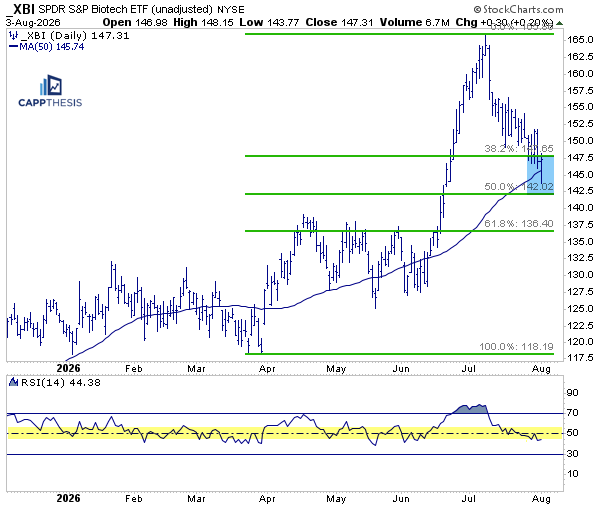
XBI has continued to retrace its powerful June advance, with a steady, orderly pullback over the last four weeks and little evidence of a meaningful buying… until yesterday.
The ETF staged a positive intraday reversal after briefly undercutting its rising 50-DMA near an area that also coincides with the 50% retracement of the March-to-July advance.
As the chart shows, XBI has repeatedly found support after briefly slipping below its 50-DMA throughout 2026. In several cases, it remained below the line for a few days before recovering, creating buy-the-dip opportunities that ultimately led to renewed upside.
DeMARK
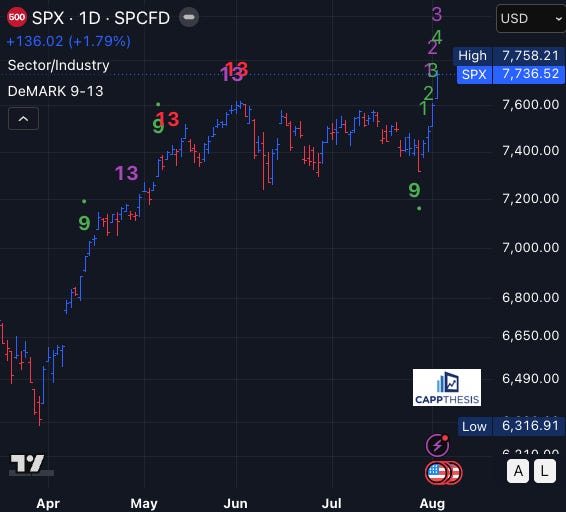
We highlighted the DeMARK Setup 9 Buy signal that appeared after last Wednesday’s close. While these signals don’t always mark the exact low, this one proved to be very timely, preceding the powerful four-day rally that followed. With the rebound now in place, the next DeMARK count toward a potential Sell signal has begun, something we’ll continue to monitor as this advance unfolds.
GLD Gold GoNoGo
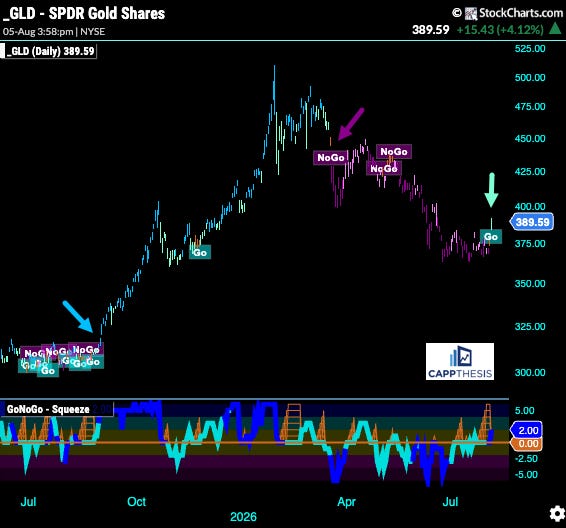
The rally over the last few days has also triggered a new Go signal in the GoNoGo indicator. The last time GLD entered Go Mode was mid-March, just before the recent corrective phase began.
Also worth noting is what happened last year. After several months of choppy, back-and-forth trading through the spring and summer, GLD finally broke out in late August. From there, the GoNoGo indicator remained in Go or Neutral Mode all the way into March’26, accompanying a sustained advance.
One day doesn’t make a trend, but it can mark the beginning of one…
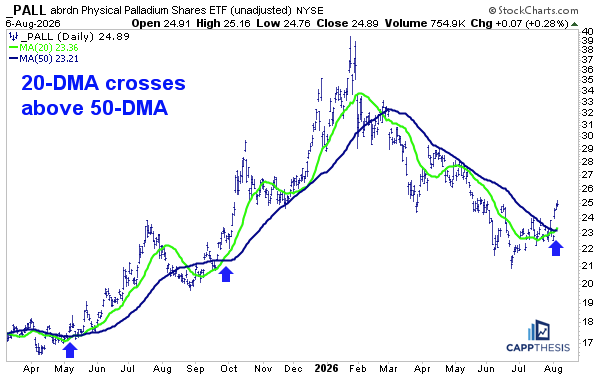
PALL Palladium – 20-DMA crosses over 50-DMA
PALL Palladium, along with gold and silver, has enjoyed a strong run over the last few days. That has allowed it to push decisively above its 50-day moving average, which had capped rally attempts since it broke below the line in February.
Yesterday, the 20-DMA (green) also crossed above the 50-day (blue), albeit slightly, for only the third time since last spring. As the chart shows, the previous two instances—in May and September 2025—were followed by immediate and strong upside follow-through lasting several weeks.
Both also occurred during the larger advance that culminated with the spike highs to begin this year, making this latest crossover worth watching closely.
CappNotes offers a small window into the work we do at CappThesis - a technical analysis newsletter company focused on classical chart patterns, trend, and risk management. Explore the full range of CappThesis services here:
No posts
Comments
Nothing yet. Say the first thing.
Sign in to join the conversation.