
In this difficult and precarious moment, we’re seeing clear evidence that sustained, long-term activism works: in 2025, fatal police violence declined for the first time in six years. Our analyses also show that in recent years, officers who killed people were more often charged with crimes.
At the same time, new threats are emerging, as federal agencies expand into unaccountable paramilitary forces and increasingly employ excessive and unconstitutional uses of force and officials roll back successful reforms, such as restrictions on vehicle pursuits. In the face of these challenges, activism is more essential than ever to defend hard-won progress and keep pushing forward.
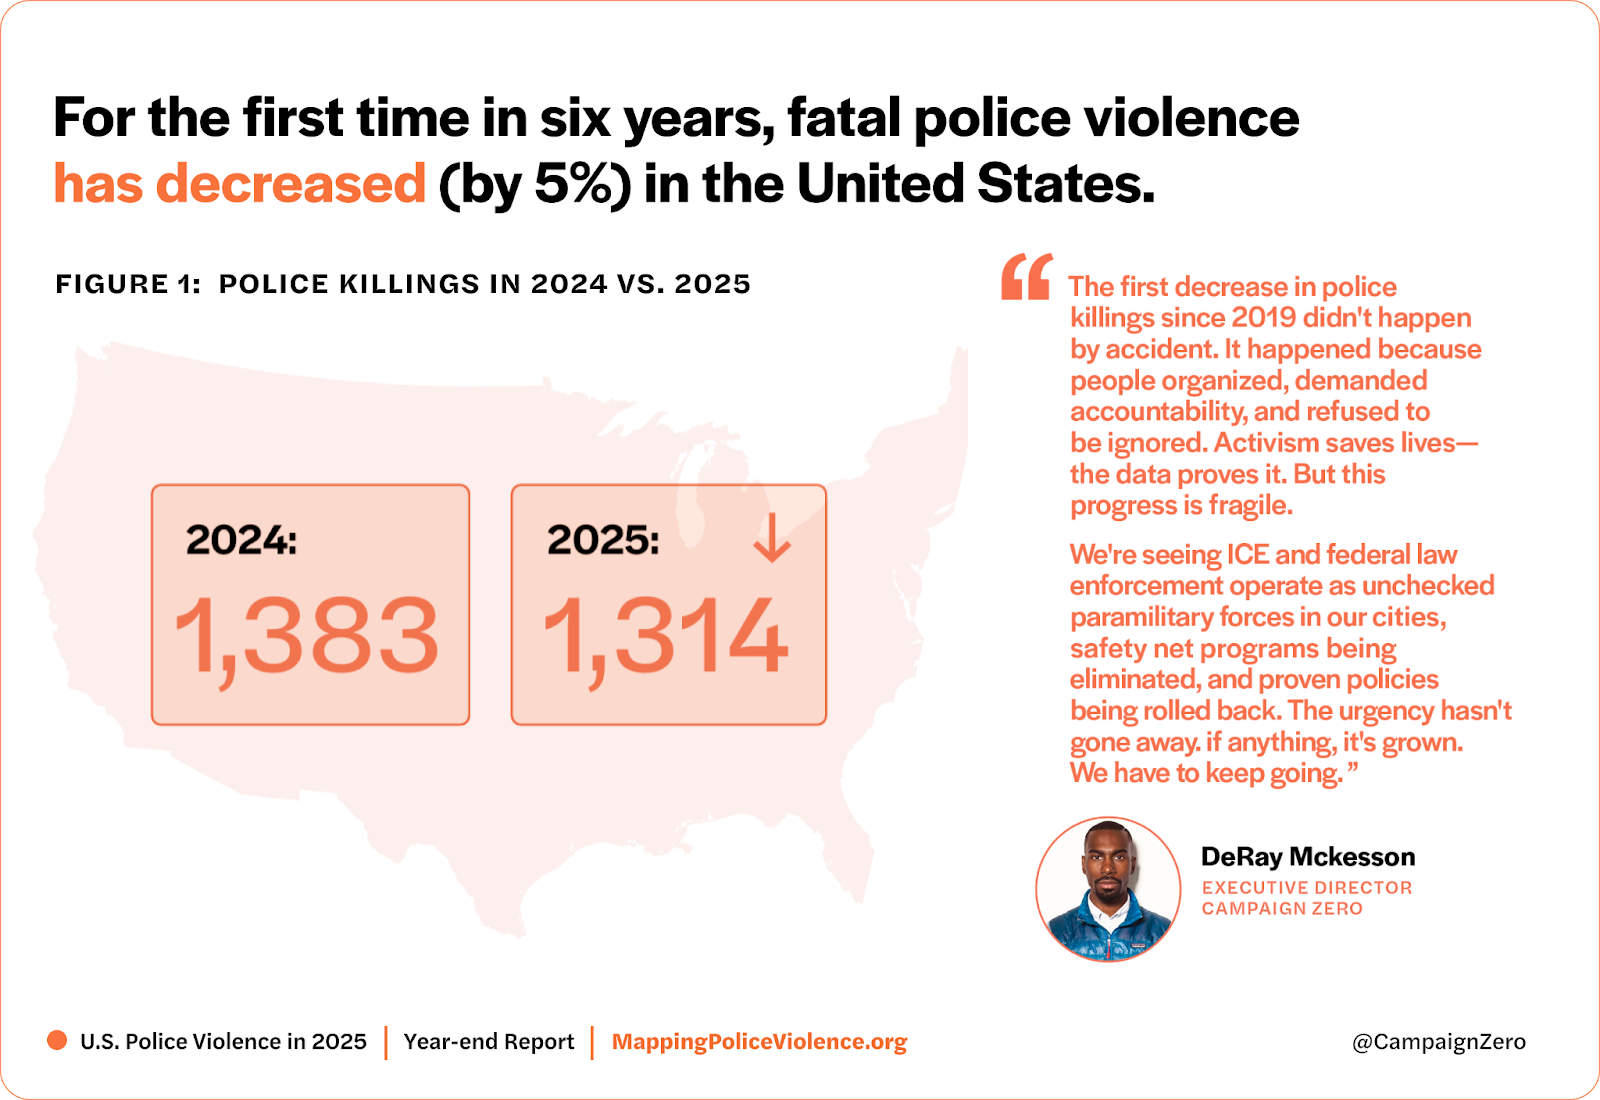
Police killings declined 5% in 2025 compared with 2024, the first year-over-year decline since 2019. Still, more than 1,300 people were killed in 2025, and several states and federal agencies are rolling back reforms.
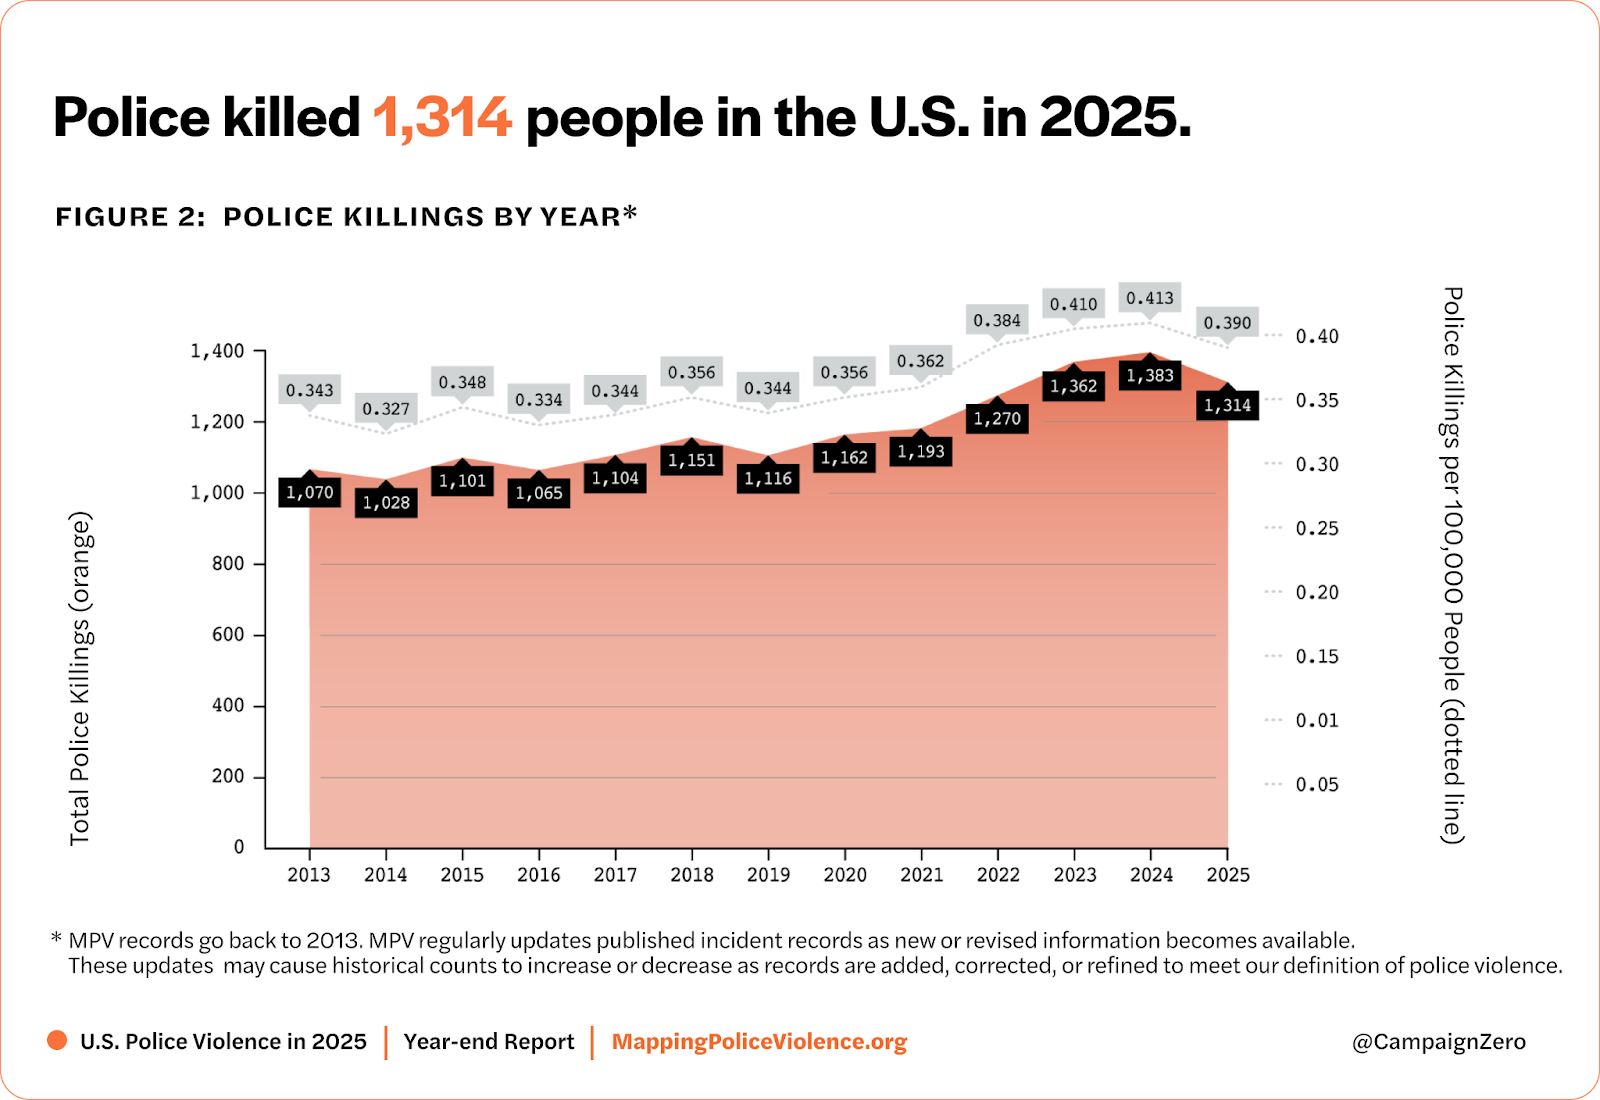
From 2013 to 2020, the rate of police killings per 100,000 residents hovered around 0.345 per 100,000, increased slightly in 2021, and rose more sharply beginning in 2022. Even after adjusting for population growth, the rate declined by 5.6% from 2024 to 2025.
In 2025, the District of Columbia saw the largest increase in police killings—a 98% increase compared to the average of the previous 12 years.
Over the prior 12 years, DC ranked 10th highest on average, with 0.58 police killings per 100,000 people.
In 2025, DC rose to the third-highest rate, with 1.15 police killings per 100,000 people.
2025 was Washington DC’s worst year since records began in 2013.
In 2025, New Mexico had the highest rate of police killings among all states, with 1.36 police killings per 100,000 people.
New Mexico also had the highest average rate over the previous 12 years, at 1.12 police killings per 100,000 people.
In 2025, Rhode Island was the only state to record zero police killings.
Its average rate over the prior 12 years was 0.08 police killings per 100,000 people, the lowest average in the country.
New Jersey had the second-lowest rate in 2025, with 0.08 police killings per 100,000 people, representing a 48% decrease compared to its 12-year average.
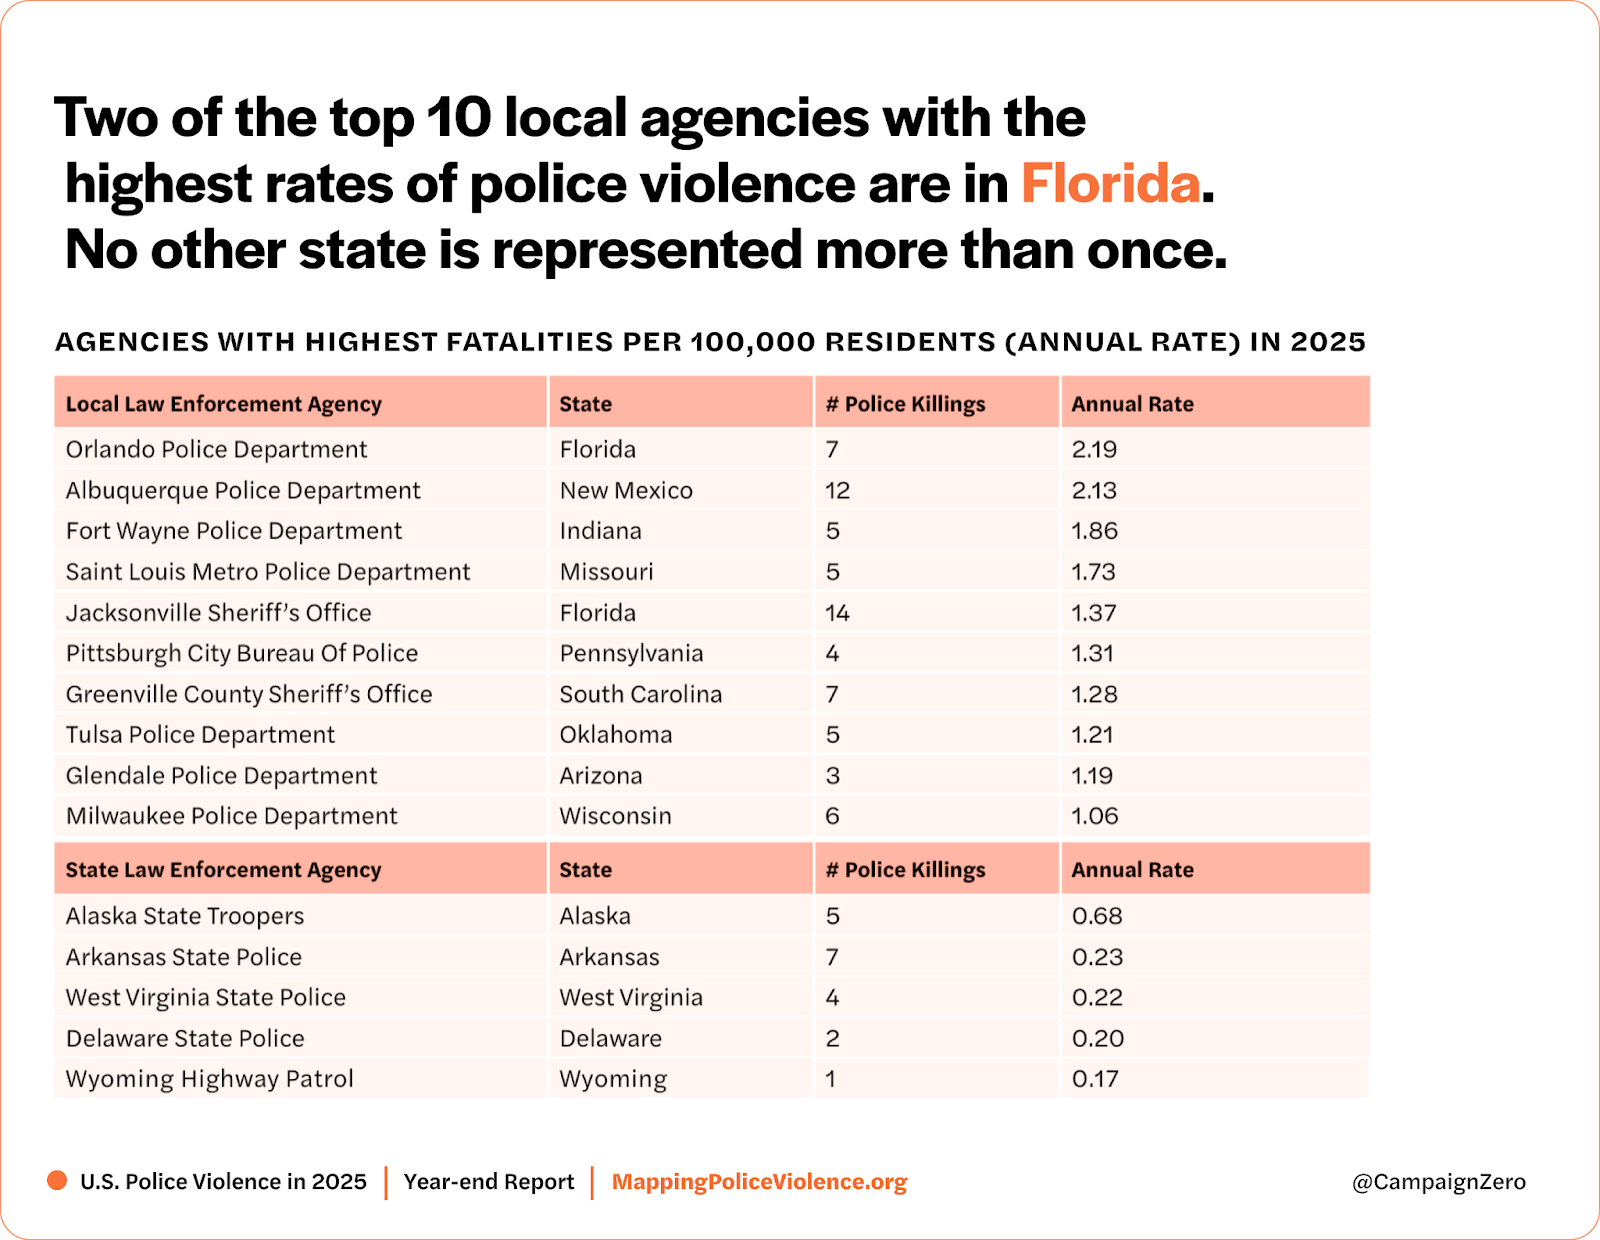
Among cities with at least 250,000 residents, Orlando, FL had the highest per capita rate of police killings in 2025 with 2.81 police killings per 100,000 people.
In 2025, 12 cities with populations over 250,000 recorded zero police killings, up from 10 cities in 2024—despite having recorded police killings within the previous 12 years.
Among them, Long Beach, CA experienced the most significant drop. In 2025, Long Beach recorded zero police killings, after having 39 deaths over the previous 12 years—an average of:
3.3 deaths per year, or
0.71 police killings per 100,000 people per year
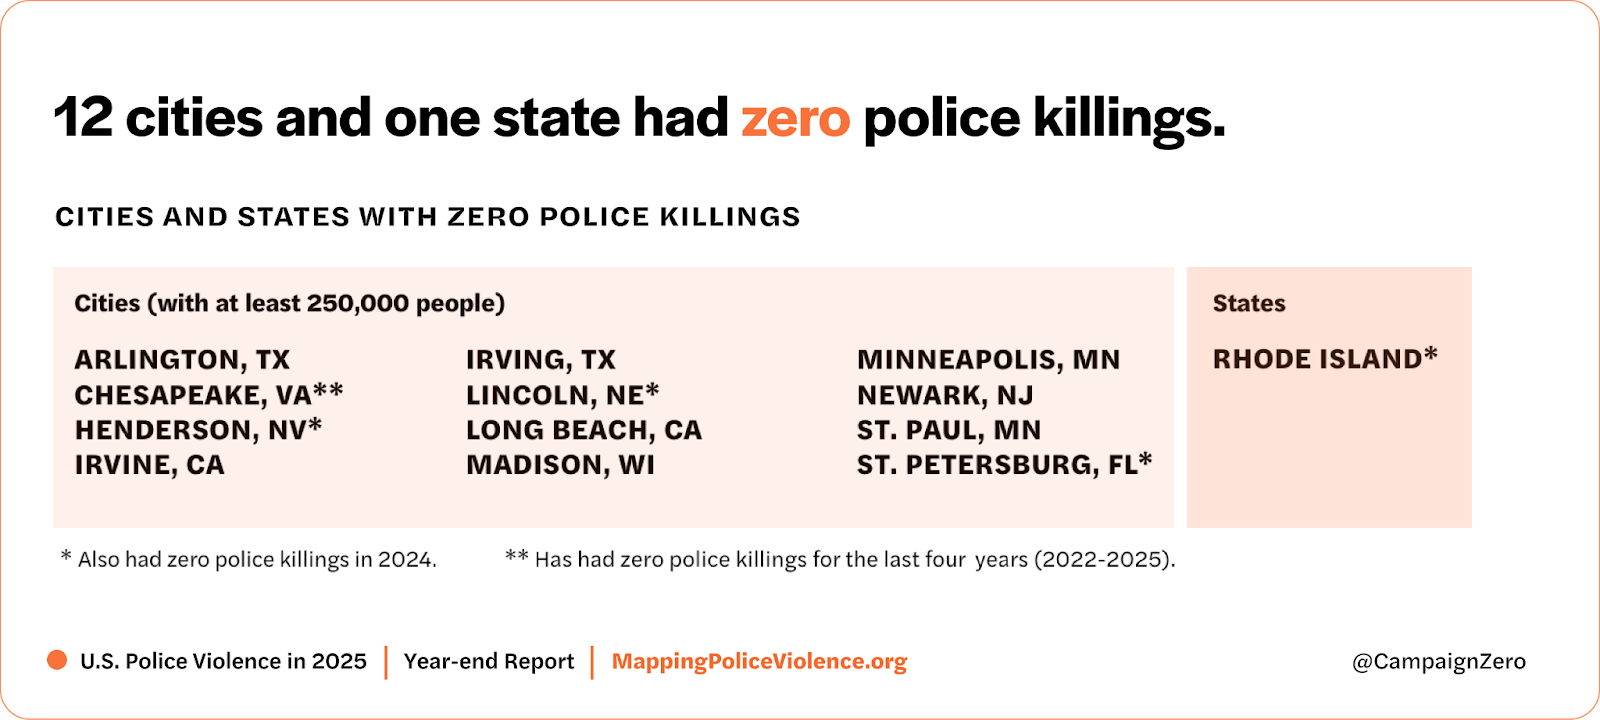
Per-capita rates can fluctuate widely in small populations. To strike a balance between inclusion and interpretability, this analysis includes only agencies serving jurisdictions with populations of 250,000 or greater.
In 2025, at least 156 law enforcement agencies killed only Black people. Because of the large number of cases where the victim’s race is unknown, this number could be as high as 273. In 141 of these 156 agencies, that was the sole police killing in 2025. These 156 agencies are in 117 counties across the US.
There were at least 129 cities and towns across the US that killed only Black people. In 115 of these 129 cities, that was the sole police killing in 2025.
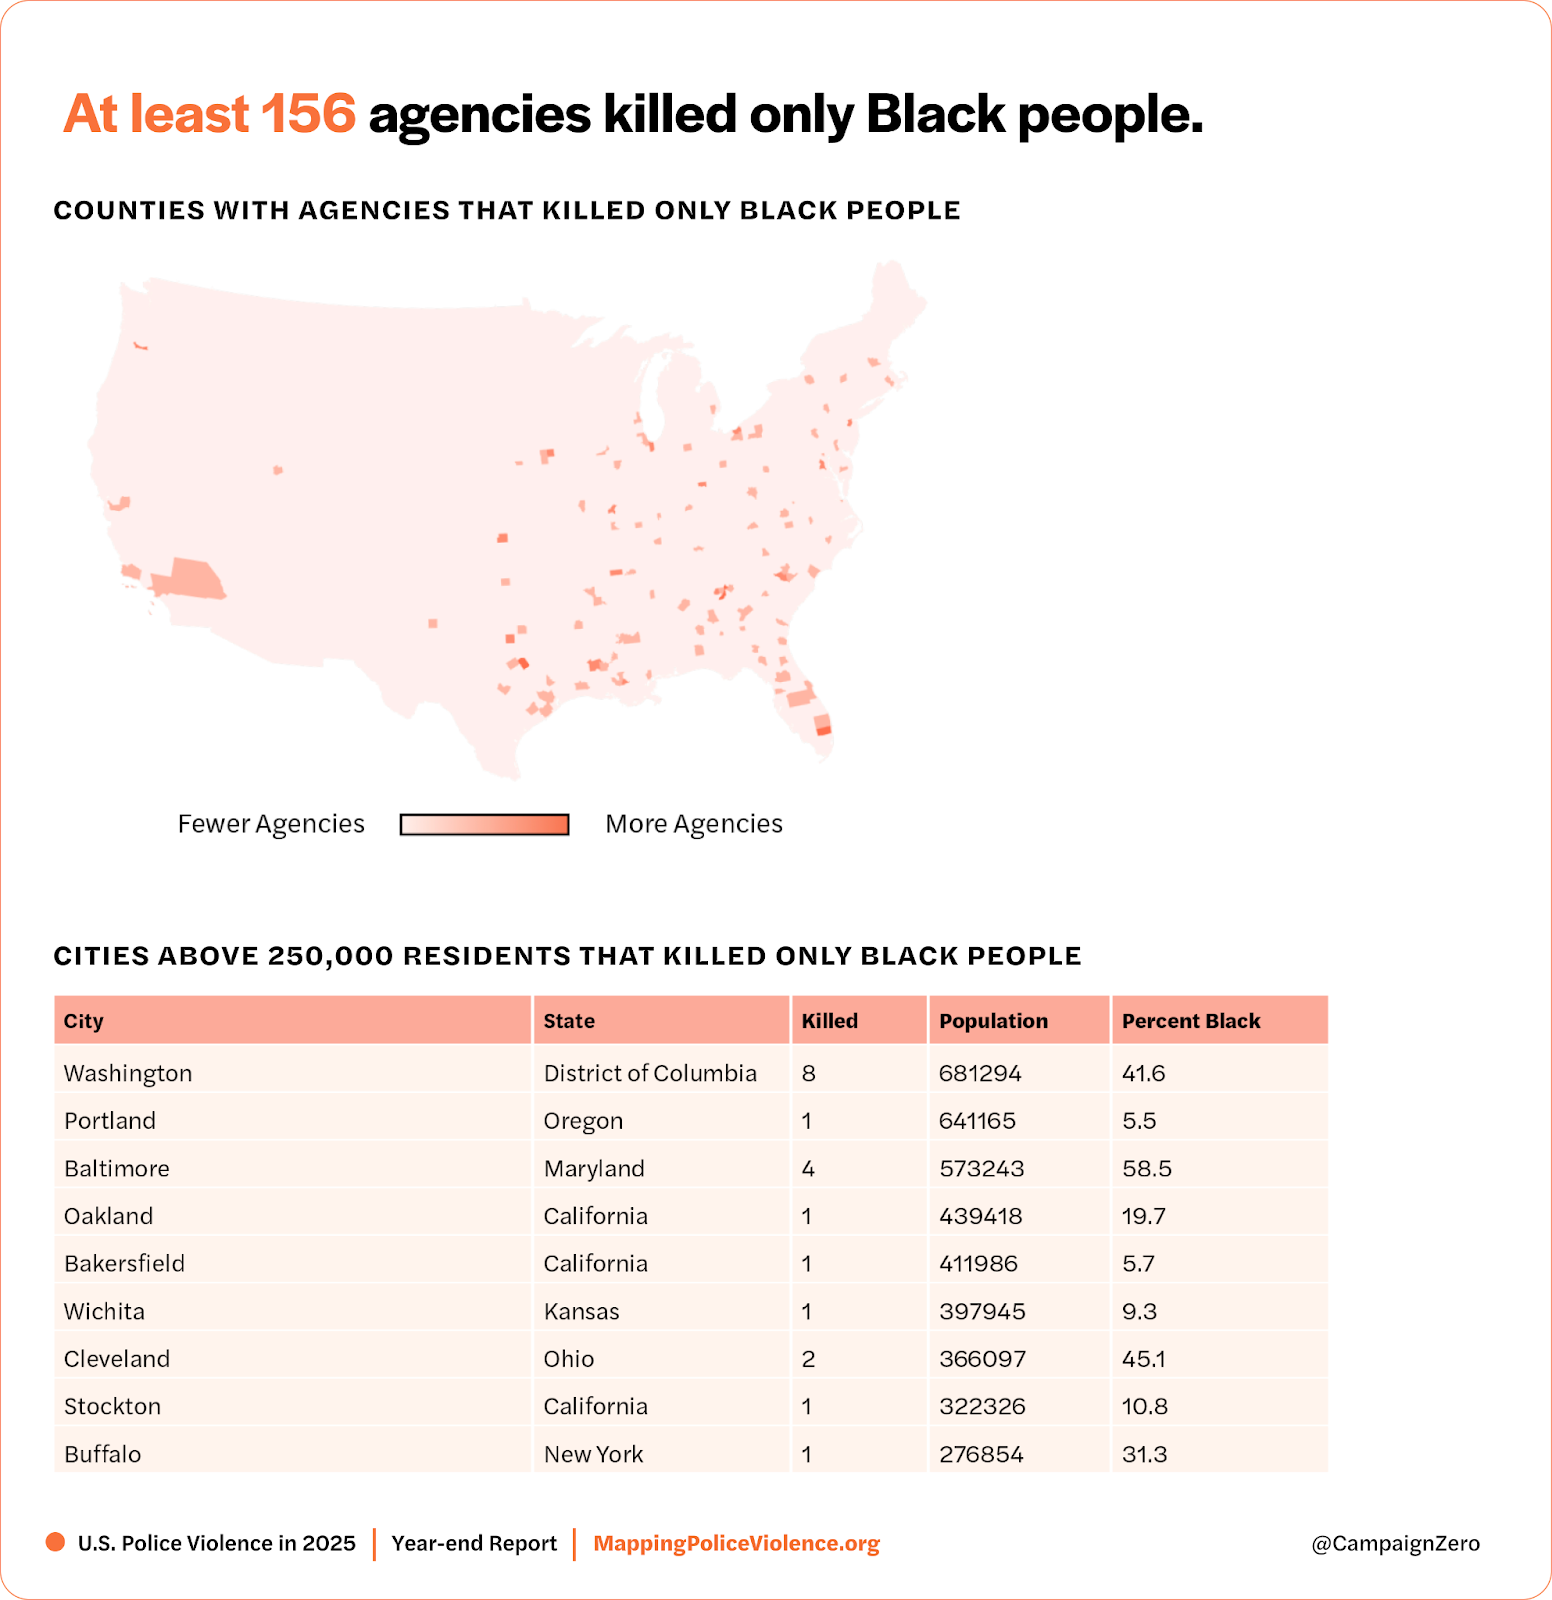
Among all states (including DC) tracked, Washington DC saw the largest increase in police killings, relative to the average of the 12 years prior, and it was also the largest city to kill only Black people.
The Jacksonville Sheriff’s Office saw more than a 400% increase in fatal police encounters in 2025. One of the victims was 14 years old.
This dramatic increase follows a public push by the Sheriff (elected in late 2022) to recruit 80 more sheriff’s deputies. Local Florida journalists have highlighted the excessive number of officer-involved killings stemming from a particularly vague use-of-force policy. Permitless concealed carry also became legal in mid-2023, likely increasing the number of people carrying weapons. Our own research shows that there is a positive association between state levels of gun ownership and police killings.
In April 2025, the department approved the use of personal handguns instead of department-issued Glocks, referencing the opinion of a safety analyst that officers could show improvements in “effectiveness” and “confidence.” This confidence could also increase the likelihood of using a gun during an encounter because of comfort and familiarity with some tactical equipment over less lethal options (taser, baton). Of the 14 killings, two fatal incidents occurred in March, with the remaining 12 occurring after the new rule was implemented in May.
Victim data reveal persistent race and age disparities in fatal police violence. MPV data is evaluated for patterns by race, age, gender, and armed status to identify who is most impacted.
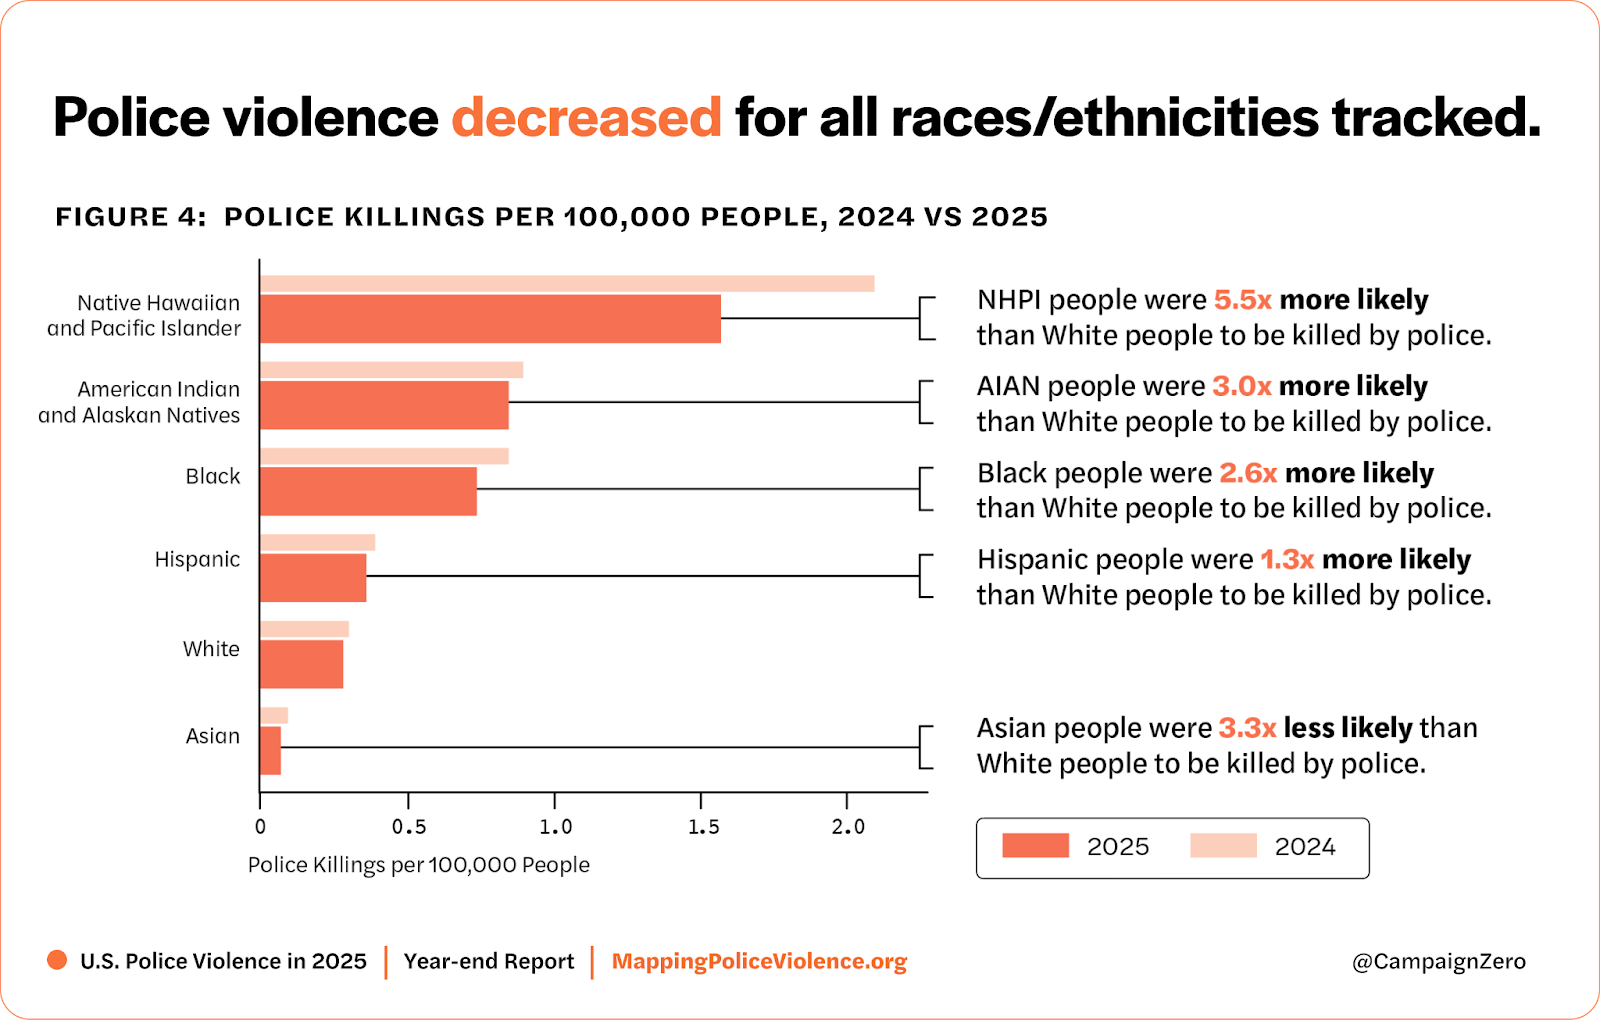
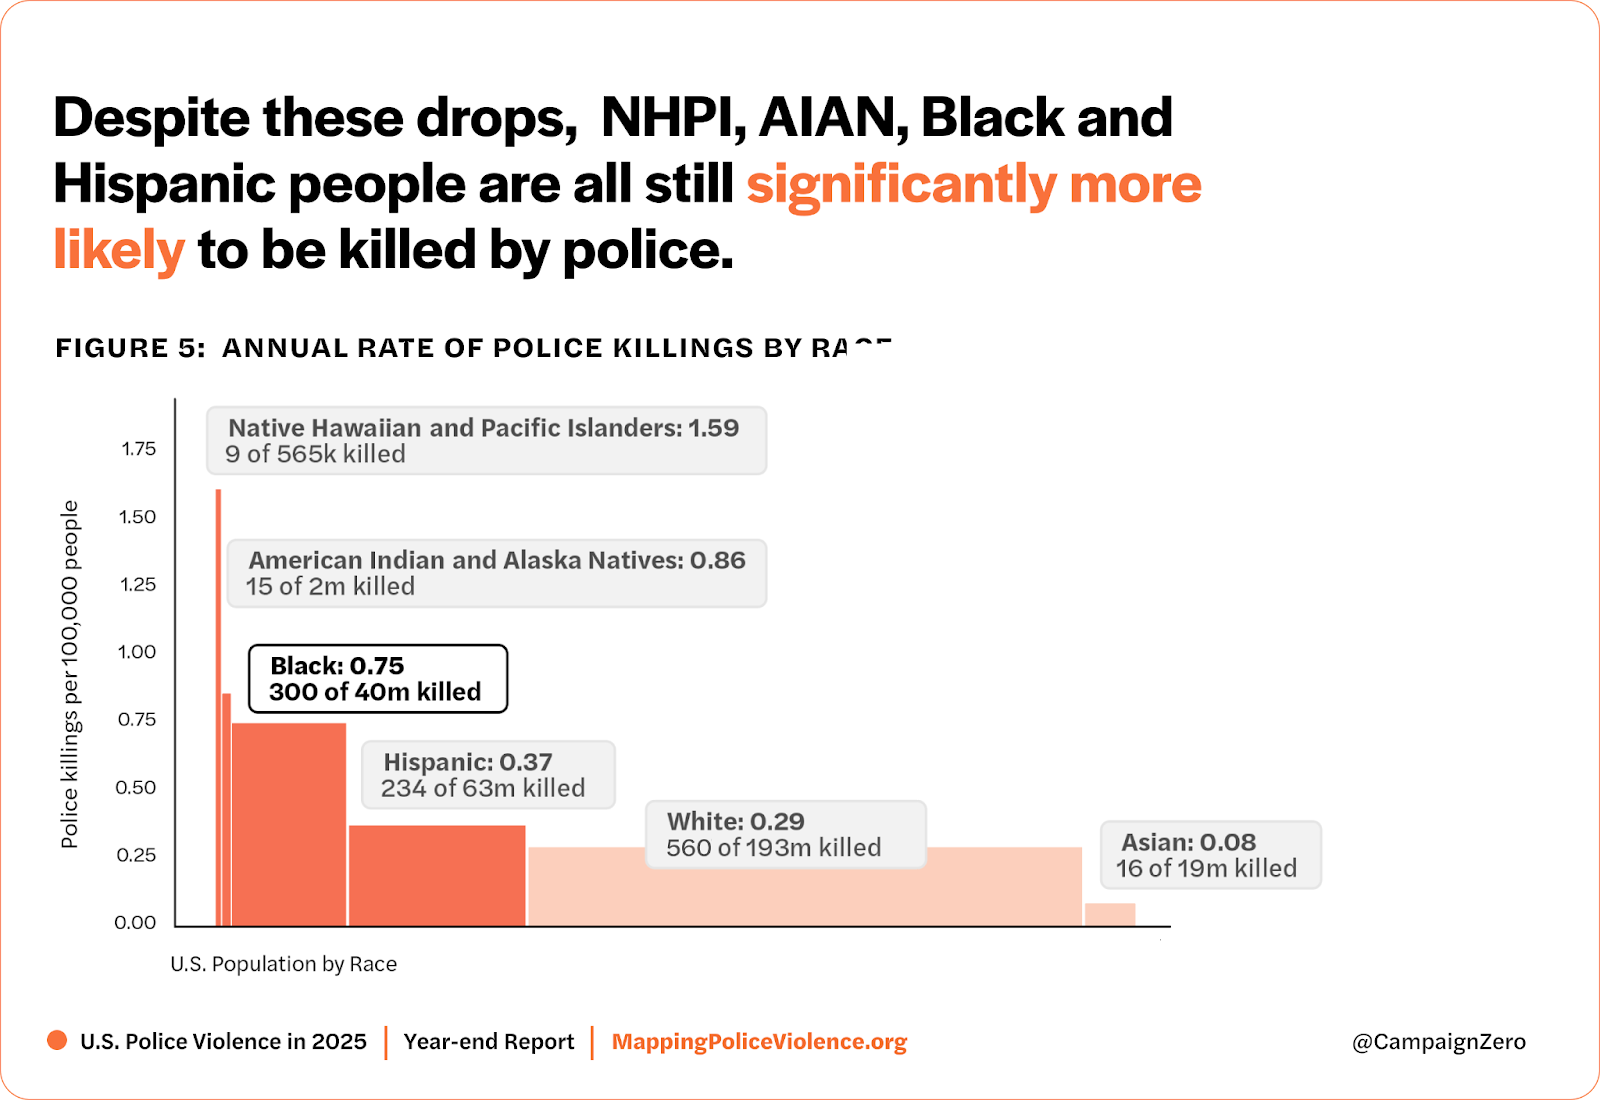
Relative to 2024, police violence decreased across all races/ethnicities in 2025, though this decrease was most pronounced for Native Hawaiians & Pacific Islanders and Black victims. Despite these drops, NHPI, AIAN, Black and Hispanic people were all still significantly more likely to be killed by police.
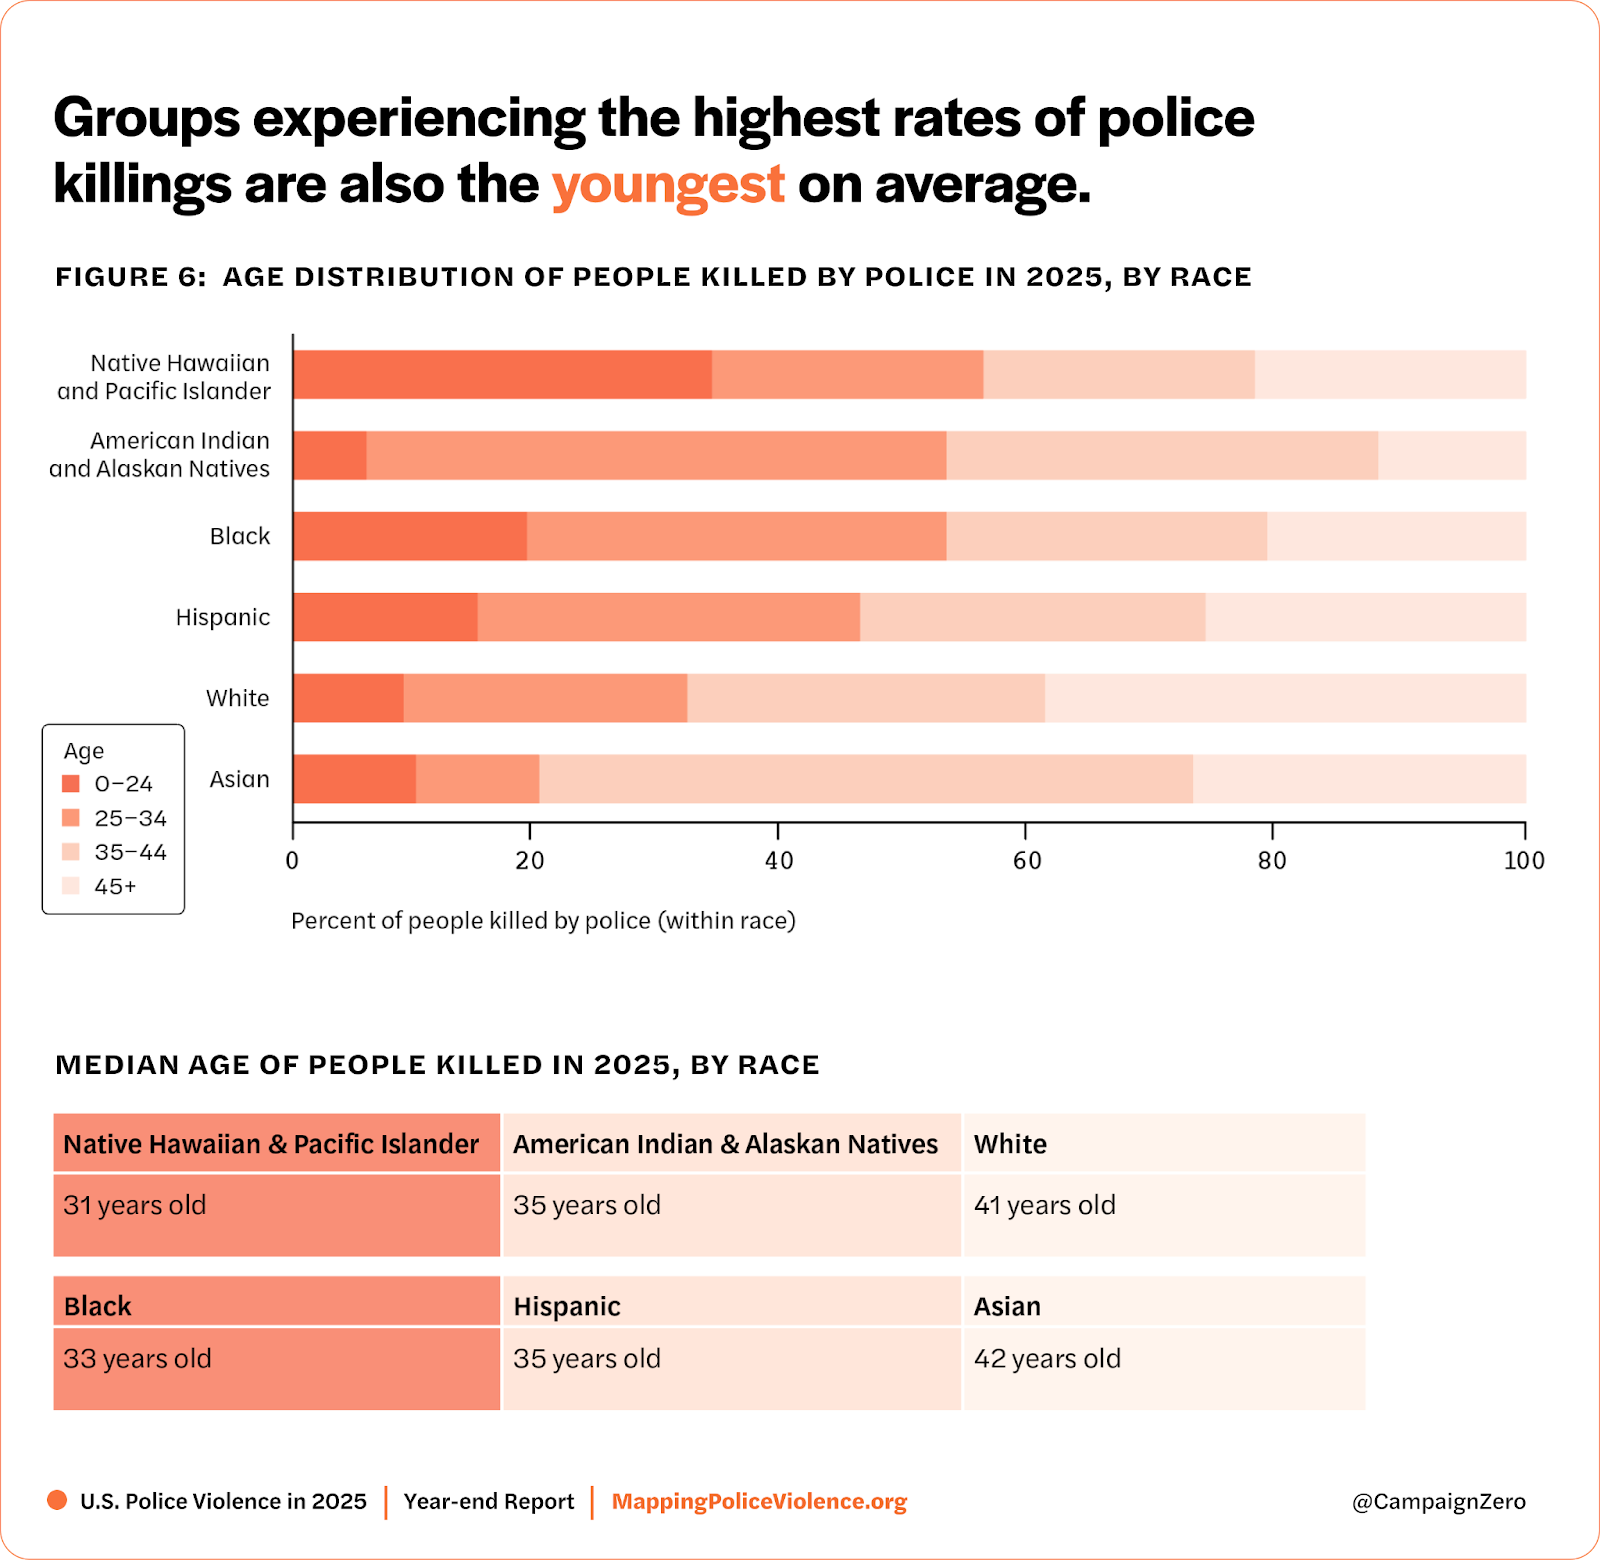
Groups experiencing the highest rates of police killings were also the youngest on average. More than 50% of NHPI, Black, and AIAN victims of police violence were ages 0–34, compared with White victims, whose majority were age 35 or older. Research in psychology and criminology has consistently found that children of color, particularly Black boys, are more likely to be perceived as older, less innocent, and more blameworthy, and stopped more frequently and aggressively by police than their White peers. Our data suggest these disparities persist in the use of deadly force, reflecting ongoing racial inequities in policing outcomes.
Budget cuts affecting behavioral health services, community services, and alternative crisis response units in 2025 could increase police interactions with the public and subsequent violence in the coming years.
To sustain the downward trend of police killings observed in 2025, social services must maintain prior funding levels. The majority of police killings follow a call for service; the more emergency calls that can be diverted to non-law-enforcement bodies, the more we can reduce tense interactions between police and civilians, lowering the chances of police using fatal force against members of the public.
Cuts to services risk losing progress we’ve made on police violence reduction.
Donate to support our work: Tracking every police killing in America takes resources—your contribution keeps this data free and accessible
Support local journalism: Subscribe or donate to local outlets that report on public safety and police accountability—and support organizations that offer programming and training for independent journalists
Support independent civilian oversight: Engage with or advocate for civilian review boards in your community
Advocate for behavioral health services and alternate crisis response programming: Support funding for these evidence-backed initiatives during local and state budget processes
Demand transparency from law enforcement agencies: Including making use of force data, policies, and training public
Share this data: Share our work with local officials, journalists, and community organizations
Law enforcement agencies across the country fail to provide basic information about the lives they take. Mapping Police Violence exists to fill that gap by collecting, analyzing, and making accessible accurate data on people killed by law enforcement in the United States.
Every year, Campaign Zero works to make data on police violence accessible and understandable to the public via Mapping Police Violence, a platform tracking when U.S. law enforcement kills civilians. This report aims to provide key takeaways concerning incidents in 2025 of police killing civilians.
Local journalism is the foundation of the Mapping Police Violence project. News articles are automatically ingested into our system, which collects, filters, and cleans the data before it is passed to human qualitative researchers. While we employ official sources from local and state government agencies to complement our information-gathering process, we believe it is important to continue collecting data from publicly accessible media sources. This allows us to identify gaps in government data dissemination and further triangulate and validate the incidents we track.
Per our methodology, all incidents go through a multi-layered review process. The current total number of incidents in 2025 may increase in the coming months because some police killings and their circumstances are not reported until weeks or months later.
No posts
Comments
Nothing yet. Say the first thing.
Sign in to join the conversation.