
A short note: I like to watch housing inventory closely, and here is some timely data from Altos Research.
Altos reports active single-family inventory every week. This graph shows the seasonal pattern for active single-family inventory since 2015 through last Friday (July 17th).
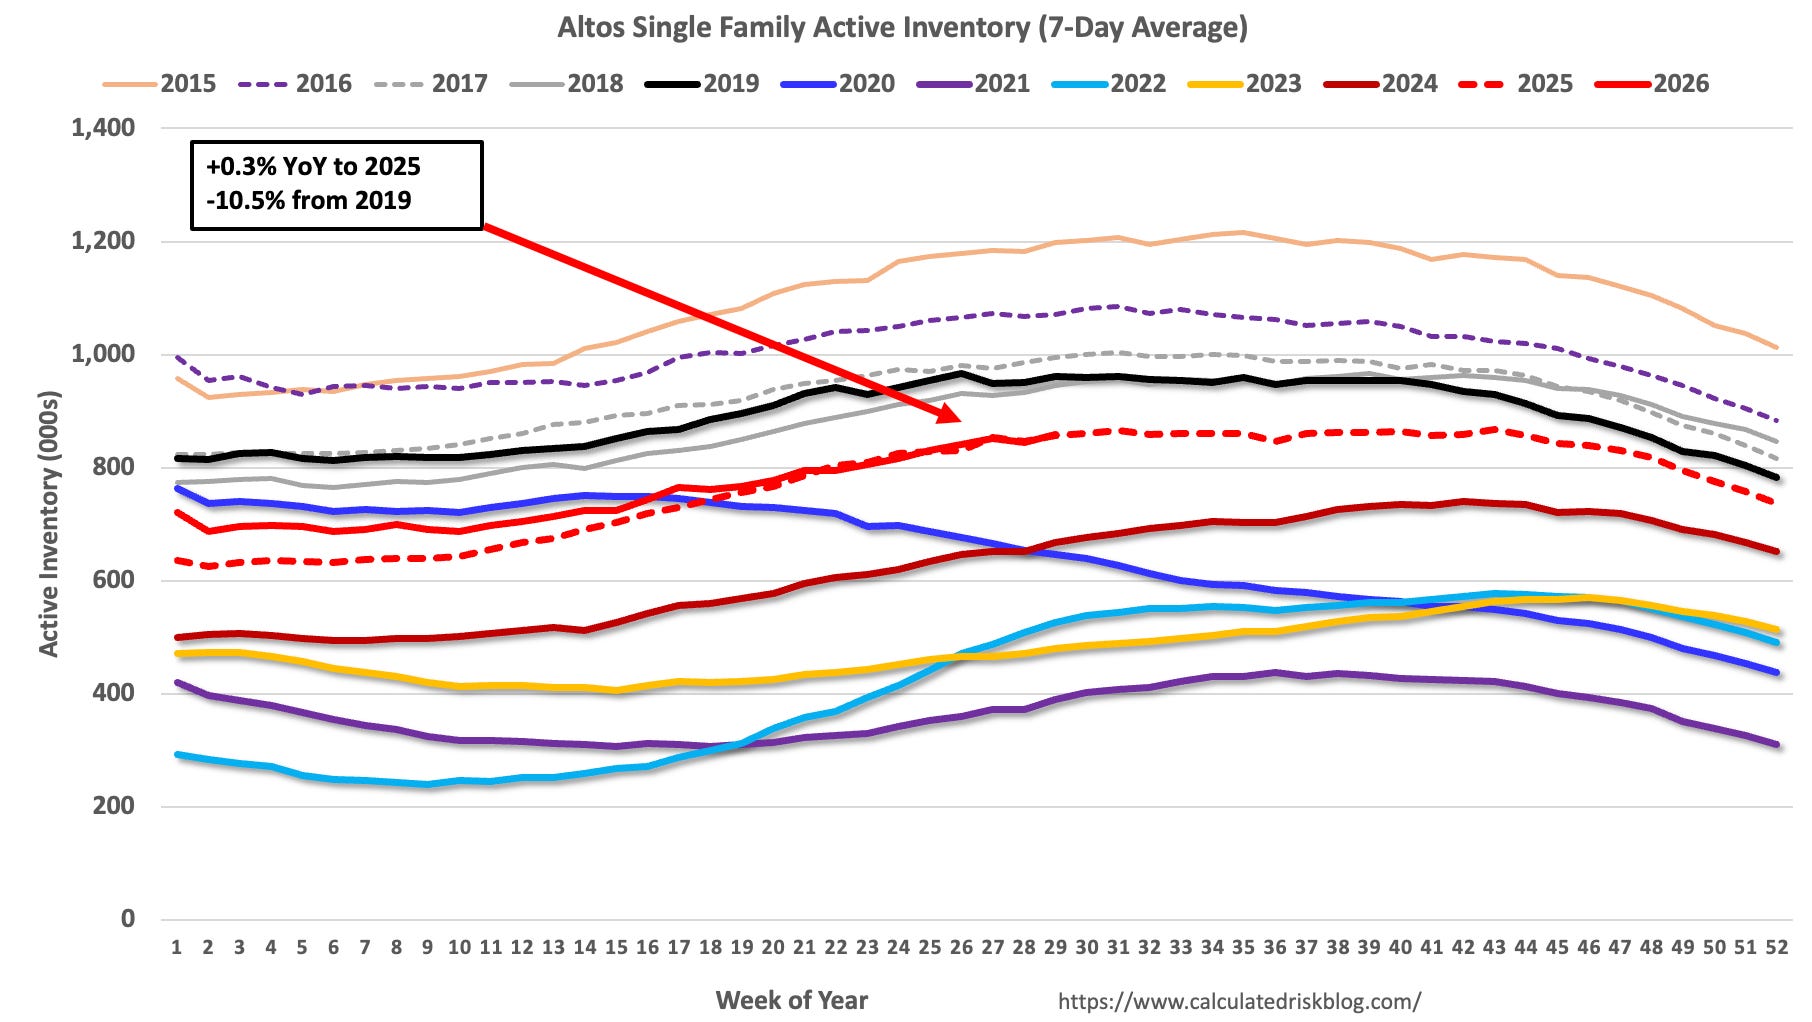
The red line is for 2025. The black line is for 2019.
Inventory was up 0.3% …
Comments
Nothing yet. Say the first thing.
Sign in to join the conversation.