
Note: The Freddie Mac index is a repeat sales index using only loans purchased by Fannie and Freddie and includes appraisals. See FAQs here. Freddie has data for all states and many cities. For house prices, I’m currently following Case-Shiller, FHFA, ICE, the NAR median prices, and this Freddie Mac index.
Freddie Mac reported that its “National” Home Price Index (FMHPI) increased 0.32% month-over-month (MoM) on a seasonally adjusted (SA) basis in June.
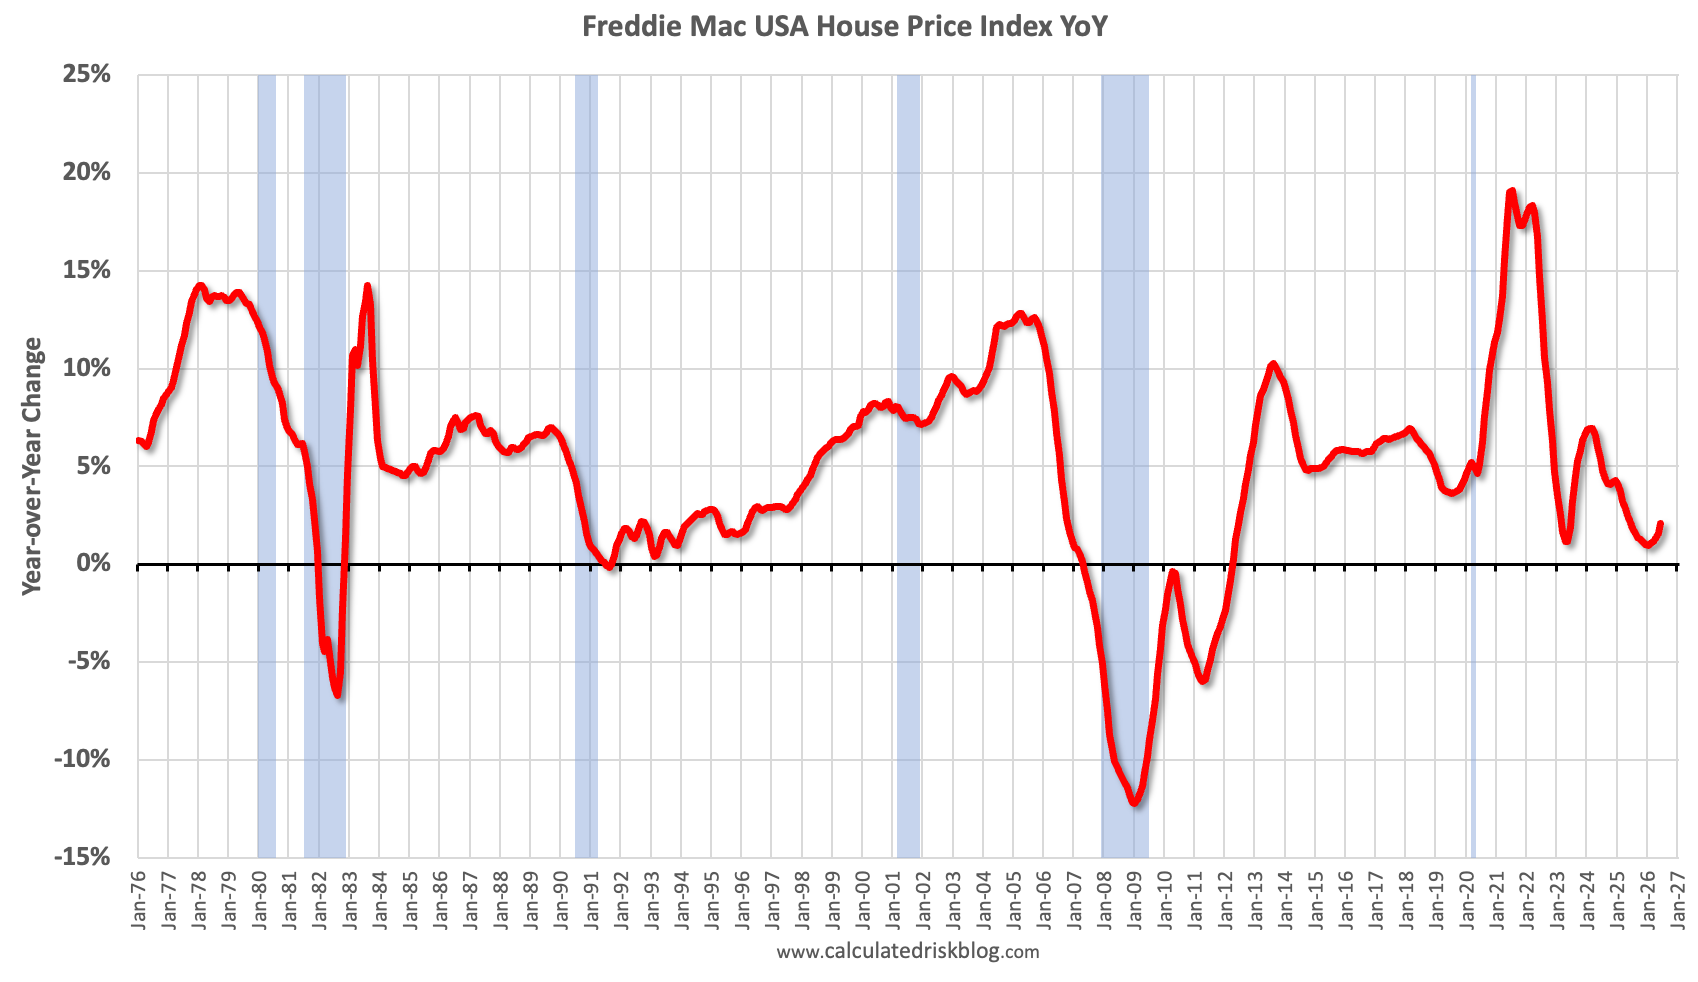
On a year-over-year (YoY) basis, the National FMHPI was up 2.1% in June, up from up 1.6% YoY in May. The YoY increase peaked at 19.2% in July 2021, and for this cycle, and bottomed at up 1.0% YoY in January 2026.
The second graph shows the month-over-month (MoM) change in the national FMHPI, seasonally adjusted.
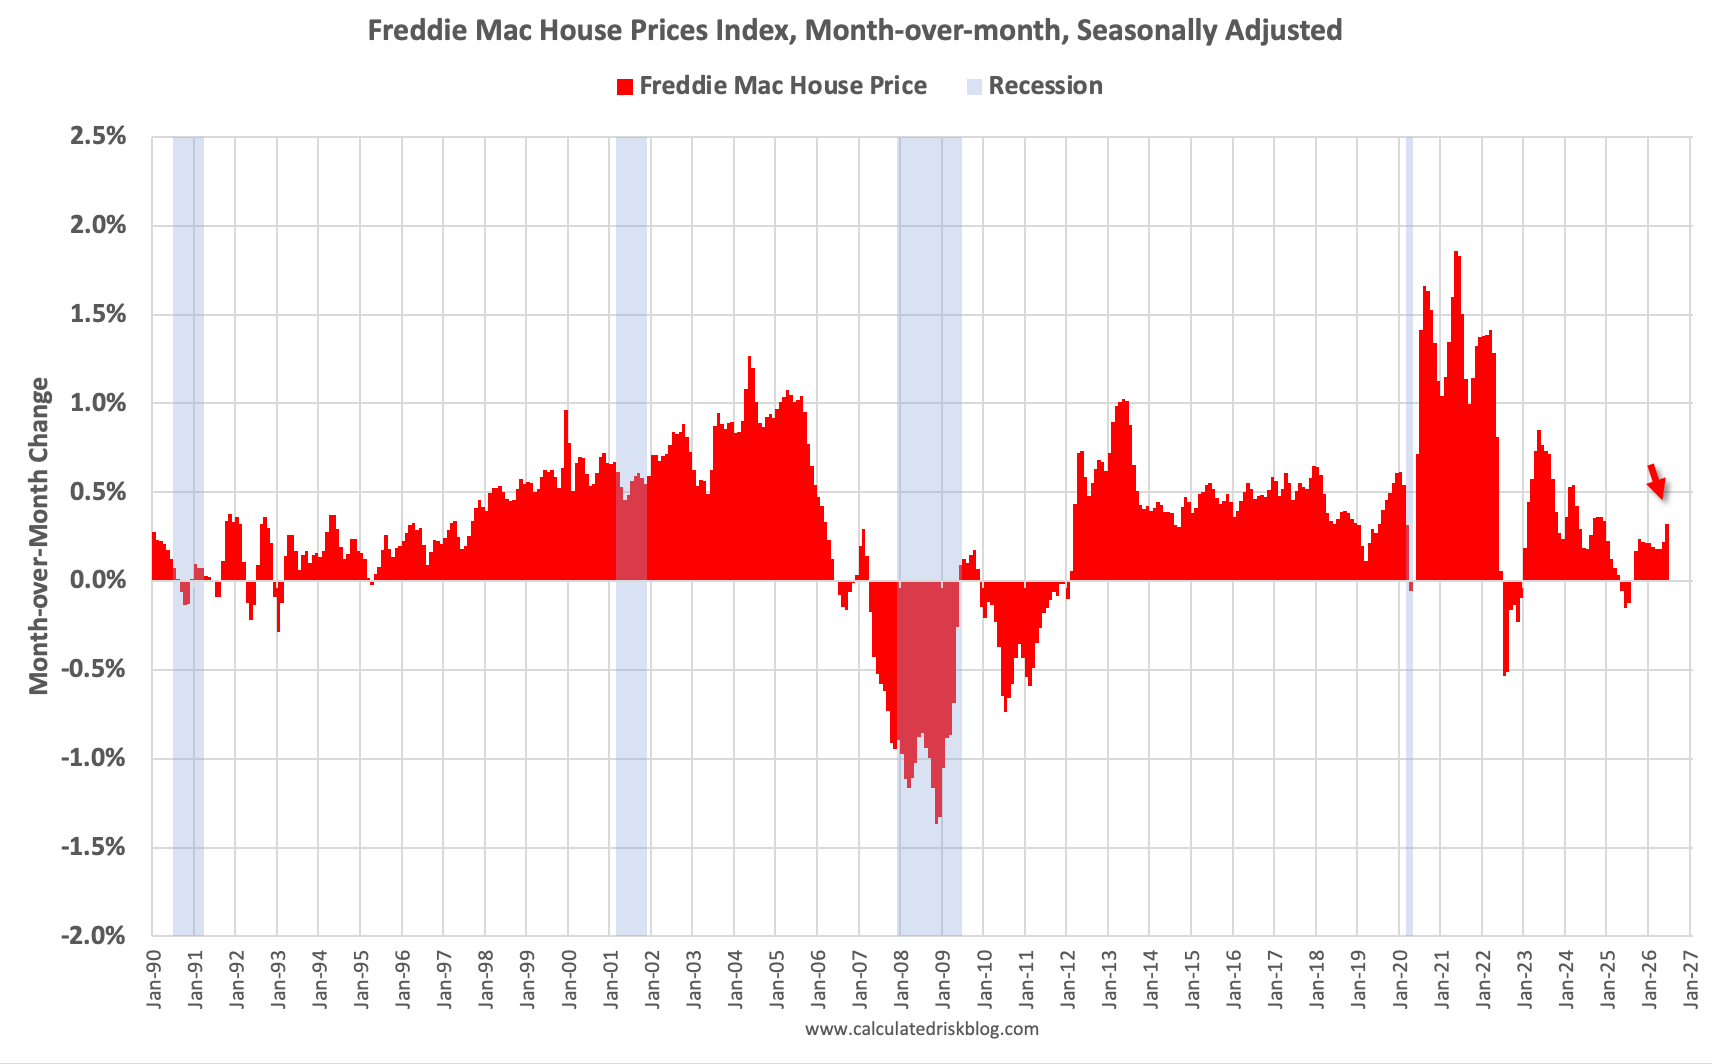
The seasonally adjusted FMHPI increased 0.32% MoM on a seasonally adjusted (SA) basis in May.
Last year, the FMHPI decreased slightly in both May, June and July, so the year-over-year change next month will likely be about the same or slightly higher as in June.
As of June, 14 states and D.C. were below their previous peaks, Seasonally Adjusted. The largest seasonally adjusted declines from the recent peaks are in D.C. (-3.4%), Colorado (-2.4%), Washington (-1.6%) and South Carolina (-1.2%).
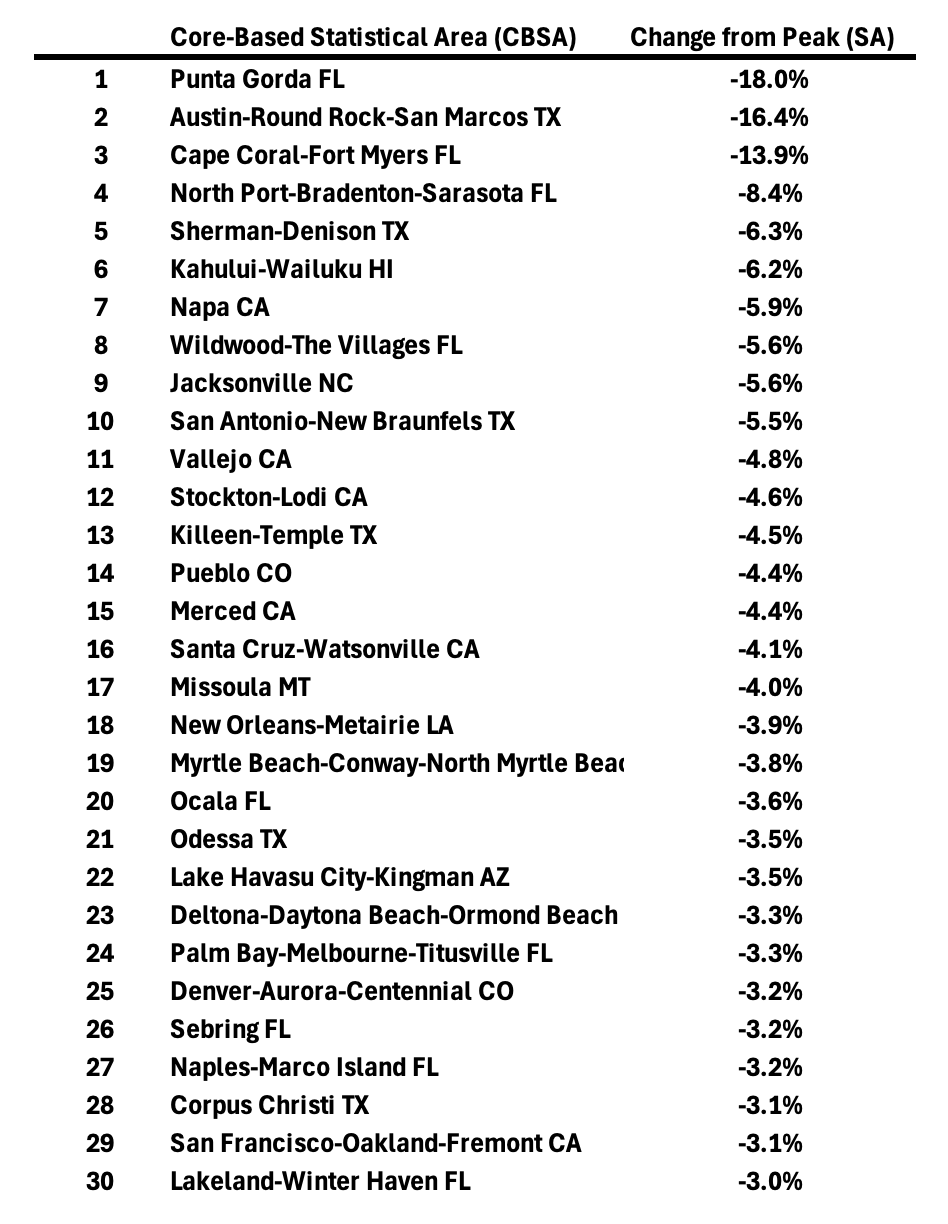
For cities (Core-based Statistical Areas, CBSA), 128 of the 387 CBSAs are below their previous peaks.
Here are the 30 cities with the largest declines from the peak, seasonally adjusted. Punta Gorda, Austin and Cape Coral has seen double digit price declines. Note that the top 5 cities with the largest price declines are in Florida and Texas.
Here is a comparison of year-over-year change in the FMHPI, median house prices from the NAR, and the Case-Shiller National index.
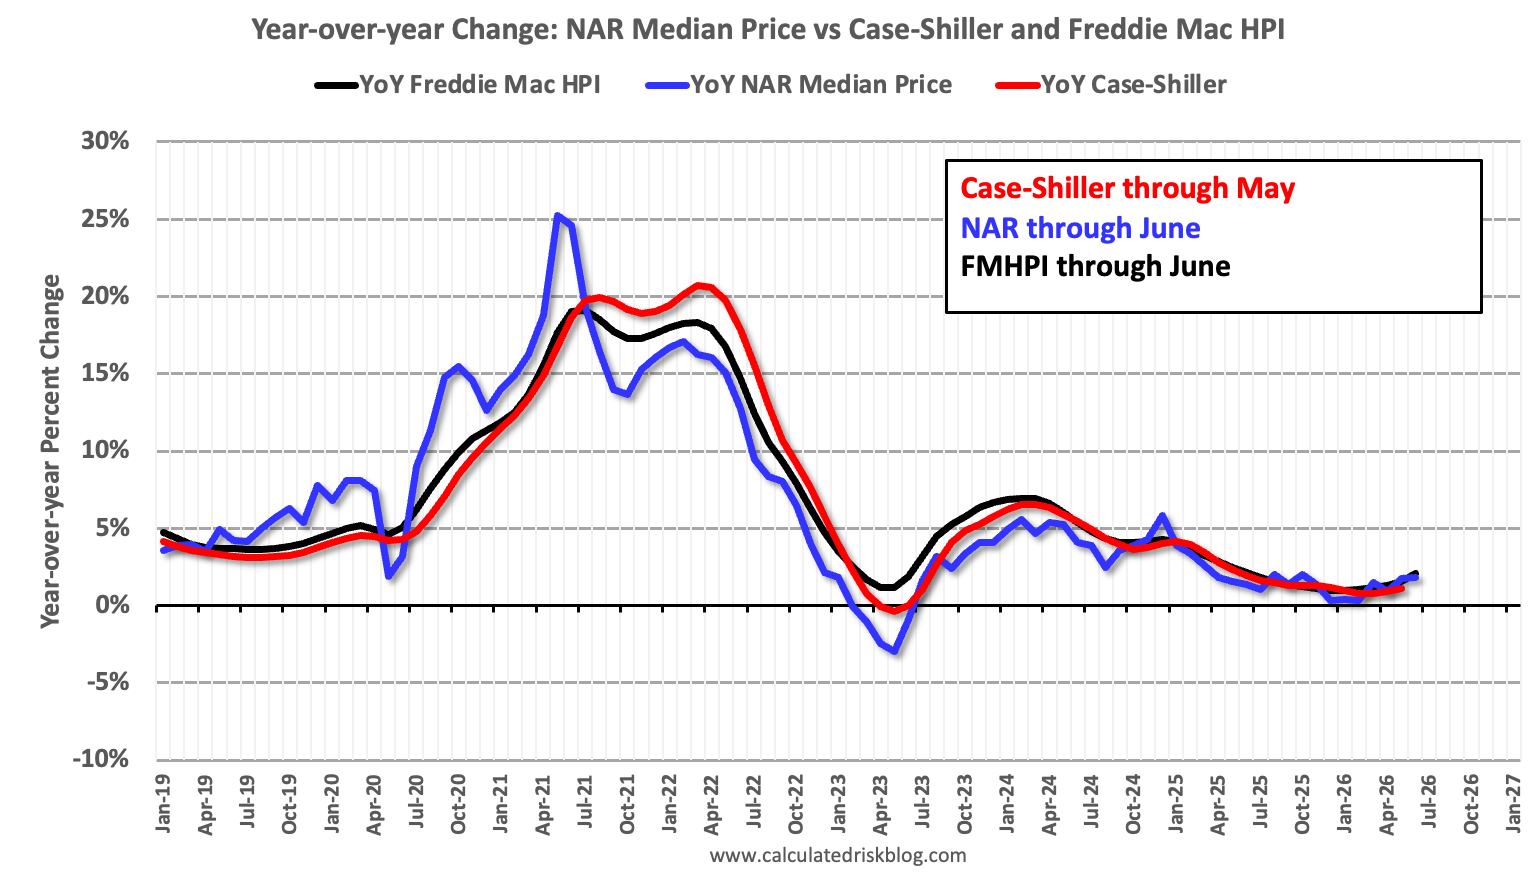
The FMHPI and the NAR median prices (up 1.8% YoY in June) appear to be leading indicators for Case-Shiller. The Case-Shiller index was up 1.1% YoY in May. The FMHPI is suggesting the Case-Shiller index will likely be up slightly more year-over-year in the June report compared to May.
Since inventory increased in 2025, while sales matched the lowest level since 1995, national house price growth (year-over-year) slowed. However, inventory growth has slowed recently, and there are also significant regional differences.
Thanks for reading CalculatedRisk Newsletter! This post is public so feel free to share it.
Comments
Nothing yet. Say the first thing.
Sign in to join the conversation.