
Full image is below in the body of the article
[image substituted 8/24/2026 - no changes in the numbers; first bar was not in scale]
A NOTE FROM THE AUTHOR
Because your property tax bill does. The policy, the planning, the zoning, the construction, all of it sits downstream of one decision. So does who ends up owning the outcome of the decisions that city planning commits to, a renter, a family buying a home, a small local investor, or a large investment fund. The cost and debt of those municipal obligations are ultimately underwritten by the property itself, through the property taxes each of them is obligated to pay. Nashville-Davidson is barred by state law from charging growth for its own infrastructure, so when the city over-forecasts for more future than arrives, the cost of building and maintaining that infrastructure lands in exactly one place, and it is not on the developer, particularly in today’s deregulatory environment.
There is an irony worth naming before the numbers start. The political label attached in recent history to Nashville’s zoning code, “Byzantine,” circulates in a national reform script written for any city. The record says something different about what this city’s code produced. A September 2024 Mercatus Center study counted at least 20,125 homes built across Davidson County since 2010 under one state law alone, the Horizontal Property Regime (the ownership law behind Nashville’s “tall skinny” boom), a majority of all single-family homes delivered in the county most years since 2016, and found Nashville second only to Houston in absolute terms, and first per capita, among the nation’s fifty largest metros for recently built single-family homes for sale within five miles of the central business district. The same decade, a fifty-year national study ranked Nashville first in the country for gentrification intensity. Under its supposedly limiting and impenetrable code, Nashville led the nation in building pace and led the nation in displacement at the same time. The sound bite is sweet. The record bites back.
When I say it is possible to over-zone Nashville, people look at me cross-eyed. But here is the reality: no one, no record, and no headline can tell us what the actual housing target is. I have asked, officially and on the record, for more than a year, with no answer. So how could anyone answer that question in an informed way?
How many years can a city say ninety thousand before it has to tie the number to an actual sum? Think of a church capital campaign. The committee sets the goal, say three million dollars, and from that Sunday forward every update reports two numbers: what has come in and what remains. The thermometer in the lobby exists to subtract. Nashville’s campaign has no thermometer. The city has said ninety thousand out loud for more than a year, and its own strategy has carried the number longer, without crediting a single home already built and without anchoring progress to the total needed in housing units. So this series is an effort to set the target, because no one else has or apparently will.
Once you set a target, you test it. The UHS itself grounds a target for households, and with elementary math plus the conversion functions its own Appendix B (the UHS population appendix) provides, anyone can calculate their way to the answer. I test empirically on the front end, to see whether the big rocks sit where the plan says they sit. My finding is that they do not, and the answer splits into two scenarios depending on a question the podium’s 90,000 never answers. Thank goodness there is a Census, which answers with a date and a firm count of the homes actually standing.
One more thing, so the ground rules are visible. I am both an analyst and an opinion writer, in a specific field, and in this matter not an ordinary subject matter expert but a front-row participant and witness to the emergence of New Urbanism, zoning reform, and the branding of the Missing Middle. The skills from those decades run the whole life of a project: deciding whether to build at all, deciding how and what to build, building it, starting it up, and keeping it running for the people who inherit it. Job one in this work is to remove the jargon and add common sense. I call the result civic sensemaking, and it is what this series does: the meaning lives at the handoffs, where one silo passes its numbers to the next, and my job is to stand at those handoffs and translate. What I am not is an opinion journalist. An opinion journalist does not have to understand the data before perfecting an opinion. My method runs the other way: data review first, peer review second, opinion third, and labeled when it arrives. In this piece, judgment that is mine is written in the first person and labeled. Everything in the record sections carries its citation, every number to its page. You can check all of it.
THE DOCUMENTS THIS PIECE RELIES ON
• The Unified Housing Strategy (UHS). Metro Nashville’s housing plan. Its page 146 states the target: 91,288 net new homes by 2034. Its Appendix B holds the population arithmetic behind that target. Called “the strategy” or “UHS” below.
• The Housing and Infrastructure Study (H&I Study). The March 2025 study, ordered by Council Resolution RS2024-288, that presented the target to the public and promised an infrastructure deliverable for fall 2025. Called “the H&I Study” below.
• The state’s forecast. The University of Tennessee Boyd Center’s official population projections for Davidson County, 2022 to 2070 series, released August 2024.
• The Census. U.S. Census Bureau housing unit counts for Davidson County, Vintage 2025. The only counts, as opposed to models, in this story.
AT A GLANCE
• The target moves. Counted from 2020, the year the UHS’s own arithmetic implies, the target is 91,288 homes. Counted from the housing stock standing when the studies were prepared, the reading the phrase “in the next ten years” implies, it is mathematically 144,065. No document says which.
• The population moves. Metro’s consultant plans for 892,000 residents by 2034. The state’s official demographer projects 790,836. The 101,164-person disagreement is about half the housing target the UHS derives and the H&I Study presents.
• The Census answers. 59,136 homes were added between July 2020 and July 2025. Run the UHS’s own method on the state’s forecast and the whole requirement is roughly 44,000. By the count, that has already been built.
• Nobody can say. On August 4, 2026, a council member asked the status of the infrastructure deliverable promised for fall 2025. Metro Planning’s answer: “I don’t have that information tonight.”
Any target, in any field, has to answer four questions before anyone can plan toward it. From when are we counting? For how many people? Made of what? And who is checking the progress?
Nashville’s housing target is 91,288 net new homes by 2034, rounded to 90,000 in public speech. It has an end date. This piece asks the other four questions, one document at a time, and reports what the record answers.
No document says. The UHS’s own appendix implies the counting starts in 2020, but that starting line is stated nowhere. It has to be recovered by subtraction from the appendix’s population figures. And the choice is not a technicality. Counted from 2020, the remaining work is 91,288 homes minus everything built since. Counted from the housing stock that was standing when the studies were prepared, the same target tabulates to 144,065 homes (not 91,288), because 52,777 homes built between the two starting years fall outside it. Same target. Same end date. A fifty-thousand-home difference, depending on a question the plan never answers.
From the author, in my own voice. What total housing unit count were the infrastructure study consultants given as their target, and what were they scoped to analyze? A scope should carry an actual total, not an unanchored count of how many more. Did anyone ask them these questions? Has anyone read the Unified Housing Strategy carefully enough to know this is a problem? Both of my arms have been raised for over a year, officially and on record.
Here two governments disagree. The UHS’s consultant projects 892,000 residents in Davidson County by 2034. The State of Tennessee’s official demographer projects 790,836 for the same county in the same year. The two forecasts disagree about 101,164 people. Run that disagreement through the strategy’s own arithmetic, its own household size, its own vacancy allowance, and it accounts for about half the housing target. Half the finish line rests on a population number the state does not recognize.
The UHS sorts its first 45,000 homes, the checkpoint it sets for 2030, into seven income bands, and stops. Two in five of those homes are demanded by households earning at or below 50,000 dollars a year. For the remaining 46,288 homes, the years from 2030 to 2034, no income breakdown exists anywhere in the document. The strategy never says whether the shape continues, and never says it does not. So even if the county hits the number, no one can say from the plan itself whether it hit the need.
On August 4, 2026, the Metropolitan Council held a public hearing on BL2026-1416, a contextual overlay regulating the scale of new construction in a District 10 neighborhood. During that debate, Council Member Tasha Ellis asked the planning table a larger question: where is the infrastructure plan that was requested alongside the H&I Study? The department’s representative answered: “I don’t have that information tonight, but I can check and get back to the Council.” That deliverable was promised for the fall of 2025. Eleven months past the date, the department at the council table could not say where its own study stands. The next member recognized was the overlay’s own sponsor, Council Member Jennifer Webb, who told the chamber that “a lot of … this neighborhood is still on septic and can’t be built high density at this point,” and requested the roll call. The vote was taken. Status unknown, septic noted, overlay advanced, inside about ninety seconds of a single meeting.
Four questions. Four silences.
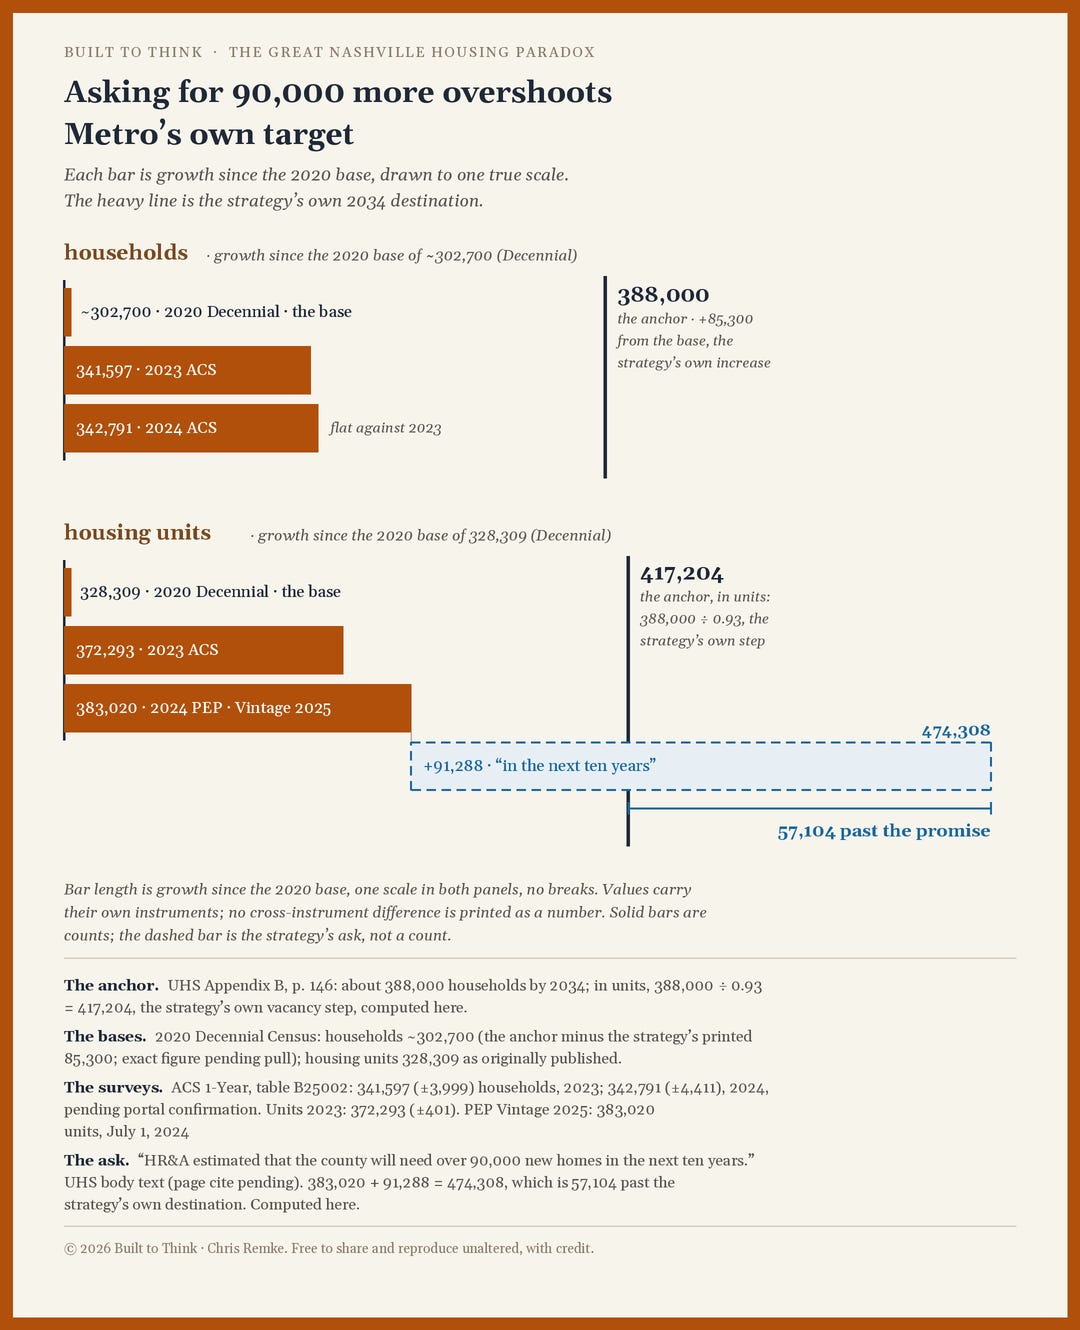
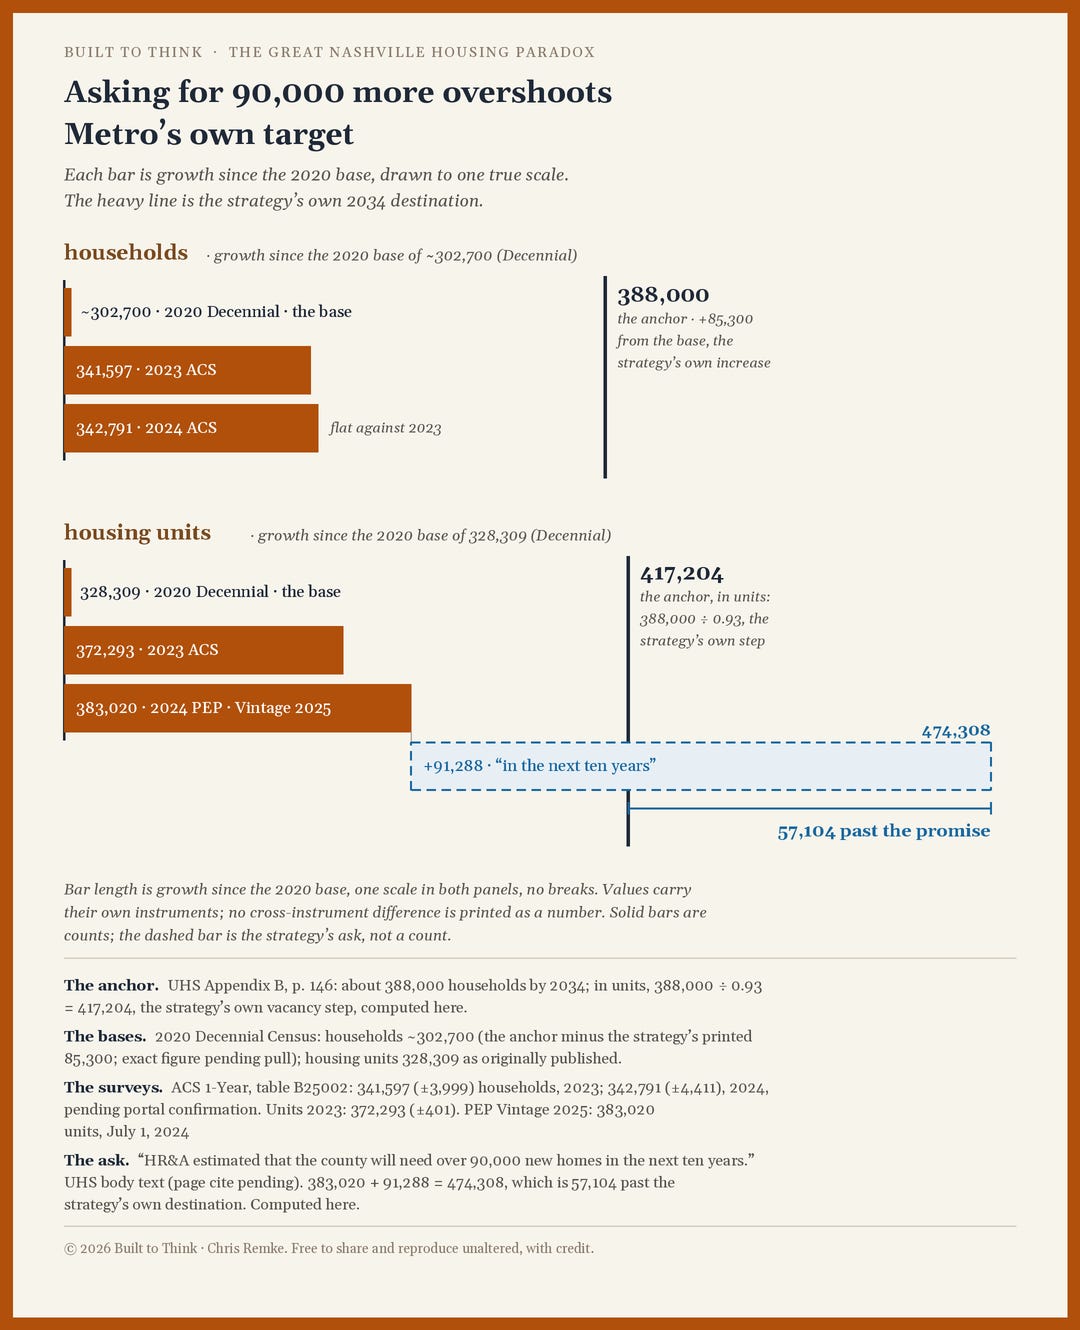
There is one party in this story that answers questions with counts instead of models: the Census. It counted 330,243 housing units in Davidson County in July 2020 and 389,379 in July 2025. That is 59,136 homes added since the starting line the strategy’s own arithmetic implies. And here the record produces a sentence that should stop the room. Run the UHS’s own method on the state’s population forecast and the requirement comes out near 44,000 homes (as opposed to 90,000), counted from 2020. The Census says more than that has already been built. On the state’s forecast, read by the strategy’s own arithmetic, the work is not merely ahead of schedule. It is done. One caution belongs on that sentence: the UHS counts net new homes and the Census counts housing units, and neither figure has been adjusted to match the other. But a gap of that size does not survive on a bookkeeping difference. And the same survey answers on the household side too: 341,597 households in 2023, then 342,791 in 2024, statistically flat year over year, with the 388,000 destination sitting some 45,000 beyond the newest measurement.
State the same facts as destinations instead of increments and the picture sharpens. Metro’s own figures imply a 2034 destination: 388,000 households, through its own conversion, is 417,204 housing units. The state’s forecast, run through the identical conversion, implies about 369,700. The Census counted 389,379 units standing in July 2025. Read those three numbers together. On the state’s forecast, the county already holds roughly 20,000 more homes than the method needs in 2034. On Metro’s own forecast, the remaining need from today is about 27,800 homes, not 90,000. And the podium reading, 91,288 more homes on top of the stock standing when the studies were prepared, builds to 474,308 units, overshooting Metro’s own stated destination by more than 57,000 homes. The plan’s loudest number cannot reach the plan’s own finish line without passing it.
The whole record, measured from the promise. Every bar ends at its true value; the open space to the anchor line is the distance still claimed; the dashed bar is the strategy’s ask. Sources printed on the card.
The second image below is the 388,000 anchor publication from the UHS

In my judgment. Here I step out of the record and speak from forty-plus years in this field, labeled as promised. When the infrastructure half of the H&I Study finally appears, five questions will tell you whether it is real. Will it be a legitimate condition report, showing remaining life expectancy, capacity, and deferred maintenance, priced? Will it be prepared by qualified engineering firms that understand the systems being studied and have run the future capacity analytics, or assembled into conceptual speculation by generalists with a few attached resources and a thumb in the air? Will it assess the load today’s population already places on those systems, and the additional capacity being opened by aggressive upzoning? Will it state who it is sized for, Metro’s 892,000, the state’s 790,836, or some third population no document has published? And will it price from the real world, cost histories and housing comps, including the fifteen years of densification, lot splits, and missing middle already on the ground here, rather than from hypothetical modeling in a design lab? A study that cannot answer those five is not an infrastructure study. It is a brochure. That is opinion, and I own it. The record’s contribution is narrower and harder: as of this month, nobody at the council table could say whether the study exists at all. . And one more piece of work is coming, because the decade’s two rankings, first in building pace and first in gentrification intensity, sit in the record side by side, unreconciled: the market’s delivery ledger against the county’s demand ledger, line by line. That is its own paper.
And one more computation, conditional and labeled. If the target is read the way the podium delivers it, counting forward from the stock standing when the studies were prepared, the total additions from 2020 to 2034 come to 144,065 homes. If the population runs as the state forecasts, the total need over the same span, by the UHS’s own conversion, is about 44,000. One subtraction, one frame: the plan prepares for roughly 100,000 living units beyond the need. Infrastructure capacity sized to the podium reading is sized for all of it. That, in my opinion, is what over-zoning looks like in numbers.
Which brings the question back to planning, where it started. A study is scoped to a target. An infrastructure plan is sized to a demand. A budget is built to a forecast. When the target cannot be anchored, everything scoped to it inherits the drift, and the drift is not free. Nashville is statutorily barred from charging growth for its own infrastructure; the County Powers Relief Act closed that tool in 2006, and the courts have since closed the workarounds. Whatever gets designed, zoned, and eventually built beyond the need lands where unfunded obligations always land, on the general fund, and from there on the property tax bill and fees. Meanwhile Metro’s own capital planning for the current year describes a creeping backlog of maintenance and infrastructure projects, and residents at the same August hearing told the council their neighborhood is “changing way too fast for infrastructure.” Every dollar spent preparing for residents the state says are not coming is a dollar not spent on the sidewalks and sewers of neighborhoods that are already dense today.
None of this requires anyone’s motives. It requires only the documents, and the documents describe a government spending heavily to plan toward a number it has never anchored, while the study that would test whether the number can be served has, so far, no stated status. The fix is not dramatic. State the destination: the number of homes Davidson County should hold in 2034. State the year the counting starts, so that progress is subtraction. Publish the population base and reconcile it with the state’s. Publish the income distribution for the whole target, not half of it. Publish the infrastructure study, or its status, in writing.
Until then, the finish line moves every time someone opens a different page.
Who is representing the community?
Next week: the companion cards behind this one, the start-year fork, the two forecasts, and the income split, published as their own set for readers who want each finding one card at a time.
SOURCES
• The target. UHS, p. 146: 91,288 net new homes by 2034, about 9,000 annually.
• The starting line. Stated in no document; implied as 2020 by UHS Appendix B’s population arithmetic, recovered by subtraction.
• The two readings. Counted from 2020: 91,288. Counted from the July 2024 stock: 144,065. Difference: 52,777 homes built between the starting years. U.S. Census Bureau, Vintage 2025: 330,243 units (July 2020), 383,020 (July 2024).
• The two forecasts. UHS Appendix B: 892,000 residents by 2034. UT Boyd Center, 2022 to 2070 series (released August 7, 2024): 790,836. Difference: 101,164 people, about half the target through the strategy’s own conversion (household size 2.3, 7 percent vacancy allowance).
• The income stop. UHS p. 146, Figure 32: 45,000 homes by 2030 sorted into seven income bands; 18,000 demanded at or below 50,000 dollars a year. No breakdown exists for the remaining 46,288.
• The status question. Metro Council meeting, August 4, 2026, approx. 2:06:00, during BL2026-1416 second reading: CM Tasha Ellis (District 29) asks the status of the infrastructure plan requested alongside the H&I Study. Metro Planning staff: “I don’t have that information tonight, but I can check and get back to the Council on that.” Deliverable originally promised for fall 2025.
• The septic remark. Same meeting, immediately following the Ellis exchange: CM Jennifer Webb (District 10, bill sponsor): “a lot of … this neighborhood is still on septic and can’t be built high density at this point,” followed by her roll call request; second reading passed 21-7-2. Hearing witness Pamela Honavar: “changing way too fast for infrastructure.”
• The already-built count. Census Vintage 2025: 389,379 units in July 2025, or 59,136 added since July 2020. The UHS method applied to the state’s forecast yields roughly 44,000 homes from 2020. Ledger note: the UHS counts net new homes; the Census counts housing units; neither is adjusted to the other.
• The destinations. Computed here from stated figures: Metro, 388,000 households (UHS) through its own conversion, 417,204 units by 2034; the state’s 790,836 residents through the identical conversion (household size 2.3, 7 percent vacancy allowance), about 369,700 units; the podium reading, 383,020 units (July 2024 stock) plus 91,288, is 474,308. Census Vintage 2025: 389,379 units standing July 2025.
• The household survey. U.S. Census Bureau, ACS 1-Year, table B25002, occupied housing units: 341,597 (±3,999), calendar 2023, released September 2024; 342,791 (±4,411), calendar 2024, released September 2025, pending portal confirmation against the Bureau’s own table.
• The funding bar. County Powers Relief Act of 2006, T.C.A. 67-4-2901 et seq.: Davidson County may not levy impact fees or adequate facilities taxes. Metro’s FY2026 capital planning describes a creeping backlog of maintenance and infrastructure projects.
• The production record. Gardner and Pemberton, “Tennessee’s HPR Law and Its Transformation of Nashville’s Housing Market,” Mercatus Center at George Mason University, September 2024: at least 20,125 HPR homes built 2010 to 2023, 52 percent of all single-family homes built in the county in that window; Nashville second to Houston in absolute terms and first per capita among the 50 largest metros for single-family homes built 2010 or later and listed for sale within five miles of the central business district (July 2024 Zillow data).
• The gentrification ranking. NCRC fifty-year national study (May 2025), Metro Rankings: Nashville ranked as having the greatest intensity of gentrification in the nation, 2012 to 2022.
© 2026 Built to Think · Chris Remke. Free to share and reproduce unaltered, with credit.
About Built to Think · Chris Remke, AIA [lic. ret.]
Built to Think is a working laboratory for civic sensemaking, founded by Chris Remke
It follows evidence across the full life cycle of place-building, from public promises and development rights through finance, design, construction, operations, market price, infrastructure, taxation, and neighborhood life. Built to Think follows not only what a decision says, but what it sets in motion.
Original text, analysis and tables © 2026 Chris Remke, Built to Think. Quotation with attribution and a link is welcome and encouraged. This file is provided for the personal use of the paid subscriber; republication in whole or in substantial part, in any medium, requires written permission. Government documents and figures reproduced here for purposes of review are cited in full and remain the property of their sources.
Decode the City. Stay Informed.

click image for link
No posts
Comments
Nothing yet. Say the first thing.
Sign in to join the conversation.