
Hey Friends🖐️
I recall coworkers at Tesla discussing a story about when Elon Musk met with a group of product leaders. He stopped talking, walked the quality executive to the side, and then returned alone to the manager meeting. The quality leader was fired on the spot. This was after a routine yard walk revealed a seal sticking out of a Model S. While Tesla still has considerable work to improve their product quality issues, this (alleged) incident taught me how seriously product-obsessed leaders take nonconformities.
My recent articles have been indexing on hardware product vision and strategy. And while that’s what we focus on as product managers, I realize I’m deviating from topics about actually building and shipping hardware. Today I want to get back to that and discuss arguably the most underrated aspect of HW product making: quality. It’s not exciting. No one dreams of being a quality inspector or engineer. But I like to think of it as a philosophy that’s not limited to any team or person. Being quality-centered is vital to building world-class products.
Have you ever wondered why there are people who own perfectly functioning 30-year-old Corollas? Or why Apple’s products last so long? At Apple, I worked on an issue where a part was out of spec by a few 100 microns. For reference, the average human hair is 80 microns. 99% of customers wouldn’t even notice such a problem. Yet our team worked for weeks, presenting to directors and VPs. There’s a saying in quality systems that 99% yield and 1% defects still deem a product to be 100% unacceptable for the customer who received the non-conforming unit.

The most effective form of quality control is to prevent the issue before it happens. The best way to ensure quality is through defining the right requirements, good product design, robust process development, and detailed risk analysis studies. One philosophy that highlights this is Poka Yoke. This is a Japanese term that translates to “Error Proof”, indicating that products should be designed with error prevention in mind. Two prevention tools can help with this mindset.
Failure Mode Effects Analysis (FMEA) is a risk analysis tool that evaluates potential problems, effects, and detection mechanisms. After reviewing these variables, a risk priority number (RPN) is given to rank designs from highest to lowest.
This is a living document that starts at the design phase, ideally before prototypes are made. It should be updated through each engineering build and production phase (EVT to MP).
Take it from someone who has worked on critical FMEAs for airbags in automotive and batteries in consumer electronics, it’s always worth the extra effort to think through how a design can fail when in customer use. Below are some key terms:
Failure Mode: How a product, design, system, or feature can fail.
Example: A smart home camera has thermal issues during operation.
Effect: The consequence of the failure.
Example: Degraded performance, such as delayed video streaming and motion detection.
Severity: How serious the failure is, ranked from 1 (no practical impact) to 10 (safety/regulation breach).
Example: Severity ranking of 7 because of the degradation of a primary feature for users (motion detection) without safety impact.
Cause: The reason for the failure.
Example: Inadequate heat sinking (mechanical) and excessive power draw from edge AI processing on the local chipset (electrical).
Occurrence: The likelihood that the cause will occur, ranked from 1 (unlikely) to 10 (persistent).
Example: Occurrence ranking of 5 due to a moderate likelihood. While components (processor, image sensor, RF module, etc.) do heat up, they are typically not in use for long periods.
Detection: The probability of design or process controls to prevent or detect the failure, ranked from 1 to 10. Note that a lower number is better, meaning that there is a stronger likelihood of stopping the issue from happening.
Example: 6 in this case, because the camera doesn’t have many design controls to stop overheating. It has a small enclosure with minimal air flow.
RPN = 7 x 5 x 6 = 210, thus making this a high risk item for users. This should force engineers to make the design more robust. The team needs to test more usage scenarios, simulate thermal corner cases, review the board layout for hotspots, modify heat transfer controls, and reevaluate their power model.

How do you decide severity, occurrence, and detection values on a range from 1-10? Luckily, there are reference tables with established criteria. Check out the following:
Another, more quantitative technique to prevent users from experiencing defects is to utilize statistical process control (SPC). SPC uses a data-driven approach to eliminate production waste. The goal of SPC is to move from detection to prevention, as companies typically rely on manually inspecting units. However, inspection is reactive and results in excess cost in the long run.

SPC assumes that data is normally distributed. Below are some helpful terms to know when looking at product manufacturing data.
Specification is a quantified product requirement. Anything outside of your specification is a defect.
Example: A phone’s housing needs to be 8 to 12 mm thick or 10 +/- 2 mm.
Upper Spec Limit (USL) is the highest limit in that specification.
In the example above, it’s 12 mm.
Lower Spec Limit (LSL) is the lowest limit in that specification
In the example above, it’s 8mm.
Nominal/Target is the center value of the specification. That is where we want the majority of our data to be.
In the example above, it’s 10 mm.
Common Cause Variation: Regular variation that is always present in a process. It is natural, random, and has a small effect on overall performance.
Example: Gradual tooling wear over time or minor inconsistencies in raw material thickness leading to subtle changes in the phone housing’s thickness.
Special Cause Variation: Atypical events that have a large effect on processes.
Example: A drill bit breaking, causing the tool to go out of alignment, leading to the phone housing being thinner than our design specification.
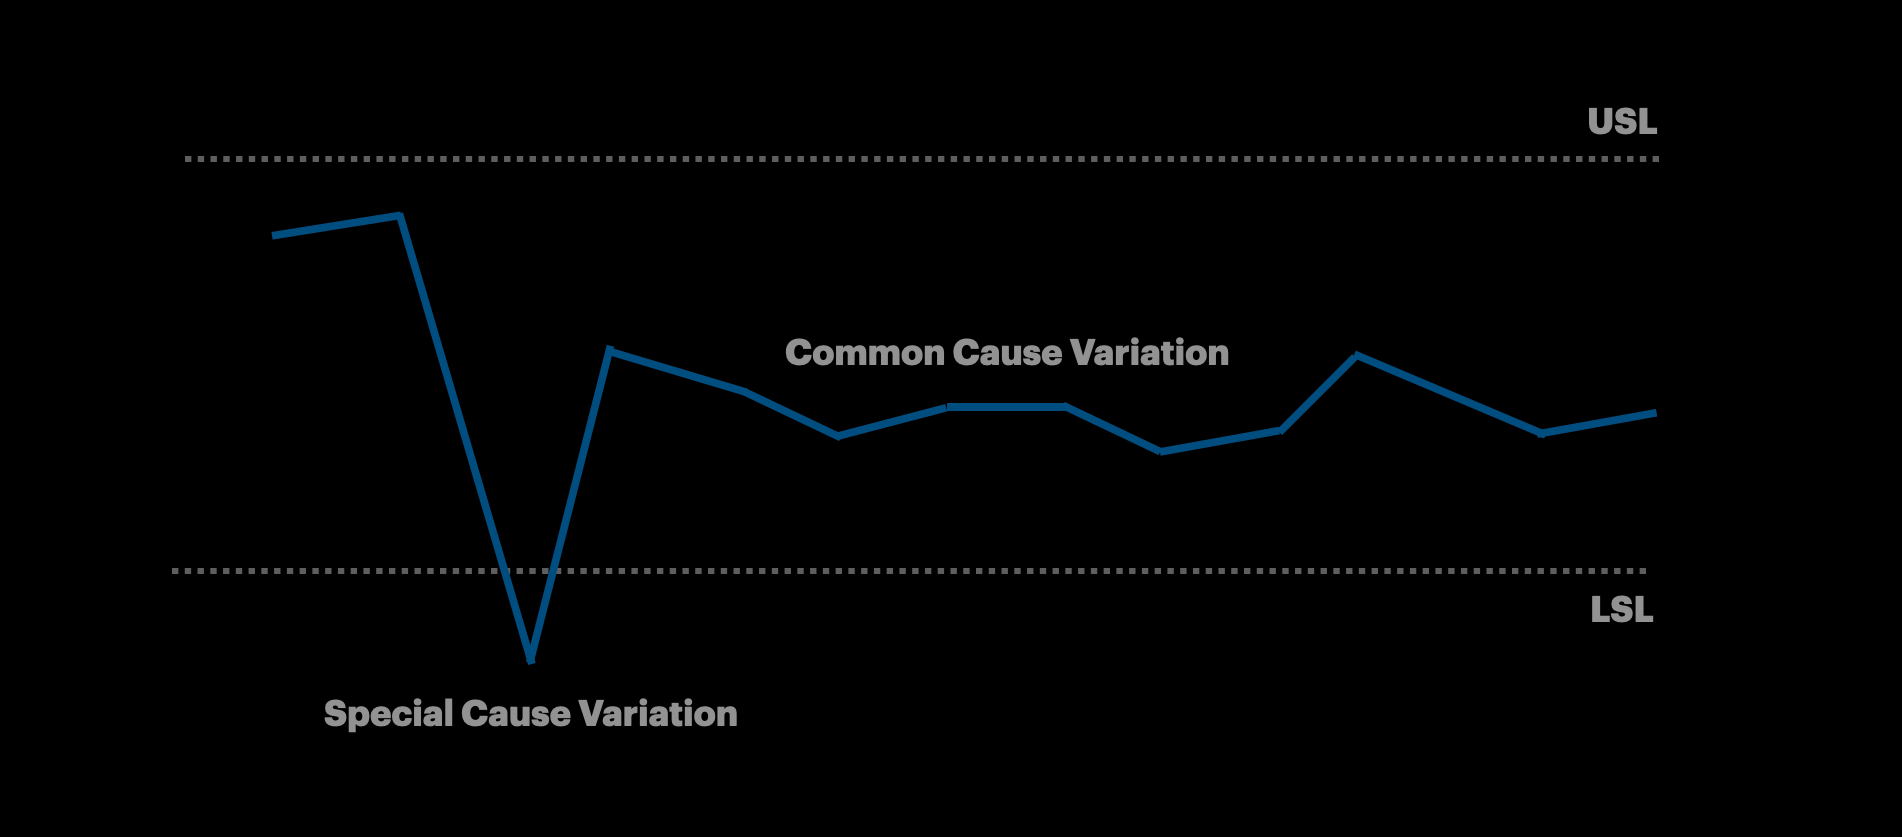
Capability is the ability of your process to produce parts within specification.
The two most common capability performance metrics in SPC are Cp and Cpk.
There is some math that goes into calculating these. Since my newsletter serves as a high level intro to building hardware, I don’t want to get into the technical details to avoid intimidating readers. After all, the whole point of starting this newsletter was the decrease the barrier to entry of building physical products.
Check this link out if you want to learn more about how they’re calculated.
A very simple way is to imagine that Cp is how close the data points are to themselves (proximity). Cpk is how close the center of your data is to the target/nominal value.

Why does any of this matter? Its because Cp/Cpk values correlate directly with the amount of defective parts you send to end users. In general, the higher the Cp/Cpk, the lower the amount of bad parts. Typically, a cpk below 1 means that you’re in trouble and parts are out of spec. You also may be asking yourself “where can I find this data for my production process?” It should be coming from your contract manufacturer or process quality engineers.
Realistically, all issues can’t be prevented. Mistakes happen, things slip, and that’s where tier 2 of quality control comes in. Detection means identifying an issue after parts have been produced. Detection controls stop defects from being shipped out of the factory. They are the most common, expensive, and often least effective line of defense. These controls are established using sampling inspection methods.
There are two types of detection checks. Depending on the complexity of your product, these can be set up at the final assembly line, at the supplier, or within sub-lines. Each check should have controls for both cosmetic and functional nonconformities.
IQC (Incoming Quality Control) focuses on evaluating the quality of components received from suppliers before production. Practically, this means a quality station at the beginning of your assembly line. For example:
An IQC station as the first step when plastic enclosures are received at the contract manufacturer from the molding vendor to check for warpage or knit lines.
An IQC station at the beginning of the main system assembly line where a finished module (speaker, battery, PCB) is received from another sub-assembly line to check for damage, debris, or functionality.
OQC (Outgoing Quality Control) focuses on evaluating the quality of finished products at the end of your assembly line. For example:
A final visual inspection station to ensure there are no scratches on an iPhone display.
A functional tester at the end of the line to ensure all switches power on for a PS5 controller.
A fit and dimensional check to ensure the charging cable can be properly inserted into an Anker battery pack.
Tier 3 is for when an issue slips through detection and prevention controls. How do you solve it? What root cause analysis techniques can be used? There are many tools such as fault tree diagrams, scatter plots, and DOEs (design of experiments). Two of the most practical ones are below.
This is a simple but effective problem solving technique for getting to the root cause of an issue by iteratively asking why defects occur. It doesn’t necessarily need to be “5” levels of why. Here’s an example.

Repeatedly asking why helps pinpoint deficiencies in processes, designs, or even attitudes. I like how it encourages healthy skepticism.
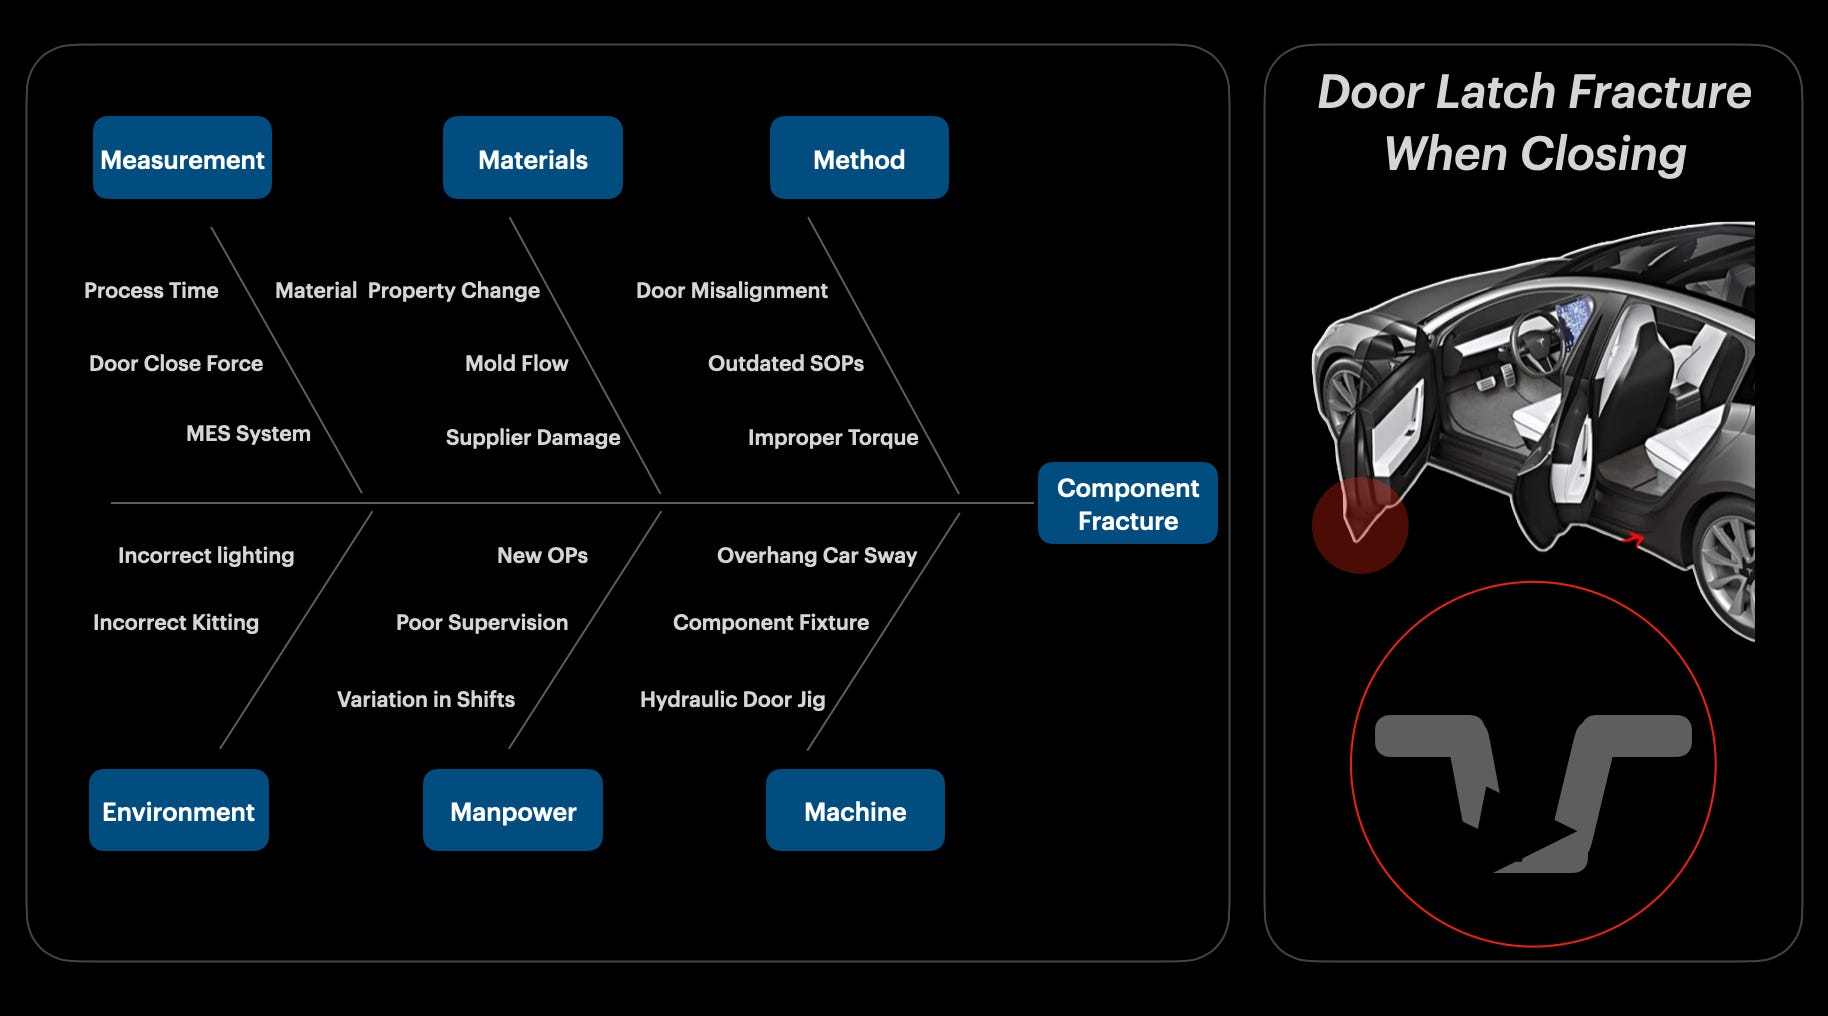
This is a root cause analysis tool that helps break down a problem into potential categories to help structure a team’s investigation. It helps visualize where the source of the issue could be coming from. Typical categories include materials, method, measurement, environment, manpower, and machine.
Sometimes when you’re working on a complex issue, there can be so many variables that it becomes convoluted. Back when I used to work in automotive product development, I was responsible for root causing an issue that had the highest failure rate on our team’s assembly line.
The failure mode was that a plastic latch component was fracturing as the vehicle’s door was hitting the body. At the time I couldn’t figure out why. I audited the manufacturing line to see if there were inconsistencies with fixtures and jigs. I observed morning and night shift operators to inspect for variance in their process. I confirmed parts were designed to spec from the supplier. After making a fish bone diagram I realized I hadn’t given much thought to the material side of things.
It turns out that the material of the latch had been changed for this batch. The new material had properties with lower impact resistance. It slipped through our design change approval process because the team was under pressure to ship product faster. After running some trials I validated this mitigation with a material swap, reducing the failure rate by 74%. Success. All thanks to the power of visualizing the variables at play.
There are many other approaches to product quality. An entire chapter can be written about reliability (rel) testing for example. That involves breaking parts, drop testing, exposing them to long term cycling, and implementing stressful temperature conditions. Regardless of the method, creating a quality centered product development culture shows pride and craftsmanship. That attention to detail is what builds customer trust.

In addition to our articles on Substack, we offer tailored services in HW PM career growth and HW product development from idea to launch.
Make sure you check out some other articles:
No posts
Comments
Nothing yet. Say the first thing.
Sign in to join the conversation.