

“The prevailing view has been that the market will earn a high rate of return if the holding period is long enough, but the entry point is what really matters.”
-Seth Karman
2Q 2026: The Broadening Arrives—Be Careful What You Wish For
Almost three months ago, after the S&P 500 fell 4.6% in the first quarter and snapped a three-quarter winning streak, we reminded readers that stocks rarely move higher in a straight line. The second quarter delivered the other half of that lesson: declines rarely continue unabated either. The S&P 500 and Nasdaq experienced a rapid rebound, posting gains of 14.9% and 21.4%, respectively—their highest since 2020. The smaller company Russell 2000 index, which defied the major indices to post a modest 0.6% gain in the first quarter, continued its climb to reach a new all-time high, finishing the first half up 22%—its best start to a year since 1991.
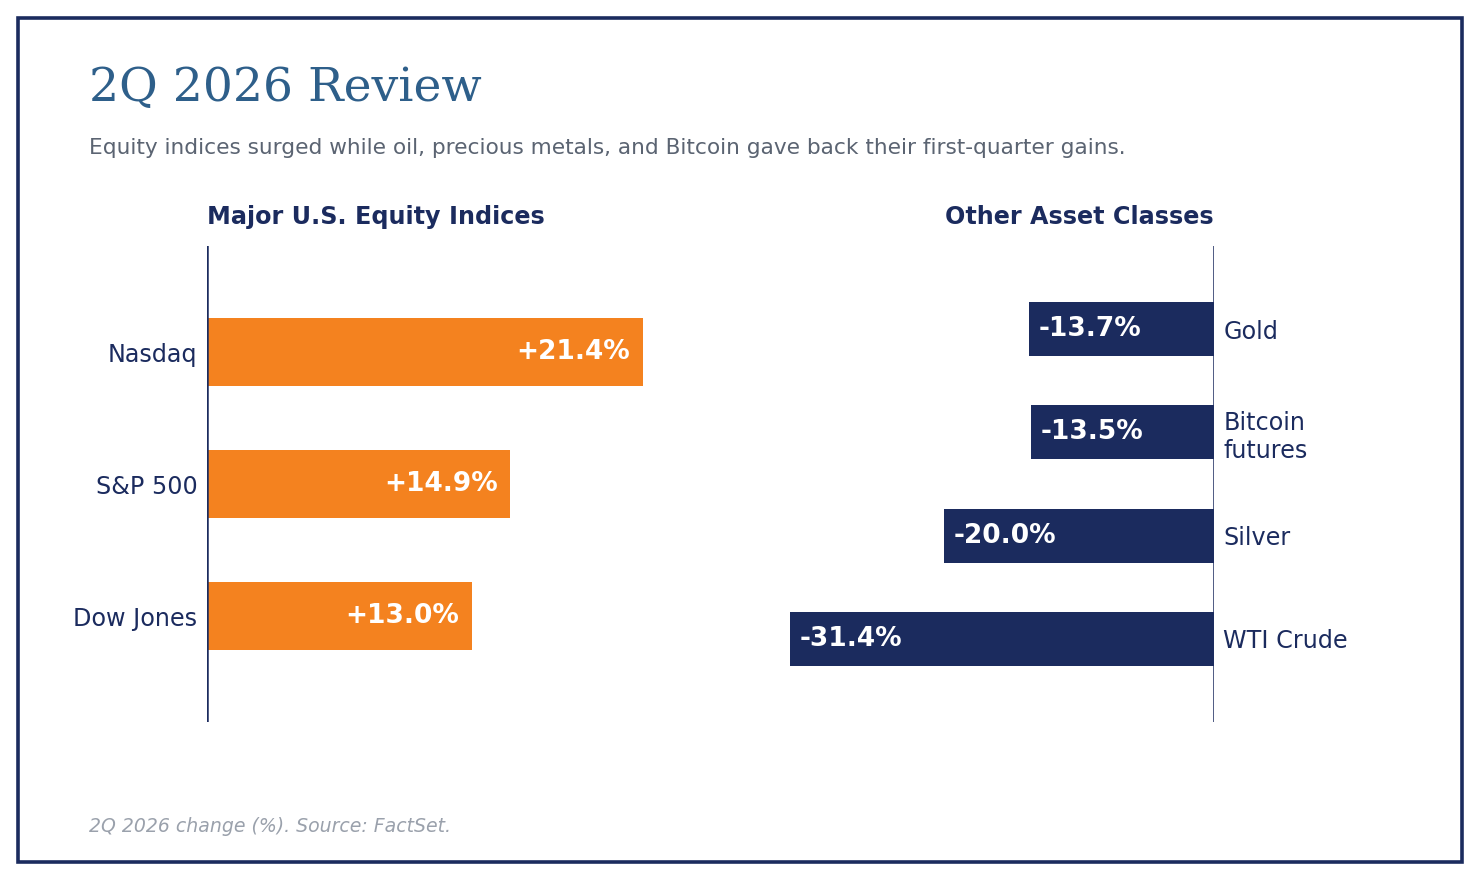
No single factor ever fully explains short-term market moves, but oil prices came as close as any in 2026, fueling the first quarter’s decline on the way up and powering the second quarter’s recovery on the way down. WTI crude, which peaked above $119 per barrel during the Iran conflict, retraced more than 40% and ended the second quarter near $70.
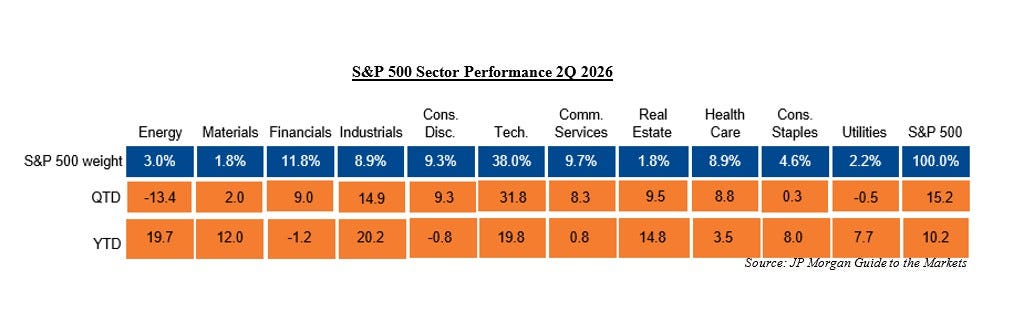
The equity market advance was notably broad. Nine of the eleven S&P 500 sectors rose for the quarter, with only Energy and Utilities declining. Through six months, the only sectors in negative territory are Financials (-1.2%) and Consumer Discretionary (-0.8%). Despite the roughly 14% pullback for Energy, it remains 19.7% higher for the year, making it the third-best performing sector of the first half, narrowly behind Industrials (+20.2%) and Technology (+19.8%).
The Same 500 Stocks—Two Very Different Markets
In our last quarterly letter, we questioned whether market leadership was finally beginning to broaden beyond a handful of technology giants. The first half answered emphatically, though not quite in the way we expected, with declines across the market leaders. The Magnificent Seven shed more than $2.2 trillion of market value in June alone, falling nearly 10% for the month (the group’s worst showing in more than a year). For the first six months of 2026, every Magnificent Seven member except Alphabet trailed the S&P 500, with Microsoft, Meta, and Tesla each declining by double digits.
Notably, the Nasdaq’s best quarter since 2020 was powered by semiconductor stocks and not the technology companies that have driven that index in previous years. Leadership did in fact broaden beyond technology shares—into industrials, energy, financials, and smaller companies—but in some respects the market simply traded one set of perceived AI winners for another.
As we have written in previous letters, the S&P 500 comes in two flavors. In the traditional cap-weighted version, the biggest companies carry the most weight, so a handful of giants do most of the driving. In the “equal-weighted” version, all 500 companies count the same. Because the two hold identical stocks, they have historically moved in near lockstep. Not lately. As CNBC’s Michael Santoli (and, shameless plug, a recent guest on The World According to Boyar) noted, citing Goldman Sachs data, the statistical correlation between the two has fallen to 0.79, the weakest reading in the 25 years for which data exist, versus a long-run average of 0.96 (a reading of 1.0 would mean perfect unison).
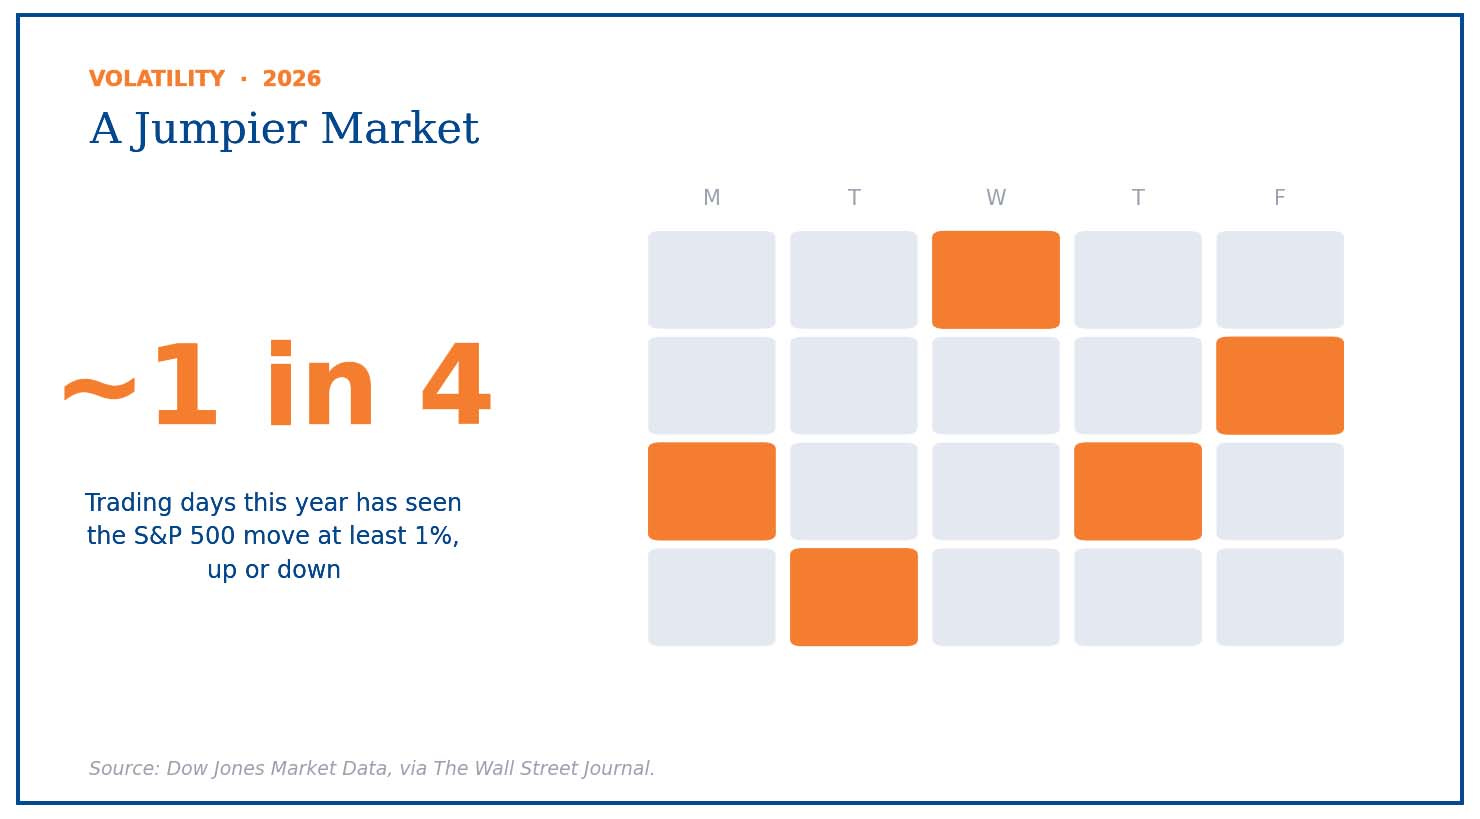
The market has also become more volatile: the S&P 500 has swung at least 1% in more than a quarter of this year’s trading sessions, according to Dow Jones Market Data. Put those together and you have a market that is both more volatile and less unified: the averages lurch around while, beneath them, individual stocks increasingly go their own separate ways. For index investors, that is a new experience. For stock pickers, it is the most interesting backdrop in years: when prices stop moving in unison, being right about which companies you own starts to matter again.
A word of caution before anyone writes the Magnificent Seven’s obituary. From the start of 2023 to the start of 2026, the Magnificent Seven added roughly $15 trillion in combined market value. Betting against these businesses has been a losing trade for the better part of a decade, and six months of underperformance does not change their competitive positions. But as we discuss below, their recent weakness has produced something genuinely unusual, and it involves their prices, not the companies themselves.
A Different Kind of Bubble?
Peter Berezin, chief global strategist at BCA Research, recently observed that artificial intelligence (AI) is indeed in a bubble, but a different kind from the ones investors are used to: with AI, “the bubble is in earnings rather than in valuations.” It is a clever line, and worth unpacking, because it captures both the similarities and the differences from the dot-com era. Start with what is real: the profits. The first quarter marked the sixth consecutive quarter of double-digit earnings growth for the S&P 500. According to Goldman Sachs, 85% of companies reported earnings above Wall Street’s expectations, among the highest readings since 2008, with the typical company growing earnings 13%. Strip out the Magnificent Seven plus the entire technology sector, and the remaining companies still grew profits 10%, well above the roughly 6.5% yearly average since World War II. Compare this to 1999, when investors paid fantasy prices for companies that had no profits at all. Today’s market leaders are producing profits hand over fist. If you believe those profits will keep growing well into the future, then today’s prices look reasonable—attractive, even. Everything turns on that “if.”
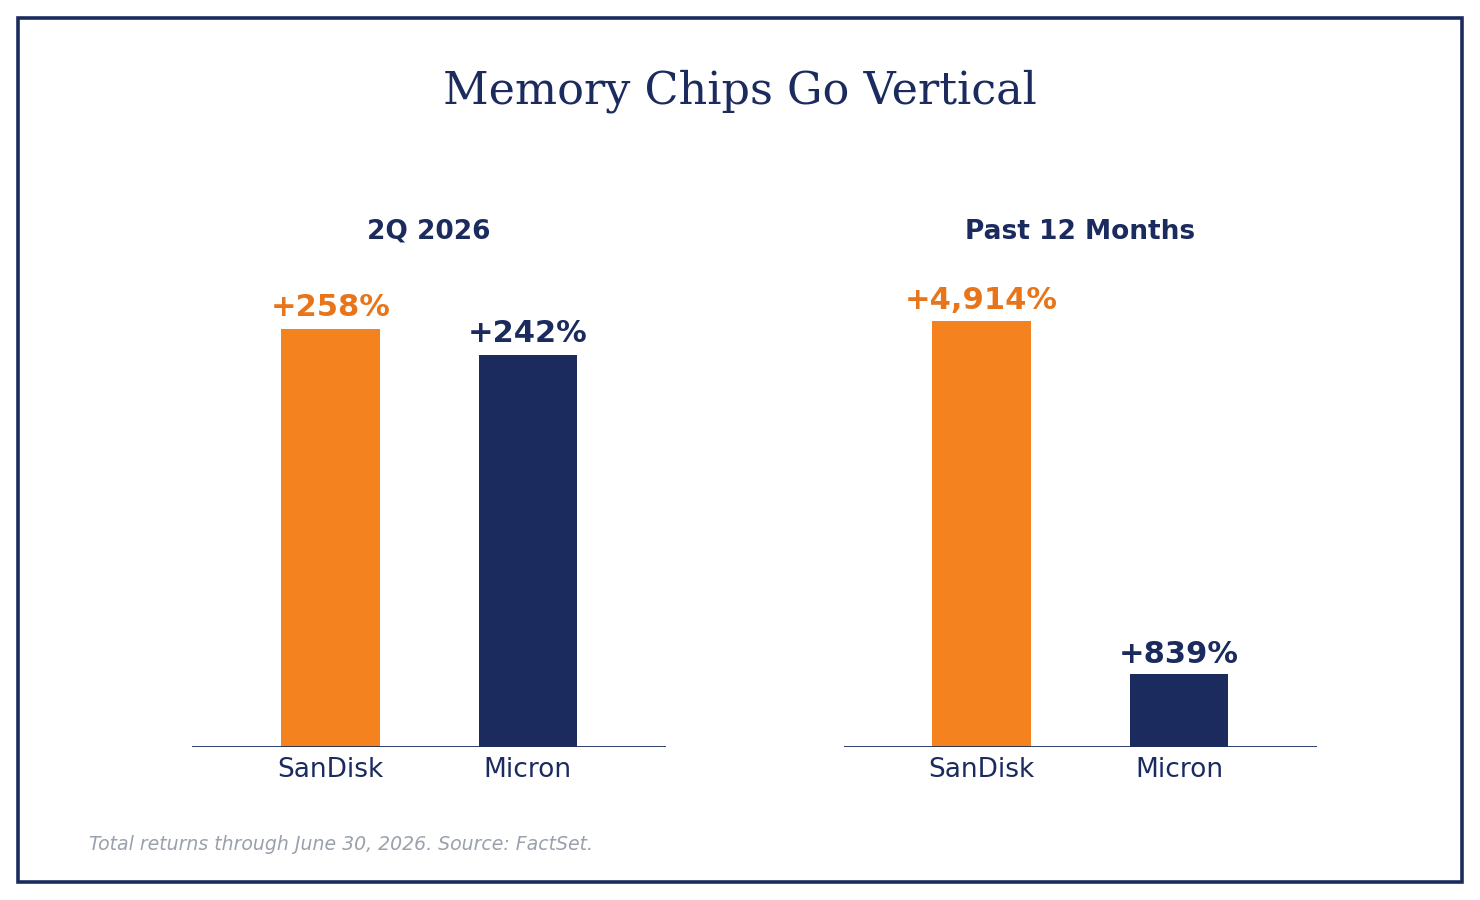
But look where the enthusiasm has pooled. Semiconductor stocks now account for nearly 20% of the entire value of the S&P 500, the highest share on record. Even the small-cap rally has been powered by semiconductor stocks: according to CNBC, chip-related companies accounted for 16 of the 50 best-performing Russell 2000 stocks in the first half of 2026, three of them up more than 400%. The makers of memory chips (the chips that store data rather than process it) have seen their stock prices go parabolic. SanDisk rose 258% and Micron advanced 242% in the quarter alone, making them the two best performers in the index. Over the past twelve months (through June 30), SanDisk is up 4,914%—no, that is not a typo—with Micron up 839%. The
Philadelphia Semiconductor Index, which tracks the group, more than doubled in the first half of 2026 and is on pace for its best year since the dot-com frenzy of 1999, according to the Financial Times. It also moved an average of 4.1% per day in June, and as Michael Santoli has observed, the only months more frenetic have come during bear-market crashes or the violent rebounds that follow them. (In the six trading sessions since the quarter ended, the index has fallen roughly 9% and Micron approximately 16%.)
The market is currently making two opposite bets about whose profits will last. Consider software. For years these were the market’s favorite businesses, and for good reason: they sell products that customers renew year after year, at wonderful profit margins. Those profits have not gone anywhere: most software companies are still growing and still highly profitable. What has changed is the market’s opinion of their future. Investors increasingly worry that artificial intelligence will let customers do for themselves what they currently pay software companies to do, and they have marked the stocks down accordingly: the leading software index fell ~24.0% in the first quarter (its worst quarter since 2008), and despite a strong second-quarter rebound, it remains well below last year’s high and has declined over the past year while the broad market sits at record highs. In plain terms, the market is saying: the profits are fine today, but we no longer trust tomorrow’s.
The memory-chip makers are the mirror image. Investors are not paying outlandish prices for these stocks; relative to what they are earning, many look downright reasonable. Instead, investors are assuming today’s extraordinary profits will continue. That is the assumption we would question. Memory chips have always been a boom-and-bust business: when chips are scarce, prices and profits soar; high profits attract new factories; new factories create a glut; and profits collapse.
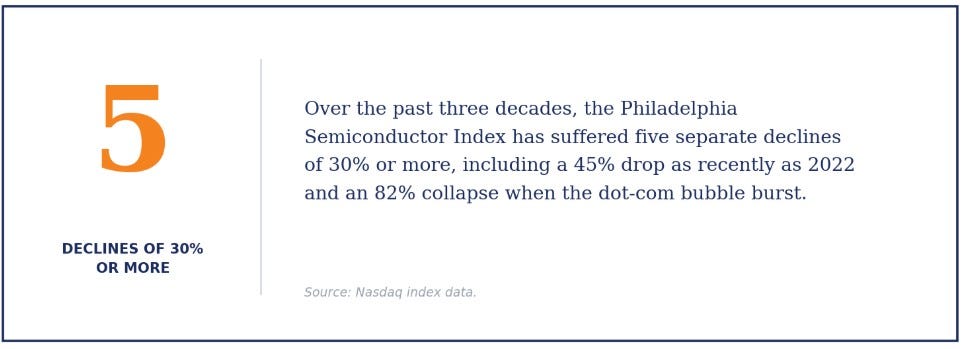
The pattern is not subtle. Over the past three decades, the Philadelphia Semiconductor Index (SOX) has suffered five separate declines of 30% or more, including a 45% drop as recently as 2022 and an 82% collapse when the dot-com bubble burst.
Nvidia, today’s most celebrated company, lost 90% of its value in that bust (although it was a very different company then and investors who held on have been richly rewarded). Investors need to remember that a stock can look cheap against today’s earnings and still prove very expensive—if today’s earnings turn out to be the high-water mark. The Nifty Fifty era taught investors not to overpay for great businesses; this cycle may teach a different lesson about not overpaying for peak earnings.
So, the market has rendered two verdicts: pessimistic on software’s future profits, optimistic on the chipmakers’. If investors prove too gloomy about software, today’s markdowns become tomorrow’s opportunities; if they prove too giddy about memory chips, today’s “cheap” stocks will become expensive in a hurry. Telling the difference (separating temporary dislocations from permanent impairment, as we put it last quarter) is, in our view, the central question in this market.
An Irony Worth Noting
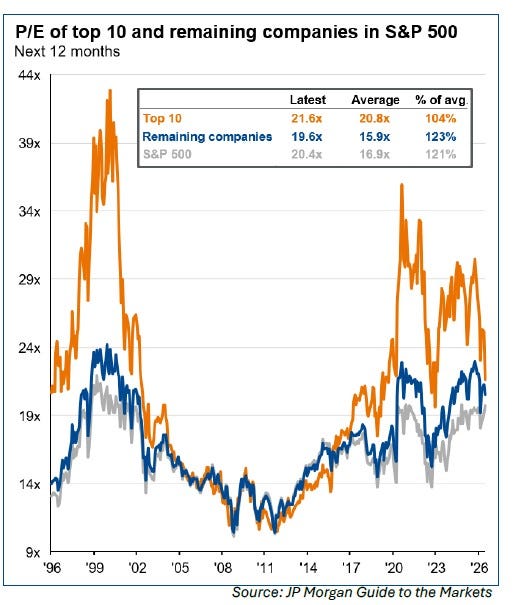
For years, the standard complaint about the American market was that its biggest companies were also its most expensive. That is still true, but far less true than it was. According to J.P. Morgan, the ten largest companies in the S&P 500 now trade at 21.6 times next year’s expected earnings, versus 19.6 times for the other 490: a premium of roughly 10%. Just one year ago, the same ten traded at 28.8 times against 20.7 for everyone else, a premium of nearly 40%. In a single year, falling prices set against rising profits have cut that premium by roughly three-quarters. In fact, the ten largest companies now trade almost exactly at their own three-decade average multiple. Could these stocks get cheaper still? Of course. But for the first time in years, the valuations of the market’s biggest, most familiar, most heavily scrutinized names are starting to become compelling.
We wrote last quarter that Microsoft, priced at its lowest level relative to its earnings since 2018, was becoming increasingly attractive for patient investors. The stock promptly fell further, declining by double digits in June. We will not pretend that has been pleasant. But nothing about the business has changed for the worse: the profits keep climbing; only the price has fallen. And buying good businesses when they are out of favor is, after all, the whole idea.
Microsoft was not the only company we discussed last quarter, however. We also laid out our investment case for Madison Square Garden Sports, owner of the New York Knicks and Rangers, arguing that the stock traded well below what its two franchises would command in a private sale. Since then, the Knicks won their first NBA championship in 53 years (Go New York, Go New York, Go!), and the stock has climbed roughly 20%. Even after the move, the shares still trade below our estimate of its intrinsic value.
A New Hand at the Fed
The quarter also brought a changing of the guard in Washington: Kevin Warsh was confirmed in May as Chairman of the Federal Reserve, and he quickly sounded tougher on inflation than markets expected. At one point, investors began betting that the Fed’s next move might be to raise interest rates rather than lower them. Whether that tough talk lasts remains to be seen (June’s relatively weak jobs report has already softened those expectations), and we would caution against reading too much into any Fed chairman’s opening remarks.
The stakes for the market’s new leadership, however, are real. Bank of America estimates that every quarter-point increase in interest rates would trim Russell 2000 earnings by roughly 2%. The reason is simple: smaller companies tend to borrow at rates that float with the market so when rates rise, their interest bills rise almost immediately (as opposed to larger companies who are able to “lock in” their interest expense with fixed rate bonds). If anything derails the rotation into smaller company shares, rising rates would be at the top of our list.
Small Caps: Still Inexpensive After Their Best First Half Since 1991
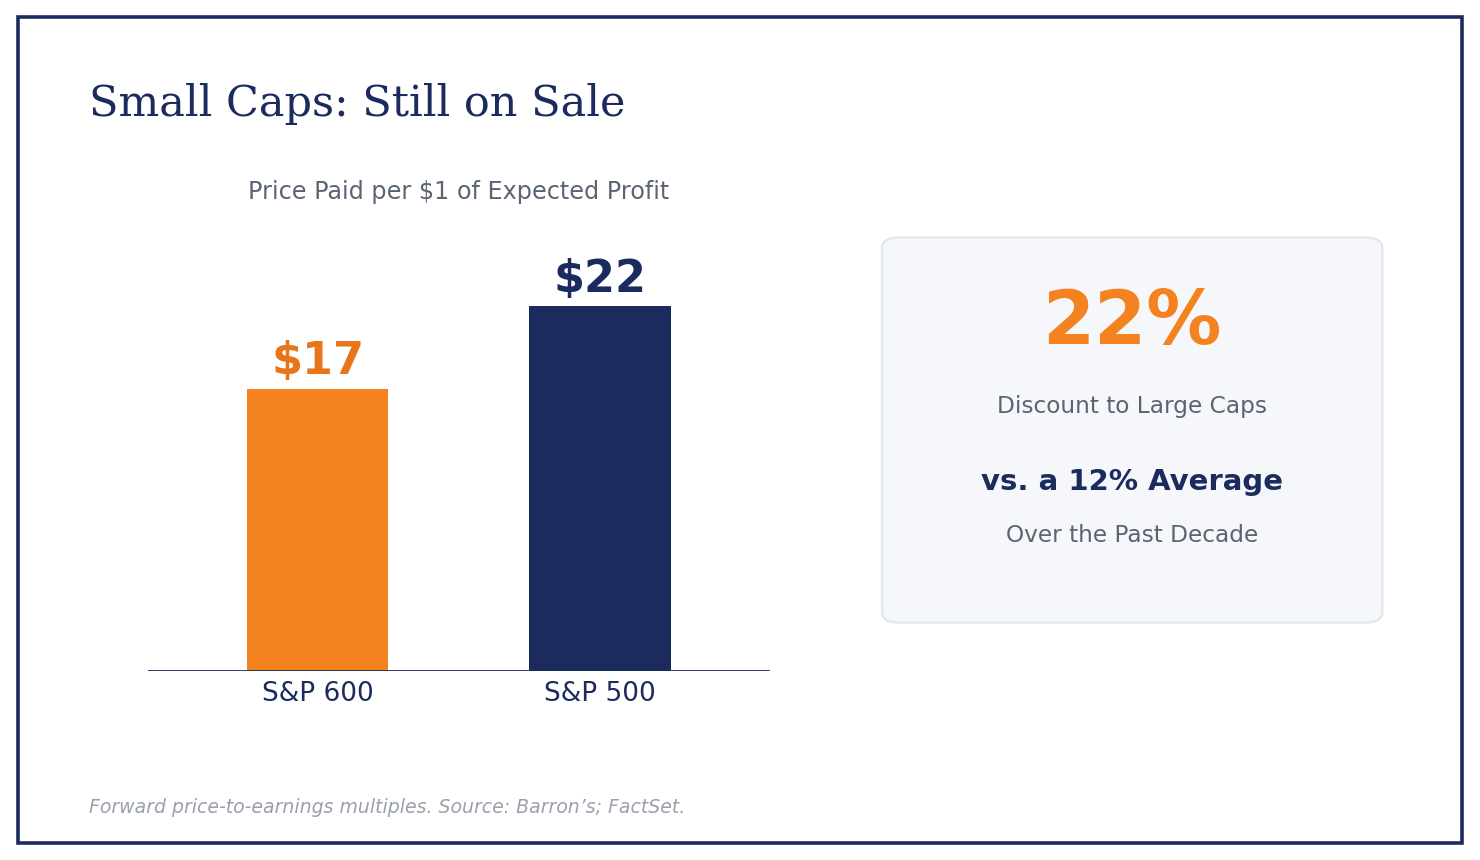
You might assume that after their best first half in 35 years, the bargains among smaller companies have been picked over. The arithmetic says otherwise. The S&P SmallCap 600 trades at 17 times this year’s expected earnings, versus 22 times for the S&P 500, according to Barron’s. Put differently, investors are paying $17 for every $1 of expected profit from small companies, and $22 for the same dollar of profit from large ones. That is a discount of roughly 22%, nearly double the 12% average of the past decade. In other words, even after a 21% gain, small companies remain cheaper relative to big ones than they have typically been. And because chip stocks drove so much of the rally, plenty of perfectly good small businesses were left behind entirely. The catch-up we anticipated has begun and it does not appear to be finished. It has, however, become more selective work, which suits us fine.
Who Will Buy All This Stock?
A development that deserves more attention than it has received: companies are selling far more stock to the public than they have in years. Goldman Sachs projects that initial public offerings will raise $225 billion in 2026, the largest annual total on record, led by SpaceX, which raised $86 billion in its IPO. And newly public companies are only part of the story. Companies that have been public for decades are selling stock too: Alphabet raised $85 billion in a single share sale, with Warren Buffett’s Berkshire Hathaway among the buyers (we know he no longer runs the show, but old habits die hard).
Count everything (new listings, follow-on sales, bonds that convert into stock, and insiders freed to sell as post-IPO restrictions expire) and the firm estimates roughly $1.1 trillion of stock will come to market this year. Meanwhile, the giant technology companies—long the market’s most reliable buyers of their own shares—are cutting buybacks to pay for their enormous AI construction budgets, a recent shift Bloomberg captured with the headline “Big Tech Stock Buybacks Vanish as AI Spending Spree Eats Up Cash.” More stock for sale, fewer of the market’s steadiest buyers: it is fair to ask whether the market can absorb it all.
Goldman’s arithmetic suggests it can. That $1.1 trillion sounds like an ocean of supply until you compare it with the size of the sea: it amounts to just 1.7% of the value of all U.S. stocks, right in line with the 1.8% norm since 1995. Buybacks are still growing outside of technology: seven of the eleven S&P 500 sectors are expected to repurchase more stock in 2026 than in 2025, lifting total buybacks 3% to $1.3 trillion. As a result, corporate buying is still projected to exceed corporate selling this year, though just barely. We take modest comfort in those numbers, while noting that companies, like the rest of us, prefer to sell what buyers are most eager to own. Heavy stock issuance has historically clustered near market tops, not market bottoms. Caveat emptor.
Where Does That Leave Us?
Curiously, after all the fireworks, investors as a group are neither giddy nor gloomy: the latest survey from the American Association of Individual Investors shows the ratio of optimists to pessimists sitting right around its historical norm. That feels about right to us. This is a market with genuinely strong and broadening profits, unmistakable pockets of speculation, a new Fed chairman establishing his voice, and its biggest companies trading at their most reasonable valuations in years.
The broadening we hoped for has arrived, but broadening is not the same thing as bargains. When leadership rotates this quickly, the temptation is to chase whatever is moving. Paying top prices for peak profits is how good rotations produce bad outcomes. Our approach remains what it has always been: we buy businesses, not themes; we care what a company is worth, not what its stock did last month; and we treat a market where 500 stocks no longer move together as an opportunity rather than a nuisance.
Best regards,
Mark A. Boyar
Jonathan I. Boyar
To learn more about how the Boyar Value Group can assist with your research or money management needs, please email amalia@boyarvaluegroup.com or
Important Disclaimer:
The information herein is provided by Boyar’s Intrinsic Value Research LLC (“Boyar Research”) and: (a) is for general, informational purposes only; (b) is not tailored to the specific investment needs of any specific person or entity; and (c) should not be construed as investment advice. Boyar Research does not offer investment advisory services and is not an investment adviser registered with the U.S. Securities and Exchange Commission (“SEC”) or any other regulatory body. Any opinion expressed herein represent current opinions of Boyar Research only, and no representation is made with respect to the accuracy, completeness or timeliness of the information herein. Boyar Research assumes no obligation to update or revise such information. In addition, certain information herein has been provided by and/or is based on third party sources, and, although Boyar Research believes this information to be reliable, Boyar Research has not independently verified such information and is not responsible for third-party errors. You should not assume that any investment discussed herein will be profitable or that any investment decisions in the future will be profitable. Investing in securities involves risk, including the possible loss of principal. Important Information: Past performance does not guarantee future results. Any companies mentioned in this are for informational purposes only and the performance of the stock selected is not indicative of the performance of the stocks profiled in Boyar Research, the performance of the stocks selected, and the performance of Boyar Research may in fact diverge materially. This information is not a recommendation, or an offer to sell, or a solicitation of any offer to buy, an interest in any security, including an interest in any investment vehicle managed or advised by affiliates of Boyar Research. Any information that may be considered advice concerning a federal tax issue is not intended to be used, and cannot be used, for the purposes of (i) avoiding penalties imposed under the United States Internal Revenue Code or (ii) promoting, marketing or recommending to another party any transaction or matter discussed herein. An affilate and employees of Boyar Research own shares in MSFT, MU, GOOGL, BRKB, & MSGS.
Comments
Nothing yet. Say the first thing.
Sign in to join the conversation.