
A couple of weeks ago I published a list of 15 “Vacation type” towns that I thought could come crashing back down. Mainly because of Airbnb speculators. The response was mostly positive from you guys although I got a little bit of pushback on X for one or two of those towns. Whitefish, Montana was the town people disagreed with me the most on. The main argument was that there was too much money around Whitefish that was waiting to scoop up any property that had even a slight dip in price. Based on looking at some of the rental listings, for sale listings and digging into some of the loans I saw (all public record), I still think there are some extremely overleveraged owners there, but I thought the people who disagreed with me had a valid point.
With that Top 15 post, I also got quite a few requests for a “Distressed Lake Property” list. Keeping the above in mind about towns like Whitefish, I wanted to put together a list for you guys of Lakes that I think could have some significant price reductions (aka opportunities) over the next 2-3 years. The criteria for this list became 3 fold:
Most houses are directly on (or across the street) from a lake
Short Term Rentals became an above average size of the market for the lake
The lake is THE amenity that drew people to the area
I know this trade pretty well because I build (and own) in the Smoky Mountains. As I’ve mentioned in prior write ups, I bought a STR in 2020, then another and another, saw low interest rates and cheap cabins skyrocket in value and saw everyone and their brother FLOCK to the area to scoop up investment cabins. The issue became, as we entered 2022, prices had doubled and sometimes tripled, interest rates were climbing and people were still buying…solely based on what a cabin “could potentially” produce in income. As I mentioned in my recent write up titled “The House Flip of a Lifetime” (and showcased the address), a property I bought in 2020 for $205,000 and sold a mere 18 months later for nearly a million, things were getting INSANE. I knew that I was witnessing a bubble, the likes of which I saw in 2006 and 2007, and for some investors it wasn’t going to end well.
The House Flip of a Lifetime
·
Jan 12
An anomaly - According to the dictionary it means “Something different, abnormal, not easily classified. A deviation from the common rule.”
Once enough people started chasing the gravy train of Airbnb income, the rental income starts affecting the price of properties. Not only those being bought and sold at the time, but also all properties around it. That’s what I was trying to find with this list. Areas where Airbnb buyers (and to a smaller extent, work from home buyers looking for a relaxing second home) drove prices up beyond what they would have otherwise appreciated. I am NOT saying these are bad lakes and I am NOT saying all of these places will crash. Some will, but I don’t have a crystal ball so I won’t, with 100% certainty, claim these areas are going to drop like a rock. I’ll show you the data, give my opinion on the data and then you can watch the listings and market over the next couple of years and interpret for yourself what is going on. With this write up, I was trying to identify lakes where Airbnb buyers became a big enough part of the buying pool that it could matter when those people quit buying, or worse, start selling.
Before I dive into my list, Big Bear is worth spending a little time on. I’ve never been there, don’t know much about the lake but saw it discussed quite a lot in STR forums and on Biggerpockets when I started researching places to buy a short term rental in early 2020. Early on in my STR days, before investing I would analyze markets full of STR’s and I would usually rely on places like AirDNA, Rabbu, FB Forums and other groups. Then I learned from an expert who had a massive STR portfolio how to dig even deeper. Taxes. Many STR heavy counties impose a Lodging Tax. Called by many different names depending on the county, it’s REAL county data that shows increases or decreases in taxes collected from nightly stays. The City of Big Bear Lake calls it the T.O.T. or Transient Occupancy Tax.
You can gather some good data on how rentals are doing from various analytical websites like the above but where the rubber meets the road, look at the taxes that a county pulls in from lodging. In 2019 the City of Big Bear Lake pulled in $5.3 million in TOT. By 2022 that number had more than doubled to $11.5 million. Keep in mind air travel was reduced, international travel reduced, cruises shut down and not many wanted to stay in hotels or resorts because of fear of catching Covid from someone else. Single family homes within driving distance of a person became the hot commodity. In the below chart you can see how the taxes went for the City of Big Bear Lake.
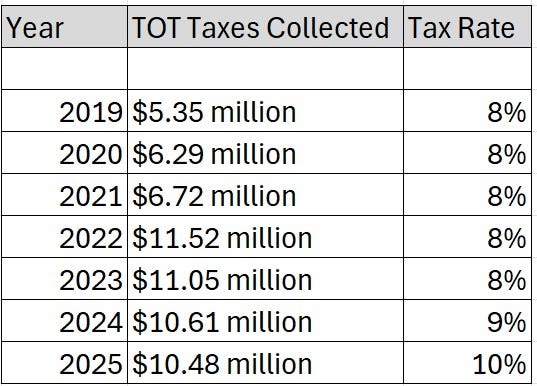
When you look at data, you really need to peel back the onion on that data. Take a look at the above chart. The tax for Airbnb’s, lodging, etc fell starting in 2023. They fell again in 2024 and 2025, but the fall seems minimal right? Well, let’s factor in the increased tax rate and see what the taxes collected WOULD HAVE BEEN had they not increased the tax rate by 25% over 2 years and left it at 8%.
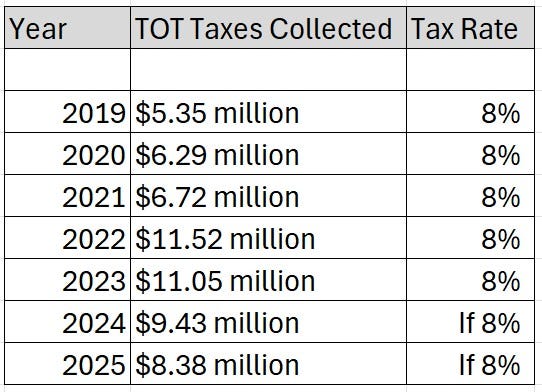
That is nearly a 30% drop in taxes collected if we were comparing apples to apples from a tax collection standpoint. The tax hikes that the City of Big Bear Lake put through hide the true drop in diminishing revenue received from STR’s and hotels. So, if a Airbnb was pulling in $100,000 in 2022 in income, this tells me it’s now pulling in roughly $70,000 in annual income for 2025. They are paying a higher tax rate on that $70,000 than they were in prior years which translates to a less noticeable drop in what is reported at the county/city level.
Now, to verify my initial hypothesis based on the tax rate hikes of declining revenue, guess what…the city actually gives you the numbers! Many do by the way, you just have to dig. Check out what the T.O.T. revenue reported was per year for the City of Big Bear Lake (keep in mind this includes hotels and not just Airbnb revenue), but the stats are clear. Nearly a 30% drop in revenue reported from peak to current. And as gas prices stay high and people feel the economic pressure mount, I have a feeling the reported revenue will continue to slide. That is a problem for those who bought banking on rental income to sustain their purchase.
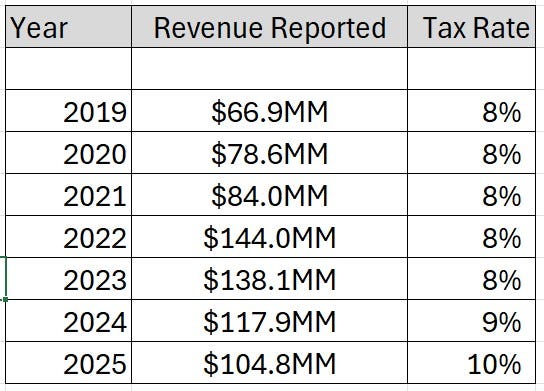
One last point on the above charts. Why do I look at taxes as opposed to just going straight for the revenue reported number? Because taxes show what the City may do. Both data sets are necessary to look at (Revenue and Taxes collected), but I start with the Taxes because I want to see what the city/county has done in the past and I want to guess what they may do in the future. Tax revenue dropping? Let’s increase the tax rate (just like Big Bear did two years straight). What does that do? These taxes are paid for by guests. It’s the tax added onto the reservation when they book. Increased taxes = increased price for the renters = potentially lower bookings = lower revenue for the owner = more distress for underwater owners = increased tax rates again. It’s a cycle.
The rental supply numbers tell another side of the story. From 2021 to 2022, nights that were AVAILABLE to book increased nearly 20%. Actual nights booked increased only 3% in that time period. Stay with me. You had a 20% increase in supply with only a 3% increase in demand. One more piece of the puzzle…occupancy went from 57% in 2021 to 43% by 2022. If you remember, things started opening back up for broader travel by mid 2022 and early 2023. The problem was, as I mentioned in my last write up about a Looming Foreclosure Crisis in certain towns, that FOMO buyers were watching too much Instagram and TikTok Wannabe Real Estate Gurus pushing Airbnb. They started basing their purchases (and in turn driving up prices), on what these properties were “Projected” to bring in in rental income. Today, AirDNA puts Big Bear occupancy at around 35%. So you went from 57% to 43% all the way down to 35% in a matter of just a few years.
Let’s take it one step further. With regard to the hypothetical example of the $100,000 house that now pulls in $70,000 based on the tax drop of 30% (if the rates had stayed at 8%)…how does the city have only a 30% drop in revenue taxed which is attributed to lodging, but the actual bookings of the homes drop almost 40%? (From 57% occupancy to 35% a few years later). There are two reasons:
Higher average daily rates. 2021 - 57% occupancy at $250/night vs now 35% occupancy at $325/night. If this is the case in the Big Bear data, this tells me that some homes could be really standing out from the competition and are able to pull in more revenue per night vs the crappy cabin owners. Or, larger homes were built during the boom which are commanding higher prices with low occupancy rates.
More inventory —> same (or slightly fewer bookings) spread across more units leads to a lower occupancy percentage (not good for individual owners) → lower occupancy % but the tax revenue
If a person bought a cabin 15 years ago for $300,000, they will be okay. But if a person paid $1,000,000+ for a 3 Bedroom Cabin in 2022 or 2023, put 20% down, did a DSCR loan at 8% interest based on a $150,000 in projected rental income, they are getting ABSOLUTELY CRUSHED.
After digging in a little deeper, reading a lot of the comments on my X posts and then running the numbers, I made some tweaks to my list. I didn’t want this to be just an opinion piece. I wanted to back it up with some data. Yes, the future of what will happen to these is my humble opinion, but if you disagree, guess what, that is merely your opinion as well. We won’t know how all this plays out until we are in 2029 or 2030 and can look back. I can say though, as a builder and owner in the Pigeon Forge and Gatlinburg TN area, I have been seeing cracks in certain segments of the market for 3 years now and it’s about to get a LOT WORSE. I live in Atlanta but I am in TN every week at construction sites, at my cabins, watching the market, talking to my 84Lumber supplier, talking to various owners, realtors, etc. I’m not a doom and gloom guy, but BASIC cabins, not only in the Smoky Mountains, but in many other STR spots are going to get obliterated. For three reasons:
The competition is too fierce now
The supply of STR’s has skyrocketed in many vacation spots
The demand of renters is dropping as they tighten their purse strings
Let’s start with why I removed Lake Lanier. After I posted the rankings on X a few people pushed back since many owners live there full time. A huge number of homes around the lake are in fact primary residences. With a growing employment base in Atlanta and people deciding to drive further and further into work for a peaceful view in the evening, more people actually live on the lake full time now. While there will be Airbnb owners who bought in 2022 and beyond who absolutely get hurt, the amount of people who are ready to scoop up a property on Lake Lanier as their primary residence at even a 10% discount on average price per sq foot is extremely high. That demand makes Lake Lanier a weaker fit for what I am looking for in this analysis.
Lake Norman had a similar issue as Lanier the more I dug into the data. Lake Keowee in SC and Flathead Lake in Montana. There, I was more concerned about the amount of wealthy individuals who could step in and scoop up a place without batting an eye. One thing about people with lots of money…they generally know good deals when they see one. A lot are business people and a lot are shrewd with finances. If they see a charming lakefront cabin that they could get at a 10-15% discount, they jump. That, in my opinion, could keep the cascade effect of foreclosures at bay for Keowee and Flathead.
Me excluding some of the original list isn’t me saying those areas won’t in fact fall. I’m just trying to keep my “opinion” of the future tied to the strongest data points I could find. My main question was “Where did Airbnb become important enough to the pricing of certain lake real estate that it mattered if those people disappeared from around the lake…either by force (from a bank foreclosure) or their own free will.
I started with about 30 lakes. Looked at housing data, price reductions, days on the market, rental supply, occupancy rates and finally rental revenue. I also dug through BiggerPockets, Reddit, FB STR Owner groups, FB STR’s For Sale groups and quite a few other places. I needed evidence that people were buying in these markets during the boom. And not just one random person on the internet, but lots of people. I gave each lake a score of 0 to 100. It doesn’t mean a lake that scored an 80 has an 80% chance of dropping in value, just think of it as a way for me to quickly compare the same risk factors across various markets.
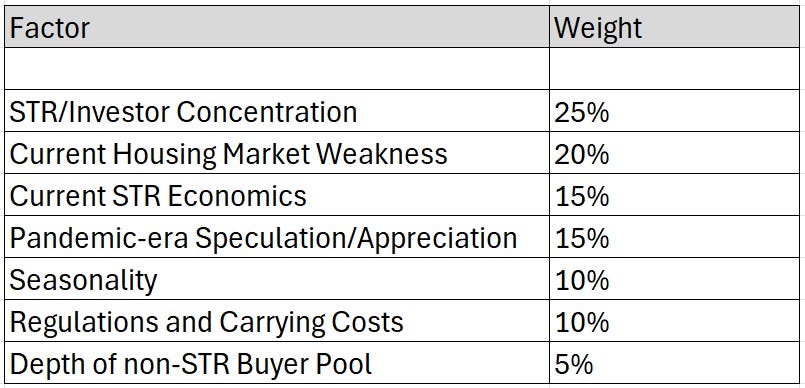
The first factor carries the most weight for a reason. Many markets have seen softening home prices, but not all of those markets have seen softening home prices because of Airbnb’s. I wanted markets where STR’s were meaningful participants in the housing market…causing the prices to skyrocket because of FOMO buyers and potentially impacting the prices again in the opposite direction when rent doesn’t cover the mortgage. I also factored in what was currently happening in the market. Are listings sitting with no activity? Are prices being cut? Is Occupancy and Revenue falling around the lake? Is the supply increasing and demand decreasing? (as was the case with Big Bear). And finally I wanted to account for something that I didn’t do in my first Top 15 list. Who buys the house if the Airbnb investor wants out? That final question knocked several names off the list.
Now, without further ado, let’s get to the list:
STR Snapshot: 4,119 active rentals | 34% occupancy | ~$30,800 annual revenue | Revenue down 14.5% YoY
I’ve already gone through Big Bear so I won’t continue to beat a dead horse about it. But, as I said in my last write (below) up how Broken Bow, OK was going to be ground zero for vacation rental town foreclosures, Big Bear could take that top spot for Lakes.
The Looming Foreclosure Crisis
·
Jul 24
The amount of doom and gloom I see on X regarding a potential housing crisis is quite nauseating sometimes. You’d think by some posters accounts that the entire cross sectional map of the United States was about to have another housing explosion equating to the one that hit in 2008-2011. I don’t believe that will happen. Most people who are in 3-4% mort…
One of the most glaring stats for Big Bear was how the supply (# of available nights) increased by 20% but the demand just increased by 3%…in only a single year! That is a perfect example of how oversupply starts. Now that occupancy is around 34% and the average rental is producing only $30,000 per year, anyone who paid $700,000+ on a cabin and throwing documents saying the property will bring in $100,000 in income in order to justify a DSCR loan, is going to be in for a world of hurt. I won’t showcase every single stat as I don’t want to put some of you to sleep, but one that really stood out that I saw was the booked nights from 2021 to 2022.
2021 - 457,791 total booked nights
2022 - 404,684 total booked nights (43% occupancy)
2026 occupancy now stands at 34% with revenue down 15% year over year.
Translation: It’s getting uglier with each passing year. Big bear is a ticking time bomb for anyone who bought from 2022, 2023 and 2024 and bought solely with the intention of Airbnb’ing the property and that income covering the expenses.
Housing Snapshot: Travis County home values down 5.1% YoY | 7,591 homes for sale | STR Tax Revenue down 30% | Austin foreclosure starts up 151% YoY
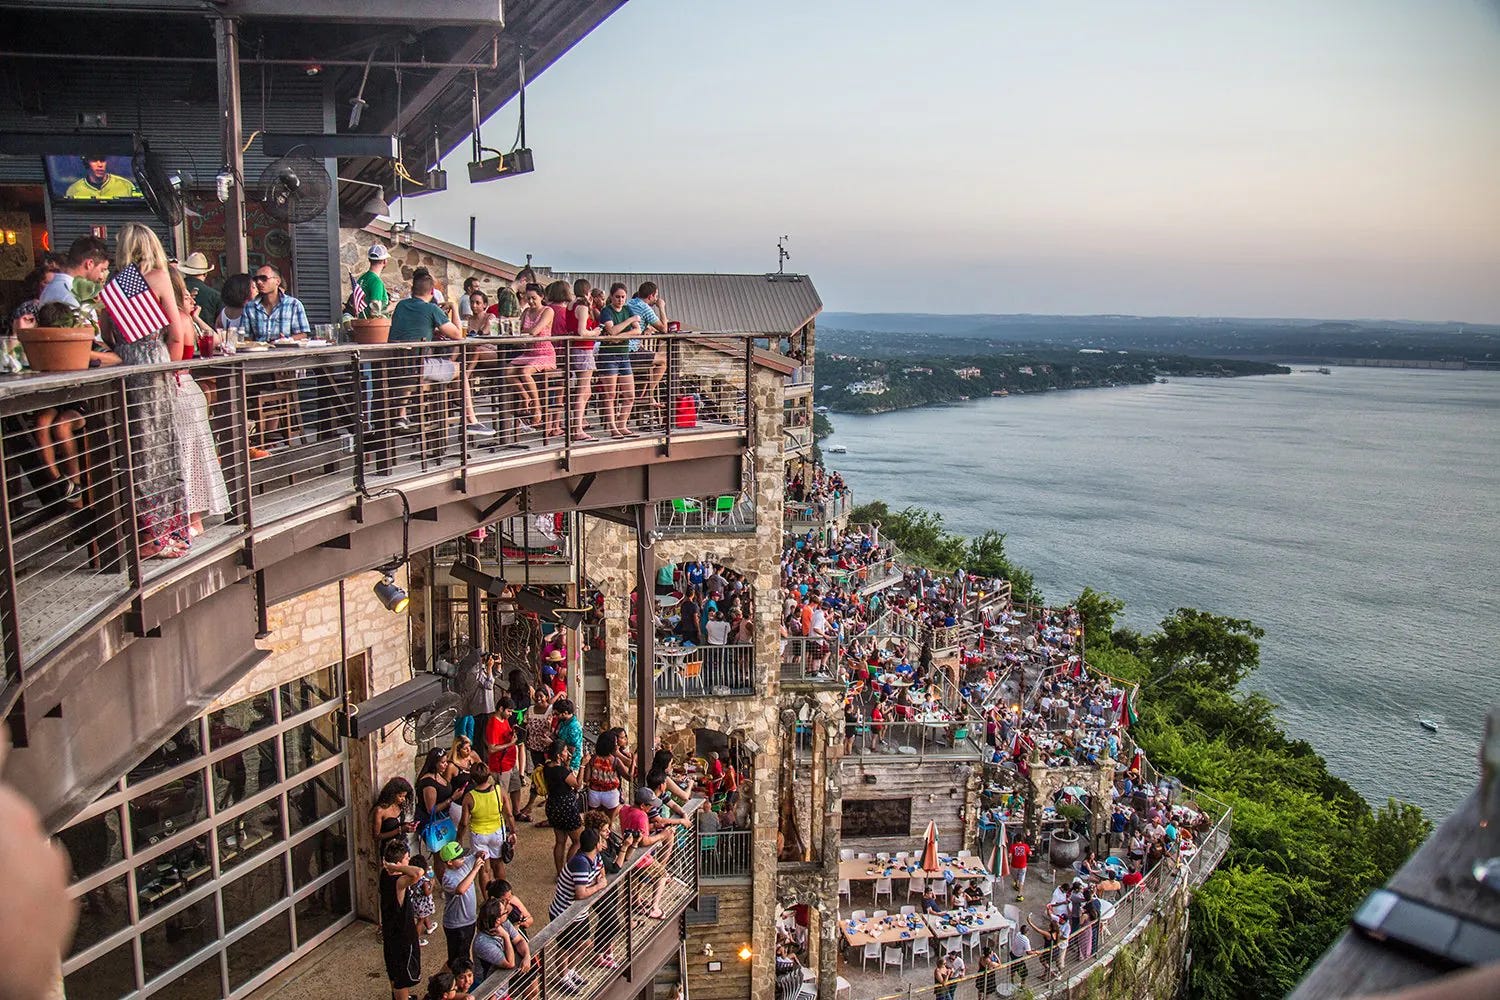
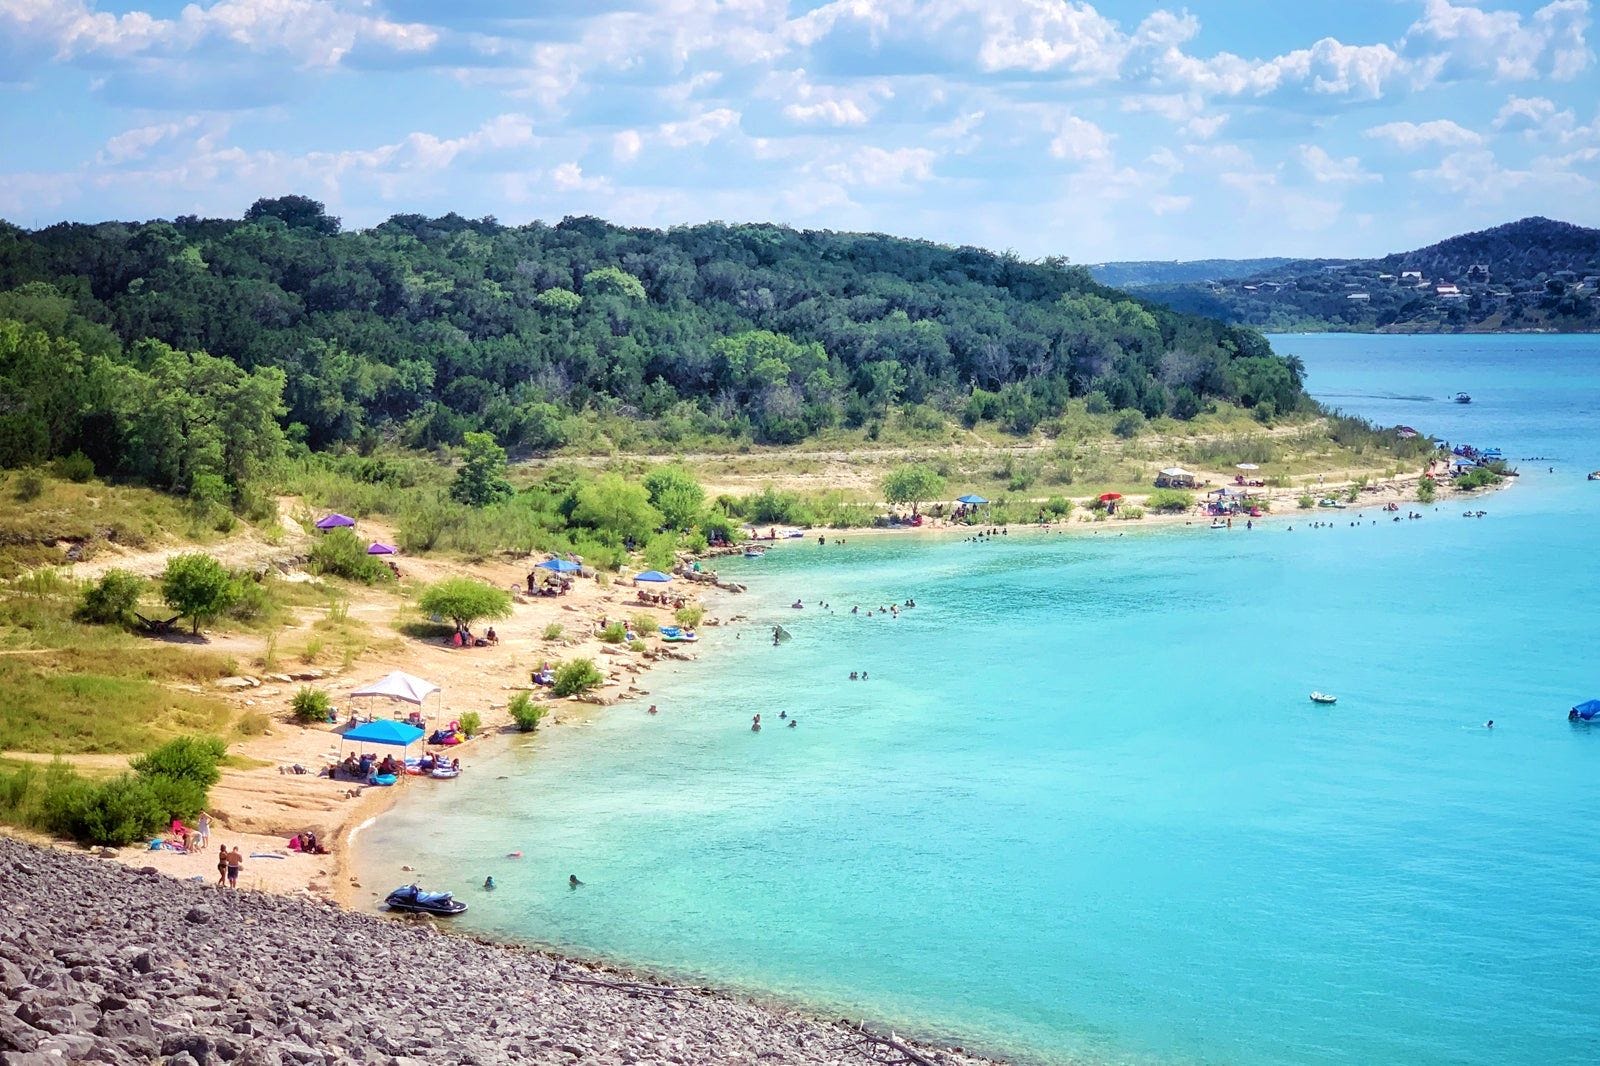
Why did I put Lake Travis on this list? Well, Austin has a lot to do with it. The Airbnb/Second Home trade sits inside one of the biggest COVID housing booms in the country. Austin prices exploded when remote workers and investors poured into Texas. Travis County home prices are down 5% and there are now 7,500+ homes for sale in the county. Also, so far this year there has been more than double the foreclosures in Travis County vs the same period last year. Again, that’s Austin wide and not just Lake Travis, but falling house values and a weaker Austin housing market combined with the insane appreciation of Lake Travis housing from Airbnb buyers and second home buyers, have created a recipe for disaster. This is why Lake Travis is near the top of the list.
I dug into the actual Travis County Records. The County Clerk reports the number of “Foreclosure Notice of Sales Processed and Recorded” as follows:
2023 - 927 Notice of Foreclosure Filings
2024 - 1271
2025 - 1450
That’s a 56% increase in filings in just 2 years. It will be interesting to see what 2026 holds. Now, let’s do the same thing we did for Big Bear. Let’s look at the taxes a county collects. Lake Travis doesn't have one citywide “Lake Travis Hotel Occupancy Tax…or HOT” because the lake crosses multiple municipalities. But, let’s look at one area, which you can generally deduce would be similar to other municipalities on the lake: Lakeway.
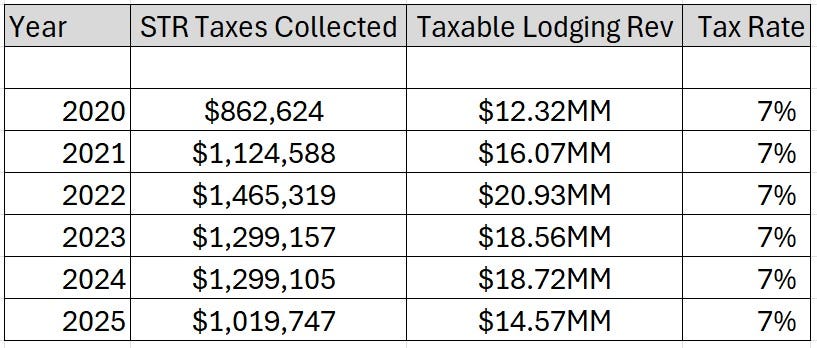
Look at the drop from 2022 to 2025. That is almost a 30% drop in rental revenue. The problem is, as I have hammered into you all prior, is that people were buying these places based on income generated in ‘21, ‘22 ‘23 & ‘24 assuming those numbers would continue to replicate. The problem is: they’re not. Couple that with the real estate issues popping up in Austin right now and you will have a lot of people who bought Airbnb’s at the peak who just can’t sustain the mortgage with lower rent coming in.
The guy who bought on Lake Travis in 2019 and prior will be fine. The guy who bought from 2021-2024 because he thought Austin would keep booming and the Airbnb income would pay for his lake house that he could show off to his friends…that’s who most concerns me.
STR Snapshot: 2,284 active rentals | 44% occupancy | ~$21,600 annual revenue | Annual STR Rev down nearly 50% from peak
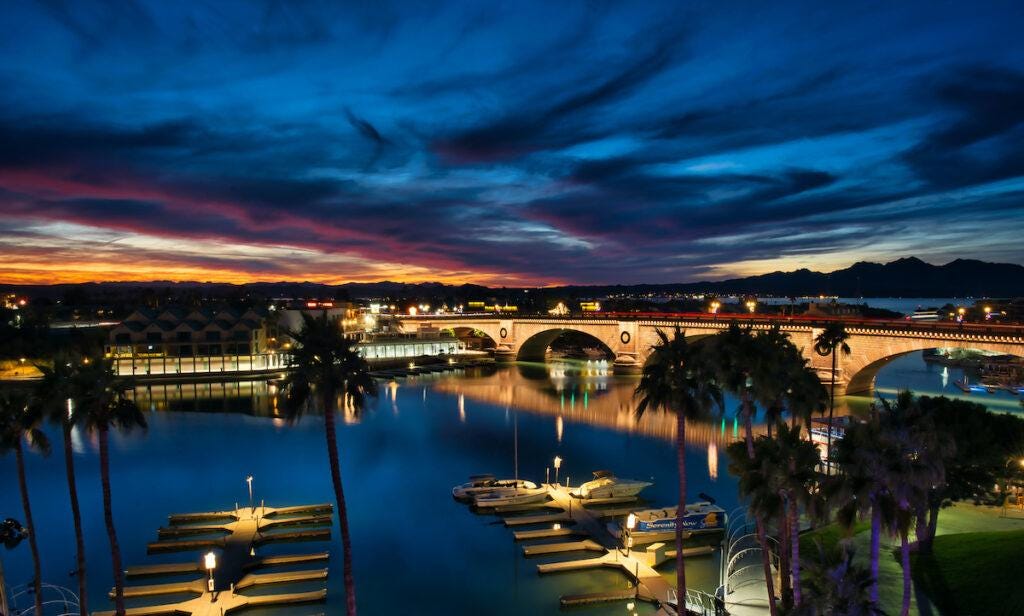
Havasu has a HUGE vacation rental presence. The issue is, back in 2019 and 2020 the average home sold for mid to high $200’s. Then Covid hit, then Airbnb hit, then people got in bidding wars for “Investment homes” and the median sale price in 2022 hit $530,000.
AirDNA is showing 2,284 active rentals, but the kicker is, they are only averaging about $21,600/yr in revenue now. Digging a little deeper, in 2021 & 2022 they were averaging around $40,000/yr in annual revenue. The place isn’t falling apart yet. Zillow shows almost 700 homes for sale with a modest 0.7% price drop but it’s heavily dependent on vacationers, snowbirds and second-home buyers. With so many rentals we can speculate that a large portion of Lake Havasu was bid up by STR buyers seeing the spike in rental revenue for the 3 years following Covid. Now that income has all but dried up and there is LOTS of leverage with buyers on Havasu.
Now let’s check out the tax revenue the city is collecting. It tells an interesting story.
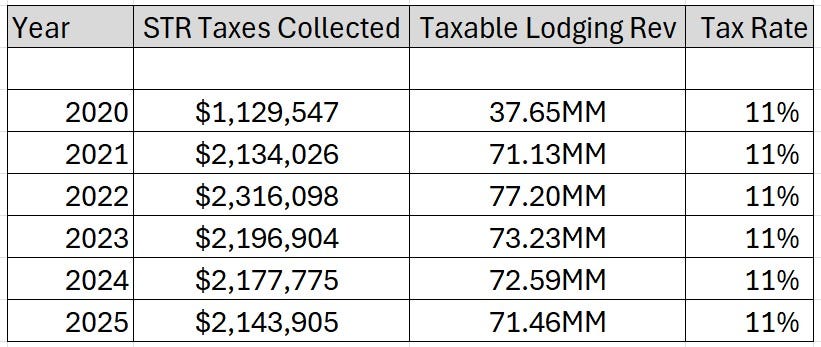
It doubled with the Covid boom. Airbnb’ers flocked to the area during lockdowns apparently. And honestly, it hasn’t stopped. From peak to current year data there has only been a 7% decrease in Lodging Revenue reported. So what caused rentals to move from approximately $40K in income per year to $22K? Competition. When you increase the supply, that $70+ million is spread over a much wider swath of rentals.
The lake will still be packed on the summer weekends but I am more interested in the guy who bought during the Airbnb frenzy and expected the house to pay for itself. $22,000 in annual income isn’t much when you are carrying a $500,000 mortgage at an 8% rate, and also have to pay all the utilities, upkeep, maintenance and so on. Havasu reminds me of my market: Pigeon Forge and Gatlinburg. People will continue coming to the Smoky Mountains, but home doubled and oftentimes tripled between 2020 and 2023. The guests will still come but there is way more competition there now and if you don’t stand out from the norm, you aren’t getting bookings. Couple that with high mortgages and that equals eventual foreclosures.
STR Snapshot: 1,138 active rentals | 34% occupancy | ~$27,300 annual revenue | Revenue down 14.5% YoY | Home values down 4% year over year
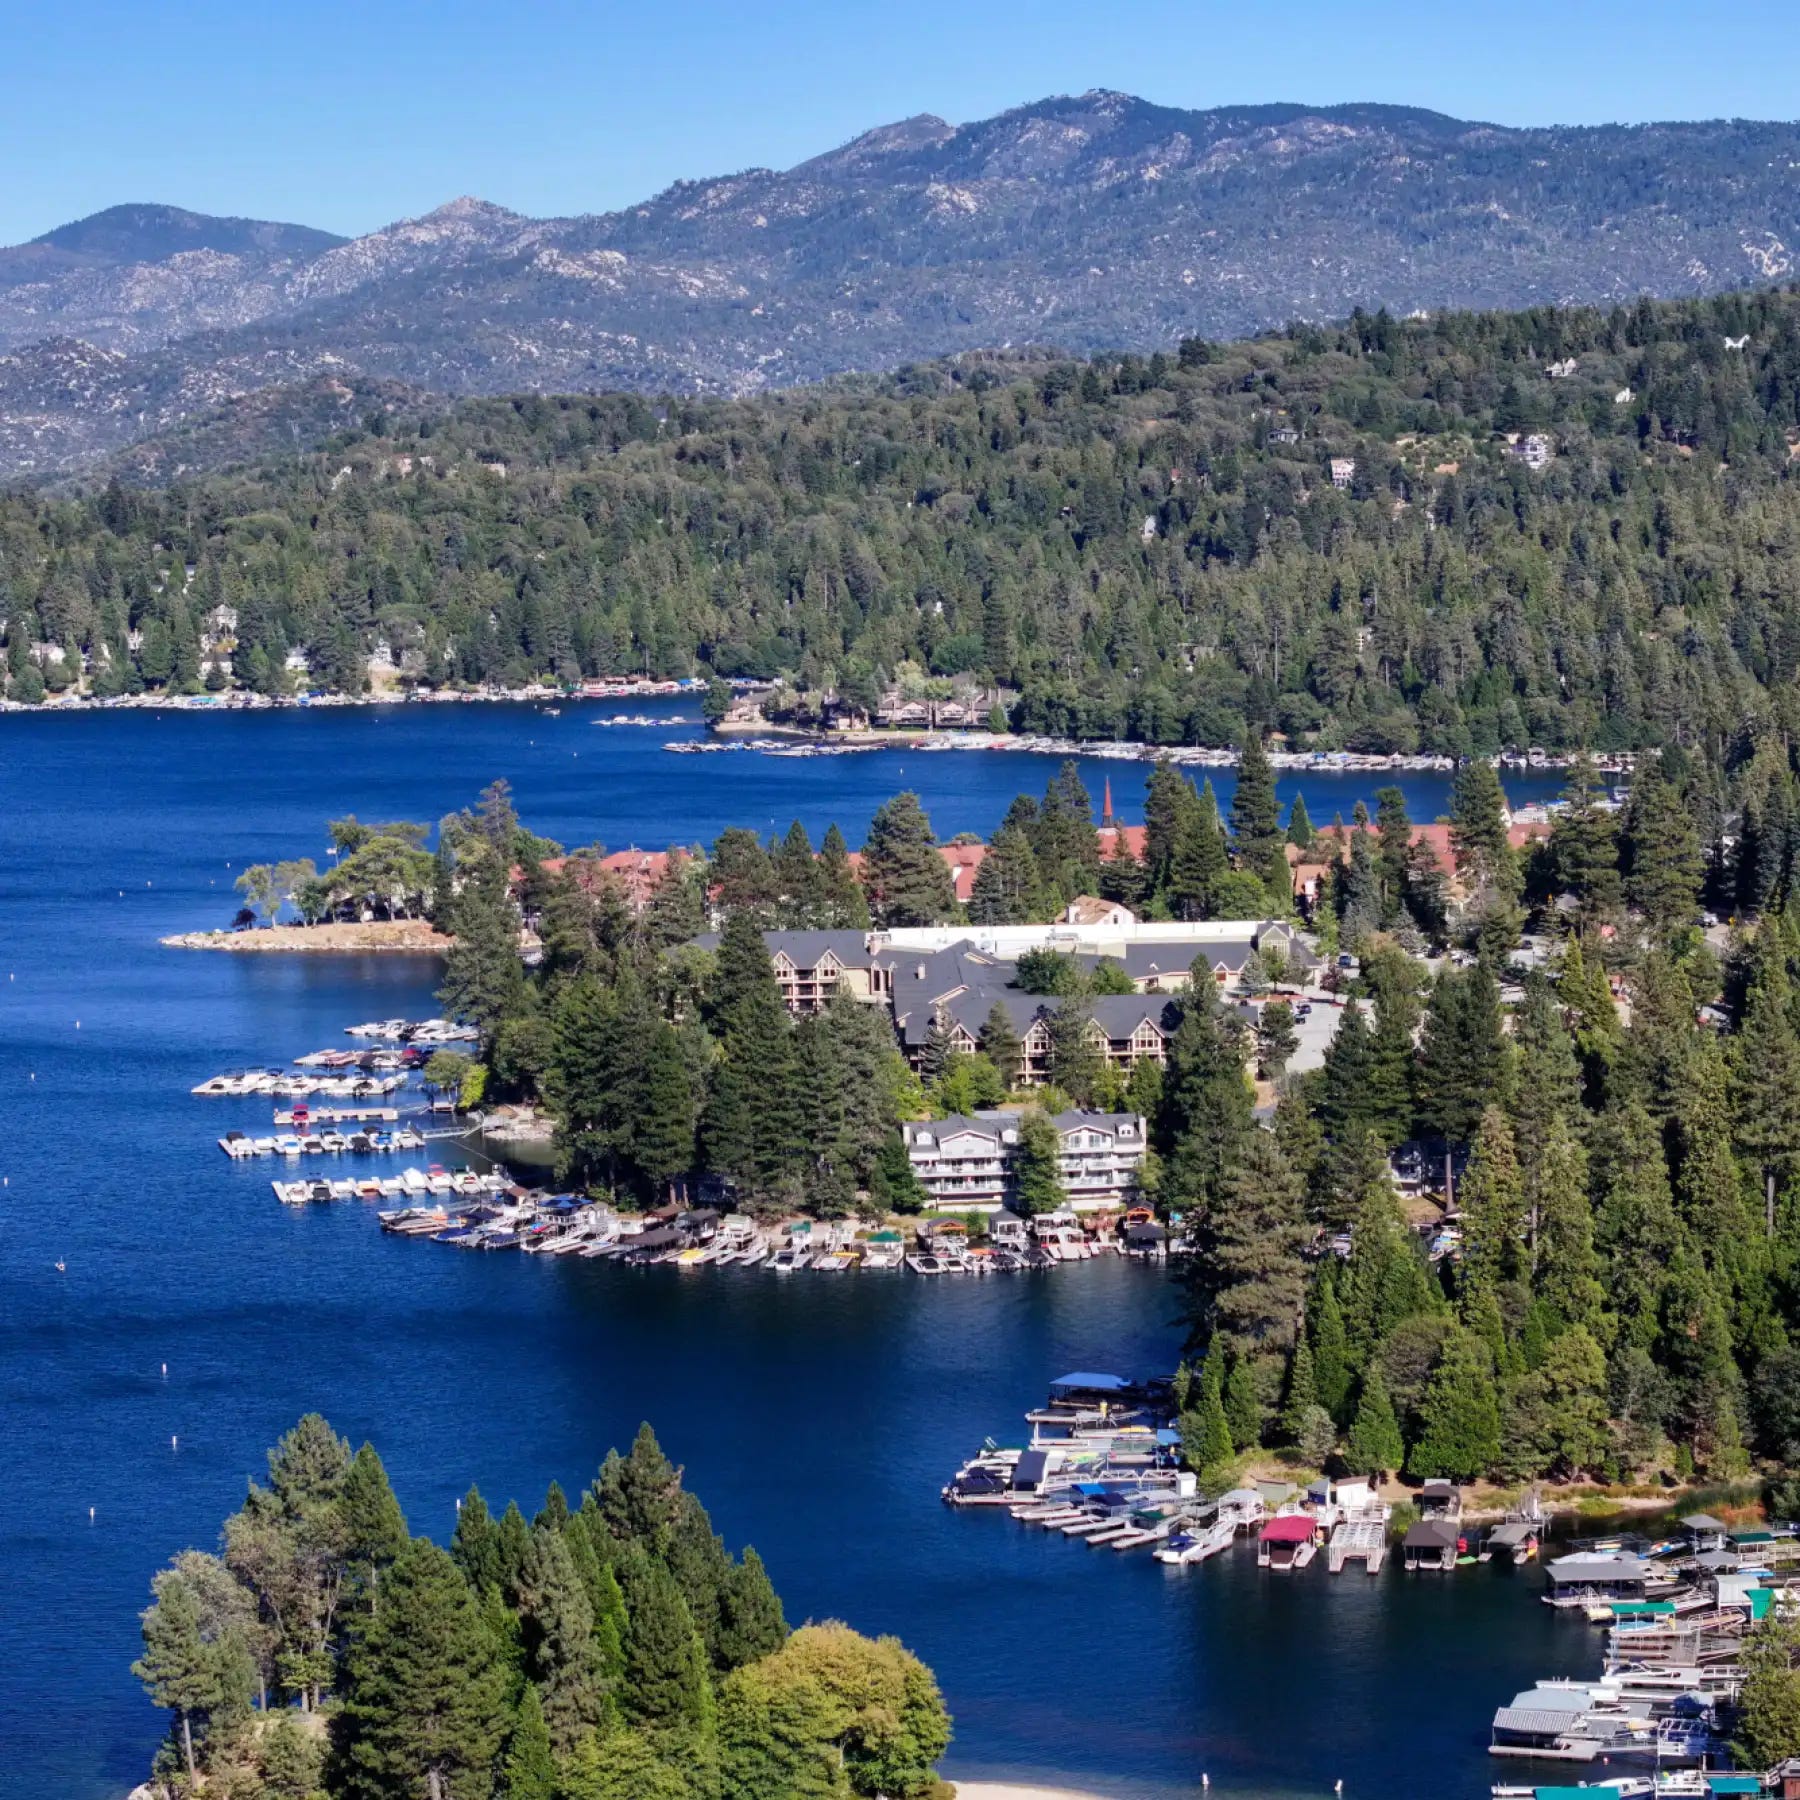
I must admit, I had never heard of Lake Arrowhead until I started researching this list. It has some of the ugliest numbers I’ve seen though. Of the 1,138 active rentals they are only sitting at 34% occupancy. What jumps out even more was that the average home value around Lake Arrowhead was around $400,000 in 2020. By 2020 that number jumped to nearly $650,000. While some of this was driven by low interest rates, a lot was driven by speculators who wanted in on the Airbnb action.
Back in 2022 and 2023 the average annual rental income was around $45,000. The current average sits around $27,000. Nearly a 50% drop in revenue. Just in the past year alone revenue is down almost 15%. This does not bode well for an investor who purchased in 2022 through 2024. Occupancy rates in 2021-2023 sat around 50%. It now sits at 34%.
For those who paid $600,000 for a home and were fixated on that $45,000 in annual income helping pay for that home, the writing will be on the wall very soon, if they haven’t figured it out already. When you have decreased occupancy rates, decreased revenue and decreasing home prices…those are three factors that can start a cascade of people walking away from their “Investments”.
Risk Score: 83/100
STR Snapshot: 1,347 active rentals | 37% occupancy | ~$25,000 average annual revenue | Revenue down 10.5% YoY
Canyon Lake has a LOT of Airbnb’s for a market like this…and that can be a problem. What do I mean? The surrounding residential/tourism market isn't enormous relative to the number of STRs there. Think North Georgia Mountains for those on the East Coast. I highlighted a few towns that are already popping in North GA. Elijay, Blue Ridge, Mineral Bluff. These EXPLODED with STR’s post Covid, but about the only crowd that ever visits there are people from Atlanta. They weren’t areas that could sustain lots of tourism once everything opened back up. Canyon Lake appears to be similar.
Canyon Lake is basically a weekend/short vacation drive market for people from Houston, Austin and San Antonio. Canyon Lakes weakness is too many STR’s competing for a finite regional market.
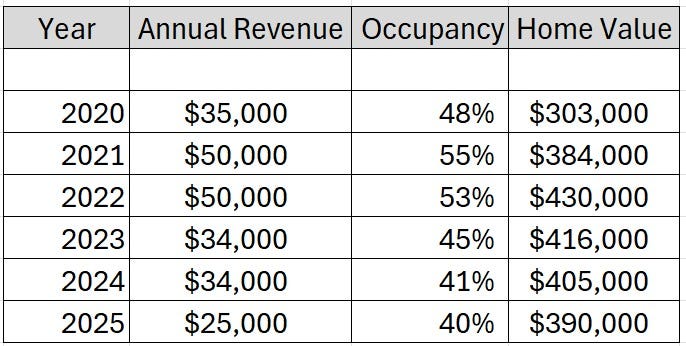
Annual revenue is now down to around $25,000. Airbtics data show active STR rental listings rising about 42% over the last three years, while occupancy fell about 11%. AirDNA data is even weaker than that. 1,347 active STRs, 37% occupancy and $25K average annual revenue, with revenue down another 10.5% year over year. That’s a disaster for anyone holding much leverage on a short term rental. Investors bought into a market where home prices jumped 42% in two years, STR supply exploded, and today's average rental produces only about $25K annually at 37% occupancy. The chickens will be coming home to roost here over the next 2-3 years.
That’s was a lot of DATA wasn’t it?!? Substack told me to wrap it up, that I am running out of room. And we are only through the Top 5. Ten more to go. That one comes out tomorrow. I don’t want to make everyone fall asleep with this data dump of monumental proportions. But, just for a sneak peek the next five in my Top 15 list are:
Deep Creek Lake Maryland
Lake Chelan, Washington
Lake Anna, VA
Lake Harmony/Poconos, PA
Lake Hamilton, Arkansas
I’ll be dropping it tomorrow, so monitor your inboxes. And the final 5 will be dropped the following day.
Broke
No posts
Comments
Nothing yet. Say the first thing.
Sign in to join the conversation.