
For years I ran charts in software that felt like it was fighting me. Slow, clunky, locked behind a subscription, and never quite built for the way a reader actually works. So I stopped complaining and built the tool I always wished existed.
The beta runs now since a few weeks and if you want the full guided tour, the video below covers all of it. Enjoy learning and seeing all the new things!
If you’d rather read the short version first, here it is.
Type a name, hit tab, type the date, tab, time, place. Done. No forms that feel like tax returns. If you run charts every day, those tiny seconds add up fast. And you decide whether a chart gets saved or stays a quick throwaway, so your library never fills up with test charts.
This isn’t a static image. Hover any center or gate and you get the keynote right there. Click an open center and it zooms in so you can sit with it, distraction-free. Click any gate and a panel opens with a clean summary of the line. There’s even a way to bring in your own Rave I Ching text if you have it.

Press one key and the chart becomes a full-screen stage: isolate a channel, draw on it, point with a laser, grow the mandala. It’s built for the moment you’re actually sitting with a client and saying “look, this is you.”
Classic or modern style, red-and-black or the traditional colors, silhouette on or off, light or dark mode, and a pile of accessibility options (soften the colors, reduce motion, larger text). Almost everything has a keyboard shortcut, like real professional software.
Filter by type, authority, profile, a specific gate, even deep variables like cognition and definition. Tag your people (clients, family, “ADHD”, whatever you research), pin the ones you’re working with, and open up to three charts side by side. Import from MyBodyGraph or MMI, and everything syncs across your devices automatically.
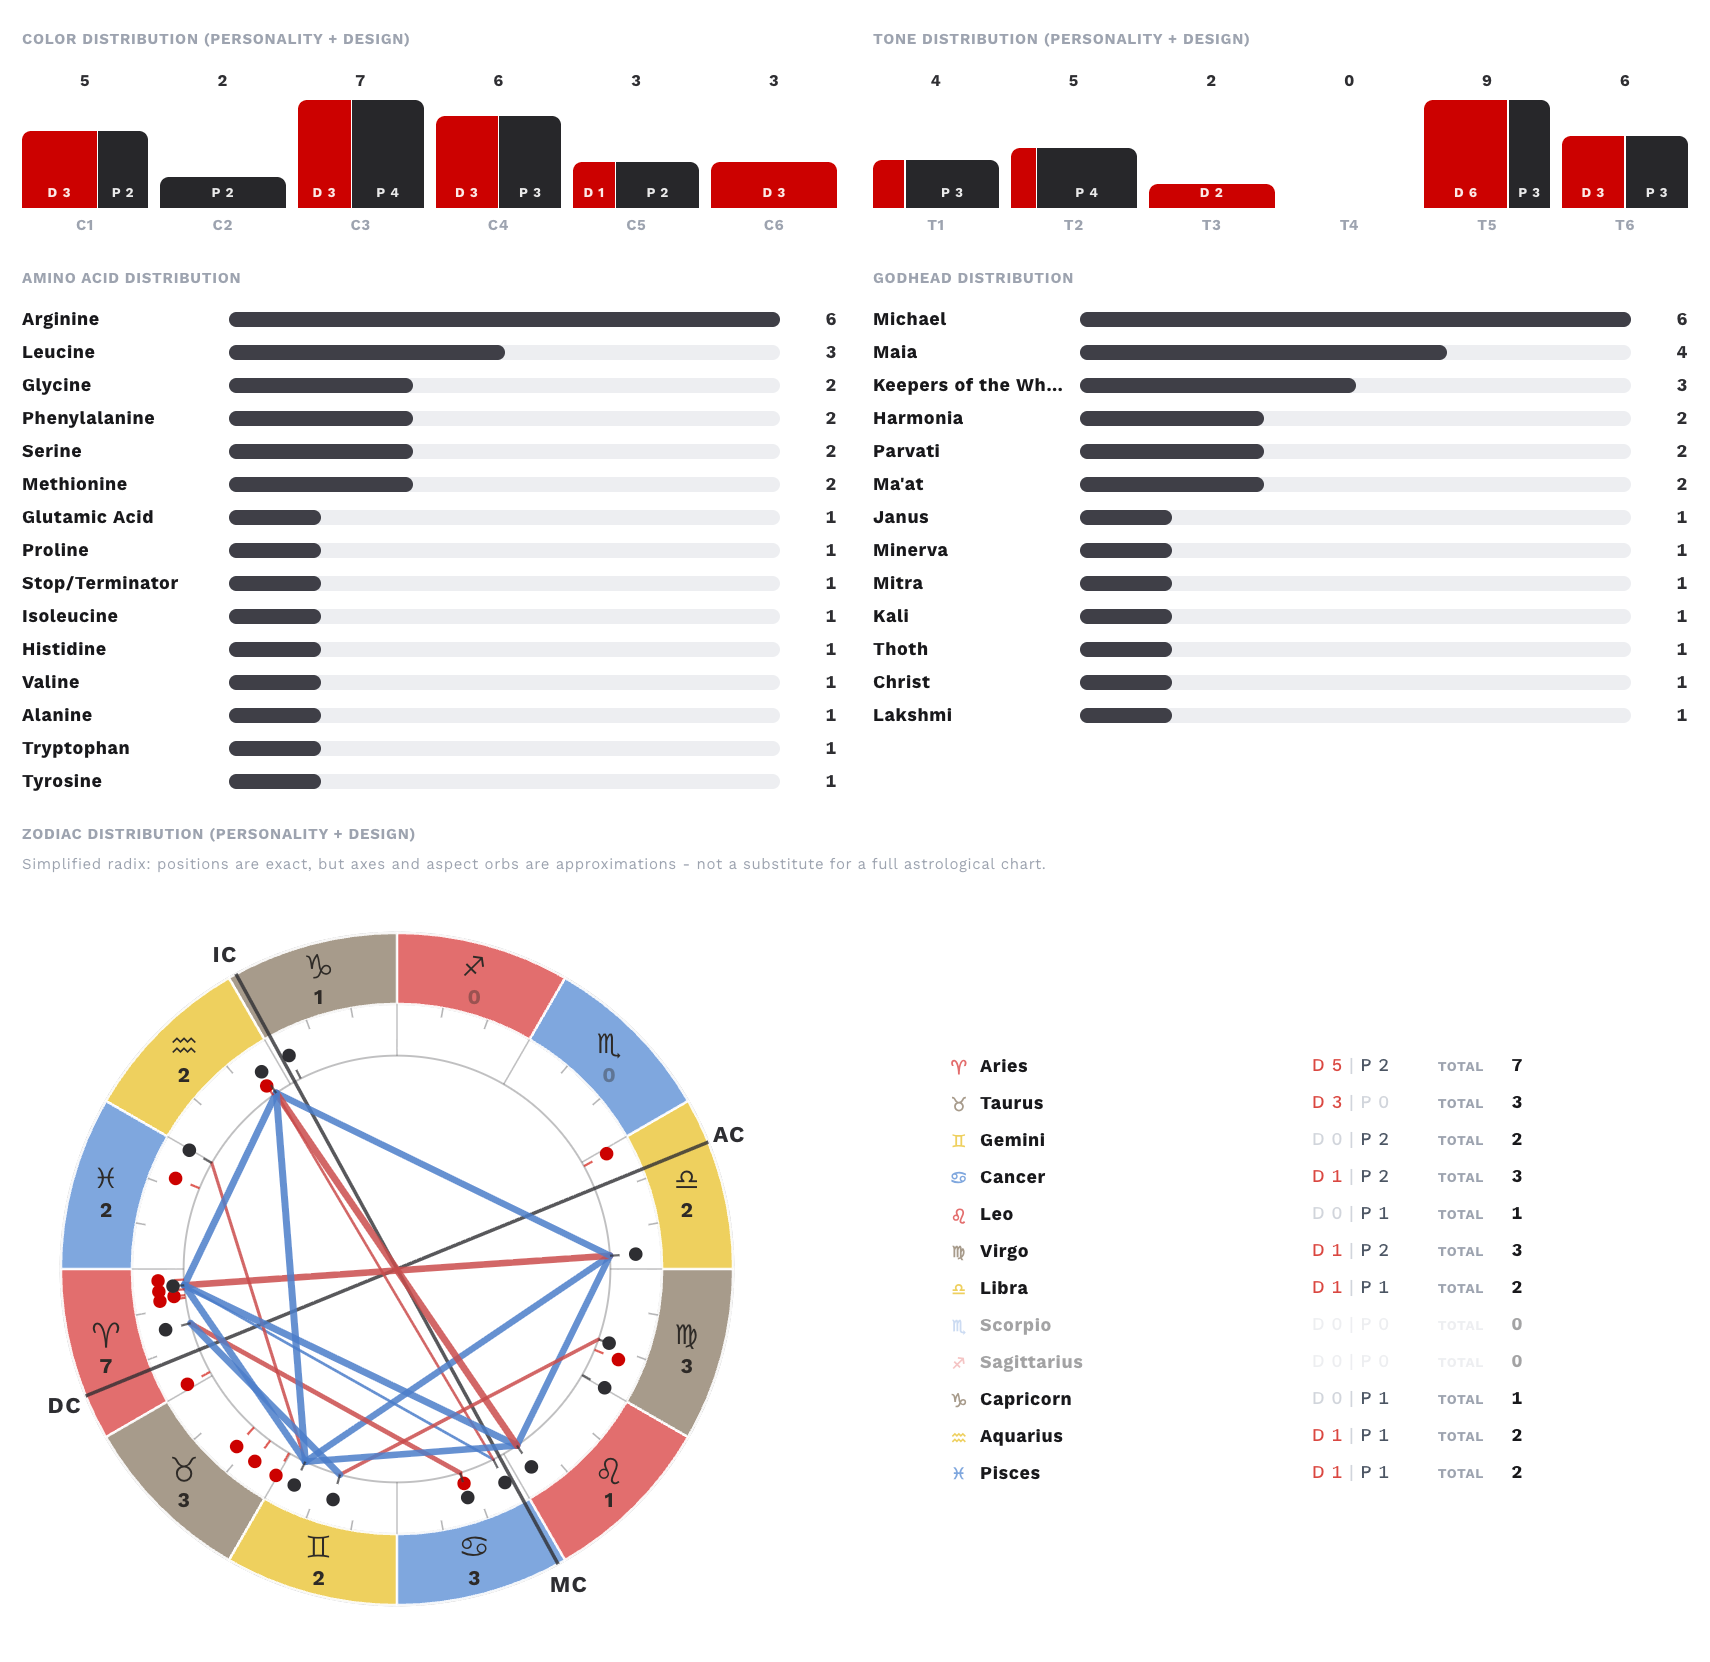
Cycle and transit charts on a beautiful timeline, solar returns, partner and composite charts with electromagnetics and fixation triggering, and the Penta for groups and families, complete with a heat map of what the group brings together.
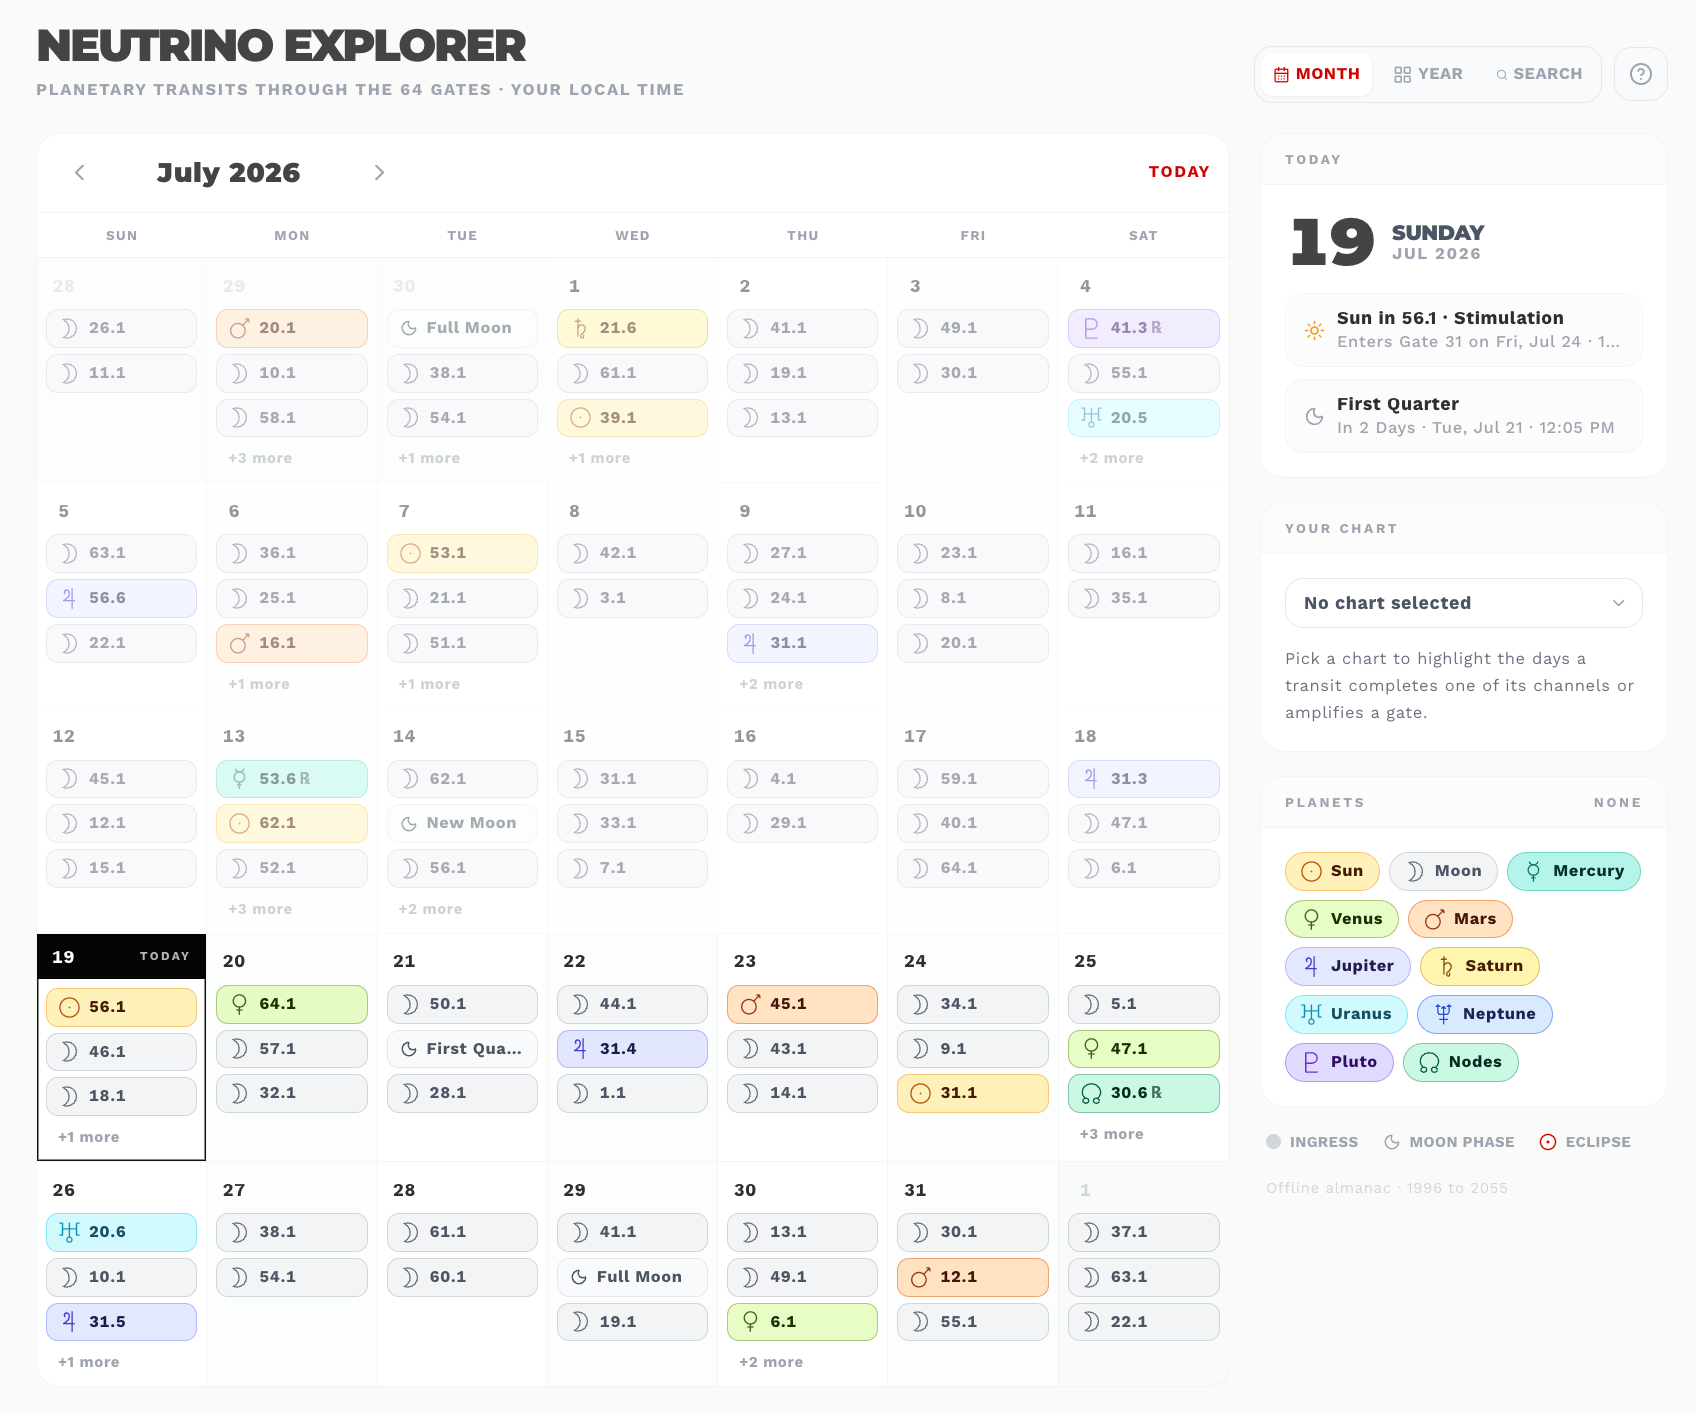
A neutrino weather overlay for today’s transits, a wave tracker to log and see your emotional wave over time, a Lunar Lab built for reflectors, and a full transit calendar (the Neutrino Explorer) where you can scan any day, any month, or search for exactly when a gate goes active.
A knowledge base and glossary for the terms, an interactive chart and interactive mandala to play and learn, famous charts to study, and real statistics from a real, growing database, so you can finally ask “how many 1/3 emotional generators are actually out there?” and get an answer.
If you have a website, you can put a full Human Design calculator right on it, for free. Your visitors run their chart, and (if they choose to) their name and email land in your list. The setup takes about two minutes.
Come play with it: beta.bodygraph.io
Love Love
Talis
No posts
Comments
Nothing yet. Say the first thing.
Sign in to join the conversation.