
Sentiment improved for payments and fintech companies during Q2. Here are my key themes:
U.S.A.! U.S.A.!: The U.S. showed out during Q2 with card PV growth nearing 10%, suggesting the secular story may have more room to play out than previously thought. On the other hand, select European markets were highlighted as being softer, including the U.K. (by GPN) and Germany (by KLAR).
Big Deal(s): Stripe and Advent International are in talks to acquire PYPL and Silver Lake emerged as a potential suitor for Workday (WDAY). While I have no idea if these deals actually get done, the intent signifies potential value across payments, fintech, and payroll and HCM.
E-Com Strength: Braintree’s growing mid-teens, Worldpay low-DDs (even after absorbing the negative impact from Middle East airlines), SHOP 30%, and ADYEN mid-20s. Who’s exactly losing?
Middle East Conflict: With few exceptions, the Middle East conflict had a smaller-than-expected impact on travel volumes during Q2 with other corridors picking up the slack. Still, rolling the impact forward resulted in modest guidance cuts for GPN and FOUR.
AI: Data + customer trust + AI = a winning formula for some payments and fintech companies? I’m not ready to claim AI winners, but there’s little evidence to suggest payment companies are destined to be AI losers.
Pedal Down on Buyback. Although it backed off somewhat from Q1, I still estimate the aggregate quarterly buyback amount was up approximately 30% in Q2 vs. the quarterly average of 2025.
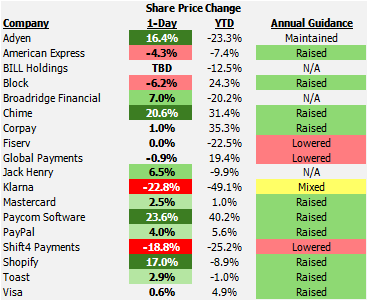
Below is a recap of earnings for the companies I follow most closely, in alphabetical order:
Synopsis: ADYEN moved the ball forward by delivering H1 results consistent with expectations, continuing to sign marquee clients, expanding the scope of its relationship with other key clients (like TOST), and introducing (or acquiring) products that move ADYEN beyond processing to a role as a commerce partner for enterprises and platforms.
Most Important KPI(s): FXN net revenue increased 22% in Q2, up 2-points from Q1. For H1, FXN net revenue grew 21%, at the midpoint of its 20-22% guidance. Adjusting for FX, I suspect H1 processed volume grew 25-26%, a bit better than 23-24% growth during 2025. Reflecting the acquisitions of Talon.One and Orb, ADYEN raised its FXN net revenue growth guidance by 1-point (to 21-23%) but lowered its EBITDA margin guidance by 1-point.
Best Part(s) of Earnings: While not overstating its impact, the signing of OpenAI as a client is a proof point that ADYEN is not ‘falling behind’ Stripe among AI-native companies. Processed volume growth of 26% (likely to be similar on an FXN basis) during Q2 is really impressive at ADYEN’s scale, suggesting no let-up in ADYEN’s market share gains.
Worst Part(s) of Earnings: ADYEN’s EBITDA margin declined slightly year-over-year despite gaining leverage on people-related costs (up 15% vs. reported net revenue growth of 19%) as other operating expenses grew 31.5%, or 28% excluding one-time acquisition costs. IT costs, bad debt, and miscellaneous expenses were the primary drivers of the significant increase.
Under The Radar: North American net revenue grew 30% on an FXN basis during H1, up from 26% in H2 2025, suggesting ADYEN’s investments in the highly competitive market are paying off.
Valuation: ADYEN trades at about 20x on an EV-to-2026 EBITDA basis, an attractive level in my opinion and a discount to other high-growth payments and fintech peers, including Shopify (75-80x) and Toast (33x).
Synopsis: Despite raising revenue guidance (now up 10% vs. 9-10% previously), AXP maintained its EPS outlook, opting to direct top-line upside into customer acquisition and technology investments while also absorbing higher-than-expected rewards and partner costs. Billed business growth benefited from a strong domestic spending environment yet still trailed peers due to ongoing commercial weakness where AXP recently launched a modern expense management platform and plans a series of product refreshes to better compete with upstarts like Brex, Divvy, and Ramp.
Most Important KPI(s): FXN revenue grew 10%, similar to Q1, and at its aspirational long-term target. Discount revenue, AXP’s largest source, and anchor of its spend-centric business model, increased 8% FXN, up 1-point from Q1. FXN billed business grew 9% similar to Q1 (up 70-bps pre-rounding).
Best Part(s) of Earnings: U.S. consumer billed business grew 11% during Q2, reflecting low-teens (13%) growth in travel and entertainment spend. Credit quality remained excellent with the net write-off rate stepping down 10-bps to an industry-leading 2.2%.
Worst Part(s) of Earnings: Variable customer engagement (VCE) costs represented 44.6% of revenue, up 260-bps vs. the prior year period. For the full year, AXP now expects VCE to be 44-45% of revenue, up from its prior target of approximately 44%. U.S. commercial billed business grew less than 5% during Q2, much slower than low double-digit growth for V and MA.
Under The Radar: H1 results benefitted from some non-recurring items, including a reserve release and an indeterminable amount of favorable items, causing other expense to fall by $334MM. If I adjust for these, I estimate H1 pre-tax profit margin would be down by approximately 2-points vs. last year.
Valuation: At about 18.5x NTM EPS, AXP trades at a premium to its pre-pandemic average of the mid-teens, a rarity for mature payments and companies.
Synopsis: BILL’s FQ4 results exceeded expectations but the company offered a cautious initial FY27 revenue outlook reflecting recent go-to-market changes (selling the platform, not individual solutions), deemphasizing custom solutions for specific bank partners, and headwinds from reduced acceptance of its spend-and-expense (S&E) product at a small number of merchants. Moving forward, BILL will reduce S&E revenue by rewards costs to arrive at net revenue. On this basis, net revenue growth plus non-GAAP operating profit as a percentage of net revenue, BILL expects to be a rule of 40 company exiting FY27.
Most Important KPI(s): TPV of $98.2B increased 14% (up 2-points) with AP/AR TPV growing 13% (up 2.5-points). Core revenue (which excludes interest on client funds) increased 16%, at the high-end of its 13-16% guidance but consistent with YTD results.
Best Part(s) of Earnings: Despite a softer top-line outlook, BILL’s FY27 non-GAAP EPS guidance was comfortably ahead of consensus. Excluding interest on client funds, BILL’s non-GAAP operating margin is expected to expand nearly 6-points in FY27 with about 4-4.5-points (or $80MM in savings) coming from the reduction-in-force and the remaining 1.5-2-points from additional operating leverage. As of its earnings date (August 19), BILL had repurchased $600MM of its shares since the $1B authorization in May, or 14% of its outstanding shares.
Worst Part(s) of Earnings: BILL expects mid-term core revenue growth of ‘low-DDs to mid-teens’, below FY26 core revenue growth of 16%. The monetization rate for AP/AR fell due to a greater mix of lower yielding ACH volume. While BILL expects to generate $125MM of GAAP net income during FY27, interest on client funds is expected to be $138MM.
Under The Radar: Although BILL is seeing good adoption of its AI products and features by customers, AI is driving significant internal efficiencies, including reducing loss rates for its invoice financing program by approximately half.
Valuation: BILL expects to generate $125MM of GAAP net profit during FY27. If we add back amortization of acquired intangible asset expense of approximately $60MM ($47MM net of tax), it implies $172MM of normalized net profit. On 104MM shares, this implies EPS of approximately $1.65. At $48 per share, this translates to about 28-29x NTM EPS.
Synopsis: XYZ delivered another beat-and-raise quarter, but it failed to impress the market. Why? I think it could be a number of things: (somewhat) stalled momentum for primary banking actives (PBAs) and commerce enablement volume growth at Cash App (in direct contrast to CHYM), slowing consumer lending growth (expected), and elevated losses with an unclear view of the trend in loss rates across XYZ’s different lending products. Still, absolute growth rates are attractive and valuation remains undemanding, in my view.
Most Important KPI(s): Square GPV grew 13% on a constant currency basis, up 2-points from Q1, with nearly 10% U.S. growth and a 25% increase internationally. Cash App gross profit grew 31%, down 7-points from Q1, reflecting the start of more difficult comparisons due to the ramp of Borrow approximately one year ago.
Best Part(s) of Earnings: At 19%, Cash App’s commerce enablement volume growth (excluding Cash App Business) remains robust. In fact, on the call, the CFO stated that Cash App Card volume (the largest part of Cash App commerce enablement volume) was growing more than 20% despite the product being a decade old and it being the fourth largest debit portfolio in the U.S. Square continues to build momentum with gross profit growth set to improve in H2 and converge with GPV growth as it laps the processing partner headwind from a year ago.
Worst Part(s) of Earnings: Everything has slowed a bit at Cash App: PBAs up 17% vs. 22% two quarters ago, commerce enablement volume excluding Cash App Business up 19% vs. 21% in both of the prior two quarters, and total inflows up 13% vs. 15% two quarters ago. Losses roughly doubled from a year ago despite a marked slowdown in consumer lending origination growth. There is a lack of visibility into specific loss rates for XYZ’s varied lending products.
Under The Radar: While XYZ positions itself as an AI leader, I am not seeing the same impact for customers from AI-enabled features as shared by peers. As an example, TOST and SHOP are disclosing specific numbers for Toast IQ Grow and Sidekick, respectively, suggesting traction and favorable outcomes. Although I may be missing it or am simply too hard on XYZ, I do not believe the same can be said for XYZ with Managerbot and Moneybot.
Valuation: Trading at just 13.5x on an EV-to-2026 EBITDA basis, XYZ remains ‘cheapest’ among high-growth payments and fintech peers (TOST at 33x, ADYEN at 20x, and SHOP at 75-80x), suggesting further upside potential if XYZ can execute on the medium-term financial goals. The evidence, so far, suggests they can, so I believe shares deserve to move higher.
Synopsis: BR’s closed sales bounced back during FQ4, outperforming its recently lowered guidance by nearly $40MM, easing concerns. FY closed sales of $305MM were up 6%, bringing them approximately in-line with the midpoint of BR’s original guidance. For the upcoming FY, BR is forecasting results consistent with its historical growth algorithm: 6-8% recurring revenue growth, 8-12% EPS growth, and over 100% FCF conversion.
Most Important KPI(s): Equity positions (that generate revenue) were up 12% during FY26, level with FY25, led by continued strength in managed accounts. Fund positions grew 6%, down only 1-point from FY25. Organic recurring revenue growth was 6% during FY26, in-line with BR’s 10-year average (with a range of 4-9%). Recurring revenue backlog ended FY26 at $470MM, up 9% from FY25, providing strong visibility into BR’s near-term outlook.
Best Part(s) of Earnings: Position growth, the primary driver of long-term growth in Broadridge’s regulatory and communications franchise, shows no signs of meaningful slowing. Although BR is starting FY27 with a closed sales outlook similar to FY26 ($290-330MM), BR’s pipeline ended FY26 up one-third over FY25, giving BR a high level of confidence in achieving its closed sales outlook.
Worst Part(s) of Earnings: The SEC’s new proposed e-delivery rule is likely to create a modest headwind to BR’s recurring revenue growth when it is implemented over a 2-3 year period.
Under The Radar: Although tokenized securities pose an unknown risk to BR, it is actively building a hybrid model to reach registered, beneficial, and tokenized shareholders, solving a potentially complex problem for issuers, its specialty.
Valuation: At <16x NTM EPS, Broadridge trades at a meaningful discount to its low-to-mid 20s average over the past decade. I continue to believe that is just too low for a business with a virtual monopoly in proxy distribution and a highly complementary regulatory and communications franchise that together represent close to 70% of profits.
Synopsis: Adoption of Chime Prime, CHYM’s most premium membership tier (reserved for customers making $3k of qualifying monthly direct deposits and offering 5% cash back on spending at self-selected merchant categories), resulted in a material inflection in CHYM’s total spend volume growth during Q2 following several quarters of slowing growth. The market sent shares significantly higher on the results, deservedly so, in my opinion.
Most Important KPI(s): Card purchase volume of $38.0B increased 17%, a 5-point improvement from Q1. Including outside instant transfers, volume growth was 20%, also 5-points higher than Q1. Overall, revenue grew 27%, up 2-points from Q1.
Best Part(s) of Earnings: Chime Prime is attracting new higher-earning members and convincing existing members to direct more of their spend to CHYM. MyPay loss rates fell even further to 0.9%. CHYM is raising limits for MyPay loans and widening eligibility. Although this may result in moderately higher loss rates, it is likely to be accretive to CHYM’s transaction profit growth. Shortly before the earnings announcement, CHYM announced a 10% reduction-in-force. This, coupled with better top-line momentum, is likely to result in meaningfully higher profitability for CHYM over the near-term.
Worst Part(s) of Earnings: Rewards costs came in higher-than-expected as members focused spending on their cash-back category, like gasoline, limiting the flow-through of volume upside.
Under The Radar: CHYM is seeing strong traction with its enterprise offering (announced a 320k employee customer and a 35k employee retailer most recently), setting the stage for it to become a ‘meaningful’ contributor to member growth in FY27.
Valuation: Based on my modeling, I believe CHYM can do around $500MM of GAAP EBITDA in FY27, implying an EV-to-EBITDA multiple above the mid-20s. While I admittedly ‘missed the boat’ on CHYM t lower levels, I am not inclined to chase the stock at these levels.
Synopsis: CPAY’s strategy to reorient its business towards corporate payments continues to bear fruit as it delivered another quarter of double-digit organic revenue growth bolstered by highly accretive M&A to drive significant EPS growth. CPAY continues to be one of the most underappreciated compounders in payments.
Most Important KPI(s): Organic revenue grew 10%, down 1-point from Q1. Corporate Payments, which now make up about 40% of CPAY’s revenue, grew organically by 18% excluding float income.
Best Part(s) of Earnings: New sales were up 30% with 40% growth in Corporate Payments. Retention in Corporate Payments is closer to 96-97%, above CPAY’s corporate average of about 93%. AvidXchange’s (which CPAY owns 33% of and TPG the rest) EBITDA more than doubled in Q2, a step-up from 50% growth during Q1, once again demonstrating CPAY’s ability to significantly enhance the earnings power for acquired companies.
Worst Part(s) of Earnings: H2 EBITDA margins are expected to be slightly below the prior year’s, reflecting ongoing investments to sustain CPAY’s attractive organic growth rate. U.S. vehicle payments growth slowed due to a reallocation of sales investments to Corporate Payments.
Under The Radar: CEO Ron Clarke noted some deal multiples are moving back into a realistic range (from presumably being too high), suggesting additional accretive M&A opportunities for CPAY.
Valuation: At a mid-teens NTM P/E (burdened for SBC), CPAY’s valuation remains imminently reasonable for a company that can sustain DD organic revenue growth rate in larger and less competitive payments markets.
Synopsis: Following the surprise departure of Mike Lyons, new CEO Takis Georgakopoulos started his tenure at FISV by lowering top and bottom-line expectations for 2026, reflecting weaker macro conditions in Argentina, slower conversions and product launches, and an incremental $100MM investment in FISV’s technology infrastructure, especially Financial Solutions. No changes were made to the 2026-2029 outlook provided at FISV’s May 2026 investor day, but it now starts off a lower base.
Most Important KPI(s): Organic revenue fell 5% with a 1% decline in Merchant and an 8% contraction for Financial Solutions. While Q2 appears to mark the bottom, as expected, the rebound in H2 will not be as strong as anticipated, prompting FISV to lower its FY organic revenue guidance to a 0.5% decline at the midpoint, down 2.5-points. With the lowered revenue guidance and incremental technology investment, FISV reduced its adjusted operating margin outlook by over 250-bps, reflecting a nearly 8-point decline from 2024.
Best Part(s) of Earnings: Underlying Clover volume growth remained relatively steady at 11%. FISV’s FCF conversion over the LTM was >100%. Although anecdotal, FISV noted a ‘dramatic’ increase in its enterprise pipeline reflecting its platform modernization.
Worst Part(s) of Earnings: A further reset calls into question whether the problems at FISV have been fully identified, especially considering the incremental $100MM technology investment. Recurring revenue grew only 2% in Q2, suggesting acceleration is needed to reach FISV’s 4-6% growth target for 2026-2029.
Under The Radar: In conjunction with the results, FISV’s new CEO signaled a broader portfolio review, which may result in additional actions to streamline its footprint, including exiting non-leadership positions.
Valuation: FISV trades at 7x NTM EPS. Although low, it represents a slight premium to peer GPN (6x).
Synopsis: Citing the continuation of the Middle East conflict, GPN lowered its FY26 organic net revenue growth outlook to 4-5% from approximately 5% previously, framing it as ‘de-risking’ the H2 outlook. The market agreed and largely looked past it, preferring to focus on the potential for accelerating organic revenue growth in FY27.
Most Important KPI(s): Organic revenue grew 4%, down 50-bps from Q1, but reflecting an approximately 1-point headwind from the Middle East conflict and lower tax payments, suggesting underlying momentum may have picked up a bit, not surprising given the strong North American backdrop.
Best Part(s) of Earnings: GPN firmly backed an expectation for accelerating organic revenue growth in 2027, citing the lapping of the Middle East headwind, contribution from recently signed and converted enterprise and platform deals, and a growing impact from Genius. That being said, GPN was quick to point out that it takes a fair amount to ‘move the needle’ so one should not expect material acceleration. As of today, while I think it can be 6%, I believe the starting guide for organic revenue growth in FY27 will be 5-6%.
Worst Part(s) of Earnings: GPN continues to record significant charges that make ‘adjusted’ earnings and FCF differ significantly from current cash earnings power. The onus is on GPN to significantly close the gap in the two numbers over the next handful of quarters. The U.S. card market grew at its fastest rate in some time (outside of the pandemic). Even that was not enough for GPN to overcome the Middle East headwind.
Under The Radar: Excluding non-core parts (partners no longer making merchant referrals, non-core portfolios from Worldpay, and a managed services relationship for a departing portfolio), organic revenue growth was 5.5% in Q2 and 6% for H1, suggesting a slightly stronger underlying business.
Valuation: GPN trades at little more than 6x NTM EPS, reflecting a significant amount of skepticism about its ability to sustain MSD organic revenue growth. If they can build confidence in FY27 acceleration, I believe there is ample room for the multiple to expand.
Synopsis: JKHY delivered strong results in FY26: organic revenue increased more than 7%, underlying margins expanded 90-bps, and FCF conversion was 101%. JKHY is signing more, and larger, core banking customers and selling them more solutions upfront, setting the table for continued revenue momentum. To that end, JKHY expects another year of approximately 7% organic revenue growth and is cautiously optimistic they can exceed their initial guidance for 20-40-bps of underlying margin expansion, as they have done during the past couple of fiscal years.
Most Important KPI(s): Organic revenue grew 6.6% in FQ4, above expectations. In FY26, JKHY won 58 core deals, up from 51 a year ago. 59% of FY26 core wins included digital banking and card processing, higher than 39% in FY25. Non-GAAP operating margin rose more than 90-bps to 24%.
Best Part(s) of Earnings: JKHY expects 58-65 core wins during FY27, up from 58 in FY26. While the disruption at FISV (JKHY’s primary competitor for community banks and credit unions) is contributing to strong sales performance, JKHY noted it is taking share from everyone, not just FISV. Reflecting that momentum, JKHY reported that core wins QTD (50 days) have already outpaced the entire Q1 in FY26 (92 days).
Worst Part(s) of Earnings: Despite the pick-up in core wins, it has not translated into a material acceleration for organic revenue growth…yet. For FY27, the midpoint of JKHY’s guidance calls for 6.8% organic revenue growth, down 50-bps from FY26 and about 80-bps below JKHY’s 5-year average of 7.6%. While JKHY is cautiously optimistic it can do better than its forecast for 20-40-bps of underlying margin expansion during FY27, it faces heightened investment requirements for a number of items (cyber, AI, data center consolidation), potentially limiting upside.
Under The Radar: After stagnating for several years, JKHY has delivered underlying margin expansion of 60, 70, and 90-bps during FY24, FY25, and FY26, respectively. While there is not one single magic bullet, JKHY has credited AI with driving efficiencies across its organization, making them a potential low-key ‘AI winner’.
Valuation: At 23x NTM EPS, JKHY is less expensive than it has been in the past, but is in no way cheap, especially compared to other similarly attractive businesses across payments and fintech.
Synopsis: Similar to V, MA reported solid results for the June quarter on the back of strong domestic spending and a smaller-than-anticipated headwind from the Middle East conflict. MA raised its FY26 organic net revenue growth outlook to the higher-end of ‘high-end’ of low double-digits.
Most Important KPI(s): Organic net revenue grew 12%, same as Q1. FXN global PV increased 10%, up 1-point from Q1. Switched transactions grew 9%, similar to Q1. FXN cross-border volume grew 12%, down 1-point from Q1.
Best Part(s) of Earnings: Excluding the Capital One conversion, U.S. switched volume growth was 10% during the first 4 weeks of July, up 2-points from Q2, suggesting sustained underlying domestic momentum for MA. Cross-border assessment revenue increased 20% for MA in Q2, comparatively higher than V’s 6% growth rate for international transaction revenue, suggesting a more favorable mix of cross-border spend for MA.
Worst Part(s) of Earnings: MA’s European purchase volume growth slowed to 10.5% FXN in Q2, down from more than 15% a year ago, falling below V’s European growth rate for the first time in at least several quarters. While strong at 18%, MA’s FXN VAS net revenue growth trails V’s growth by a significant margin, narrowing MA’s net revenue growth outperformance relative to V.
Under The Radar: MA now switches 72% of transactions made by cards carrying its logo(s), up from approximately 55% in 2018. Not only does increased switch penetration boosts MA’s economics, it feeds MA’s enormous data trove, enabling more sophisticated VAS.
Valuation: Over the past decade, Mastercard has traded at a 4-point premium to Visa on an NTM P/E basis. It currently sits at about 1.5-points.
Synopsis: PAYC reported excellent Q2 results and bumped up its FY guidance, still leaving room for upside if current momentum persists. While CEO Chad Richison typically has little to say on calls, this quarter he let the results do all the talking.
Most Important KPI(s): Recurring revenue grew 11%, up 2-points from Q1, despite a much more challenging comp (Q2 2025 recurring revenue growth was nearly 12.5% vs. 7% during Q1 2025). Average client fund balances were up 9%, a 1-point improvement from Q1.
Best Part(s) of Earnings: H1 recurring revenue grew 10%, better than the 8-9% forecast for the FY (raised from 7-8%). While comps get a little bit tougher in H2, it certainly appears like there’s upside potential to the current forecast. PAYC expects FCF to exceed $650MM in FY26, a 60% increase from FY25. Since the start of 2026, PAYC has repurchased nearly 20% of its outstanding shares paying about $127 per share, significantly below the current price of $222.
Worst Part(s) of Earnings: Given PAYC’s limited quarterly disclosures (they provide a more complete view annually), it is difficult to ascertain the exact source of upside: is it client growth, cross-sell, improved retention, or pricing? Or a combination of all four?
Under The Radar: According to PAYC, its data center investments are yielding significant savings. Last year, PAYC spent $100MM to prep its data centers to host its own AI models. This year, those investments have resulted in R&D savings of about $100MM and an additional $30MM in savings by processing IWant queries.
Valuation: I believe PAYC can generate more than $950MM of GAAP EBITDA in FY26, implying an EV-to-EBITDA multiple of about 11.5x. That could prove to be an attractive valuation if PAYC can accelerate recurring revenue growth to the DDs.
Synopsis: Against the backdrop of a rumored bid by Stripe and Advent International (Advent), PYPL delivered decent Q2 results as branded online checkout stabilized, BNPL growth accelerated, and transaction margin dollars (TM$) benefited from a reserve release. As part of his new strategy, CEO Enrique Lores plans a more significant push into financial services for PYPL, including credit. While this makes sense given PYPL’s consumer-facing assets, it places PYPL in direct competition with other lend-centric fintechs.
Most Important KPI(s): TM$ excluding interest on client funds grew 3% during Q2, similar to Q1, and better than the LSD decline anticipated. Branded online checkout TPV grew 2%, also level to Q1. Branded experiences [online plus in-store (debit and tap-to-pay)] TPV grew 6%, up 1-point from Q1.
Best Part(s) of Earnings: Braintree volume maintained its mid-teens growth rate during Q2. BNPL volume growth accelerated to 26%, up 3-points and at the higher-end of BNPL peers. PYPL raised its FY outlook for TM$ excluding interest on client funds (up 2% now vs. ‘roughly flat’ previously) and branded online checkout (up LSD now vs. ‘slightly positive to up LSD’ previously).
Worst Part(s) of Earnings: Normalizing for the reserve release ($27MM), TM$ excluding interest on client funds would have been up about 1.5% in Q2, still anemic. PYPL’s investments in incentives to drive consumer habituation are now expected to be less than the original 3-point headwind, contributing to the guidance upside. The increase in EPS guidance is partially attributable to a lower tax rate.
Under The Radar: PYPL plans to reinvest a significant portion of its $1.5B in gross savings from its multi-year restructuring program. Reflecting this, PYPL increased its opex guidance for FY26, now expecting 7-8% growth vs. 3% previously.
Valuation: PYPL is trading above the rumored buyout bid by Stripe and Advent of $60.50 per share. Based on recent comparable transactions, I believe a price in the $73 range is reasonable.
Synopsis: Despite delivering solid Q2 results (11% organic GRLNF growth, higher including Global Blue) FOUR shares sold-off significantly as they lowered their FY26 top and bottom-line guidance due to a continuation of the Middle East conflict (adding a $25MM headwind for Q3, but none for Q4), a less favorable FX outlook ($20MM incremental headwind), and the added interest expense from its recent debt raise. While there seemed to be confusion and disappointment following the report, my analysis suggests H2 guidance embeds a continuation of low-DD organic GRLNF growth after accounting for the ‘moving parts’.
Most Important KPI(s): Organic GRLNF increased 11%, in-line with Q1. FOUR’s blended spread of 65-bps during Q2 was up approximately 3-bps over the prior year. FOUR’s adjusted EBITDA margin fell 4-points from the prior year period to about 45.5%.
Best Part(s) of Earnings: After accounting for FX movements, underlying organic GRLNF growth improved by approximately 1.5-points from Q1.
Worst Part(s) of Earnings: Given seasonally weaker FCF during Q2, FOUR repurchased only a modest amount of stock, despite attractive prices, citing a constrained balance sheet. To make matters worse, after conceptually discussing bolt-on M&A as a potential use of its (limited) excess capital, FOUR disclosed an acquisition in its 10-Q after the fact. Some people may have been expecting a larger impact from the World Cup. That simply did not materialize as FOUR cited a typically busy summer schedule for its stadium customers.
Under The Radar: Despite a $15MM headwind from the Middle East conflict, pro-forma Global Blue GRLNF grew by an estimated HSD rate in Q2 suggesting underlying growth in the mid-teens with strong inbound travel to the U.S. and Asia outperformance contributing.
Valuation: At around $47 per share, FOUR trades at 9x the midpoint of its non-GAAP EPS ($5.25) estimate. If I burden EPS for SBC expense and recurring acquisition and restructuring costs, it reduces non-GAAP EPS by about $1.50, implying normalized EPS of $3.75 and a P/E of 12.5x, very low for a company delivering low-DD organic revenue growth. The question is can they sustain it? If so, the stock should be much higher.
Synopsis: After stumbling following last quarter’s (somewhat) cautious outlook, and a general SaaS sell-off, SHOP reasserted itself with strong Q2 results and excellent Q3 guidance. SHOP is positioning the product catalog from its long tail of online merchants as highly valuable in an agentic world. While that may or may not be the case, after all there is little agentic commerce taking place now, what is not in dispute is SHOP’s current performance is exceptional.
Most Important KPI(s): FXN GMV grew 30%, marking a fifth consecutive quarter of growth between 29-30%. Gross profit increased 30% on an FXN basis for the second consecutive quarter, significantly exceeding guidance for growth in the mid-20% range.
Best Part(s) of Earnings: SHOP’s payments penetration improved 320-bps year-over-year, a slight improvement from Q1. Capital revenue of $91MM increased nearly 50% vs. the prior year. As in past quarters, SHOP’s GMV growth remains best-in-class with strength across geographies, products, and channels.
Worst Part(s) of Earnings: There was little to critique in SHOP’s Q2 results, but if forced to, I would flag the modest decline in subscription gross margin, owing to elevated, but not rising, costs to power AI features for merchants, including Sidekick.
Under The Radar: Despite increasing payments penetration, which is a lower margin revenue stream, SHOP’s merchant gross margin expanded on a year-over-year basis for a second consecutive quarter with SHOP noting generally higher payments gross margins in international markets where debit is more prevalent and interchange rates are structurally lower. Additionally, SHOP is seeing strong growth in high-margin products like capital within its merchant business.
Valuation: Burdened for SBC expense, I estimate Shopify trades at an EV-to-2026 EBITDA multiple of approximately 75-80x. While SHOP is an extraordinary business, it currently carries the price tag to go along with that designation.
Synopsis: TOST continued its solid momentum during Q2 with 28% recurring gross profit growth, 9.5k net location adds (a quarterly record and up 1k over last year’s Q2), and 22% GPV growth. New markets (international, enterprise, and food and beverage retail) are on track to reach $200MM of ARR by the end of FY26, approximately doubling from a year ago.
Most Important KPI(s): GPV growth of 22% was steady with the prior two quarters. TOST’s payment net take rate of 49.8-bps expanded about 1-bps from a year ago. SaaS ARPU on an ARR basis increased 5% from a year ago, marking the seventh consecutive quarter in the 4-6% range.
Best Part(s) of Earnings: TOST is seeing good traction with Toast IQ Grow, its agentic-powered marketing platform for restaurants, and it is on track to become the fastest product to reach $10MM of ARR. TOST disclosed that its core SMB restaurant business is growing recurring gross profit at 20% with a greater than 40% adjusted EBITDA margin.
Worst Part(s) of Earnings: TOST raised its FY26 adjusted EBITDA guide by less than the Q2 beat as it plans to fully reinvest a $10MM tariff refund it received during Q2. As expected, advanced purchases of hardware components depressed FCF during Q2 and will eventually flow through to lower hardware gross margins in 2027. Although GPV growth remained strong at 22%, it failed to accelerate from Q1, despite what was arguably a better domestic spending environment.
Under The Radar: TOST’s work on its hardware supply chain will result in a lower-than-expected negative impact during FY26 and FY27 and boost hardware gross margins over the long-term.
Valuation: TOST has regained its premium valuation, trading at an EV-to-2026 EBITDA multiple of approximately 33x when adjusted EBITDA ($837MM) is burdened for SBC ($238MM), pushing TOST back into the ‘too expensive’ category, in my opinion.
Synopsis: V delivered steady results with organic net revenue up 12% in FQ3 and 13% FYTD. As a result, V upped its FY26 organic net revenue growth outlook to the ‘low-end of low-teens’ from ‘low-double-digit to low-teens’ despite a slightly larger headwind from lower FX volatility. VAS continued its extraordinary run, growing 34% FXN in FQ3 (high-20% organic). VAS now represents nearly one-third of V’s net revenue.
Most Important KPI(s): Organic net revenue grew 12% during FQ3, down 3-points from the March quarter due to a step-up in client incentive growth and comping against a period of high FX volatility during the prior year. FXN global PV increased 10%, up 1-point. FXN cross-border volume grew 13%, also up 1-point due to 3-points of acceleration in cross-border e-commerce volume growth. Processed transactions increased 10%, once again up 1-point from the March quarter.
Best Part(s) of Earnings: Outside of pandemic-impacted periods, U.S. payment volume growth was the strongest since FY19 with V noting acceleration across consumer cohorts (low income and higher spend bands) and merchant categories (discretionary and non-discretionary). Although some of this was due to non-recurring factors (the World Cup, shifting of Prime Day, and higher gas prices), the underlying spending environment remains constructive, which is a plus for V given its larger exposure to the U.S. relative to MA. The U.S. is also among the most profitable payments markets.
Worst Part(s) of Earnings: Marketing and advisory continues to be the fastest growing part of V’s VAS business. Although not disclosed specifically, I believe it may be among the lowest margin businesses for V and an outsized contribution from the Olympics and World Cup during FY26 could set up a more difficult comparison in FY27. After adjusting for strong VAS performance, V’s payment network net revenue appears to have increased only 5-6% FXN during FQ3 due to a more difficult client incentive comparison.
Under The Radar: With the launch of a new solution combining the best parts of V’s legacy debit processing business and Pismo’s modern banking platform, V is making a full court press for small and mid-sized banks and fintechs, potentially encroaching on territory held by companies like Jack Henry and Marqeta.
Valuation: After touching 22-23x earlier in the year, V’s NTM P/E has rebounded to >25x, still about 2-points below its long-term average, which seems fair in my opinion.
As always, thank you for reading, and if you’ve enjoyed this, please consider sharing, liking, commenting, or subscribing!
Disclosure: As of August 20, 2026, of the stocks mentioned in this report and across payments and fintech, I am long Visa, Global Payments, Intuit, Block, Adyen, Shift4 Payments, Paychex, Mastercard, and Broadridge Financial. This report is for informational purposes only and is not a recommendation to buy or sell any stock. Finally, while I rely on the information in this report to guide my investment decisions, you should not, because I cannot guarantee its accuracy.
No posts
Comments
Nothing yet. Say the first thing.
Sign in to join the conversation.