
The data and information presented here are for informational purposes only and are provided “as is” without any warranty. This report is not intended or offered as financial, legal, regulatory, tax, or investment advice. References to particular assets or protocols are not recommendations or solicitations to engage with said asset or protocol. MKR/SKY voters and Sky Governance retain full control over parameter changes and are free to use or disregard this information as they see fit. This post does not constitute financial or investment advice. For financial advice, consult a professional advisor.
In this market update, we examine recent trends in legacy finance, the cryptoasset landscape, and the Sky Ecosystem, covering developments from February and March 2025. Note that all market commentary and data is updated as of March 24 - 26, 2025.
In March, Treasury Secretary Scott Bessent and Commerce Secretary Howard Lutnick each participated in an in-depth interview (1, 2) on the All-In Podcast, outlining the Trump administration’s fiscal strategy for the coming months and years. Broadly speaking, the administration appears to be prioritising a balanced budget, reduced foreign dependency on critical resources and supply chains, and reinvigorating the American middle class. In the Scott Bessent interview, Bessent explained that the administration is pursuing these objectives through a “three-legged stool” fiscal strategy:
Public sector de-leveraging: through initiatives such as DOGE, the objective is to cut spending and excess labour from the federal workforce. Bessent mentioned that the goal is to get debt and deficits down without causing a recession.
Private sector re-leveraging: the administration aims to ease what Bessent described as the “regulatory corset”, with a particular emphasis on supporting small to medium-sized regional banks. The administration believes that as the financial system begins its deregulation, the private sector can start re-leveraging.
Use tariffs to increase government revenue, reorder the international trading system, and bring manufacturing jobs back to the US: according to Bessent, the Trump administration intends to deploy tariffs as necessary to bring trading partners “into line” with U.S. interests. He noted that tariffs will also serve as a source of federal revenue, which could, in turn, help reduce income tax rates.
Other central components of the administration’s agenda, covered in more detail in the Lutnick interview, include the rollout of gold cards, cheap energy, and creating a Sovereign Wealth Fund aimed at generating higher long-term returns compared to current entitlement programs.
In response to the communicated plans and recent international tariff negotiations, markets have experienced heightened volatility, with U.S. equities and cryptoassets seeing notable pullbacks. The key takeaway seems to be that the rapid and wide-ranging policy shifts are generating a high degree of uncertainty, something which markets typically find unfavourable in the short-term. The next key date to watch is April 2nd, when reciprocal tariffs are expected to be announced.
During the March Fed meeting, the FOMC decided to hold the target range for the federal funds rate steady at 4.25% - 4.50% for a second straight meeting. The Fed’s quarterly projections included an increase in expected inflation in 2025 while GDP forecasts were revised down for 2025, 2026, and 2027.
The FOMC left inflation projections for 2026, 2027, and the longer run unchanged. This outlook appears to reflect, in part, the expected impact of the Trump administration’s tariffs. During the press conference, Chair Powell acknowledged the difficulty in dissecting the effects of tariffs from other factors on inflation, but nevertheless stated that the Fed’s baseline view is that much of the inflation increase expected in 2025 is tariff-driven and also considered transitory.
Regarding the decision to leave the policy path unchanged, Powell stated that there was a degree of inertia within the committee due to the current “highly uncertain environment”. The committee appears to hold the view that, given confounding economic factors and the Trump administration’s policy decisions lacking clear historical precedent, it is preferable to maintain the current stance rather than risk premature adjustments that could result in policy errors.
The 10Y rose from 4.24% at the end of October to approximately 4.89% around the time President Trump took office, before easing to around 4.31%. The most recent decline may reflect growing market expectations of potential deflationary or recessionary effects stemming from public sector de-leveraging and trade policy. The 10Y pattern may also suggest that the bond market, much like the Fed, remains in a “wait-and-see” mode. Upcoming economic reports may provide greater clarity. However, it is also worth noting that the longer uncertainty goes on, the more growth may suffer.
At the time of writing, target rate probabilities show a leaning toward a 25 basis point cut in June, with the highest probability assigned to a target range of 4.00% - 4.25%.
BTC and ETH spot ETF demand, viewed as a rough proxy for institutional interest in crypto, has declined in line with the broader pullback in cryptoasset prices. Over the past 30 days, cumulative BTC flows have fallen by $2.69 billion, while cumulative ETH flows have declined by $653 million. In the past 7 days, however, BTC cumulative flows have turned positive, rising by $449 million, whereas ETH cumulative flows have decreased by $40 million.
In February and March, several issuers including Fidelity, Bitwise, Grayscale, and 21Shares submitted filings to incorporate staking into their Ethereum ETFs. Blackrock also expressed interest in staking during a recent panel “Ethereum’s Appeal for Institutional Builders” at the Blockworks Digital Asset Summit. Robbie Mitchnick, Head of Digital Assets at BlackRock, emphasized that staking represents a meaningful component of ETH’s overall appeal to institutional investors. While these proposals have not yet been approved by the SEC, Commissioner Hester Peirce has previously expressed optimism about potential regulatory developments, including a reconsideration of staking for ETH ETFs.
Since our last market overview, BA Labs’ Funding Benchmark has continued to reflect subdued activity, fluctuating between 1.24% - 7.63%. The Supply and Borrow Benchmarks have also continued to move lower.
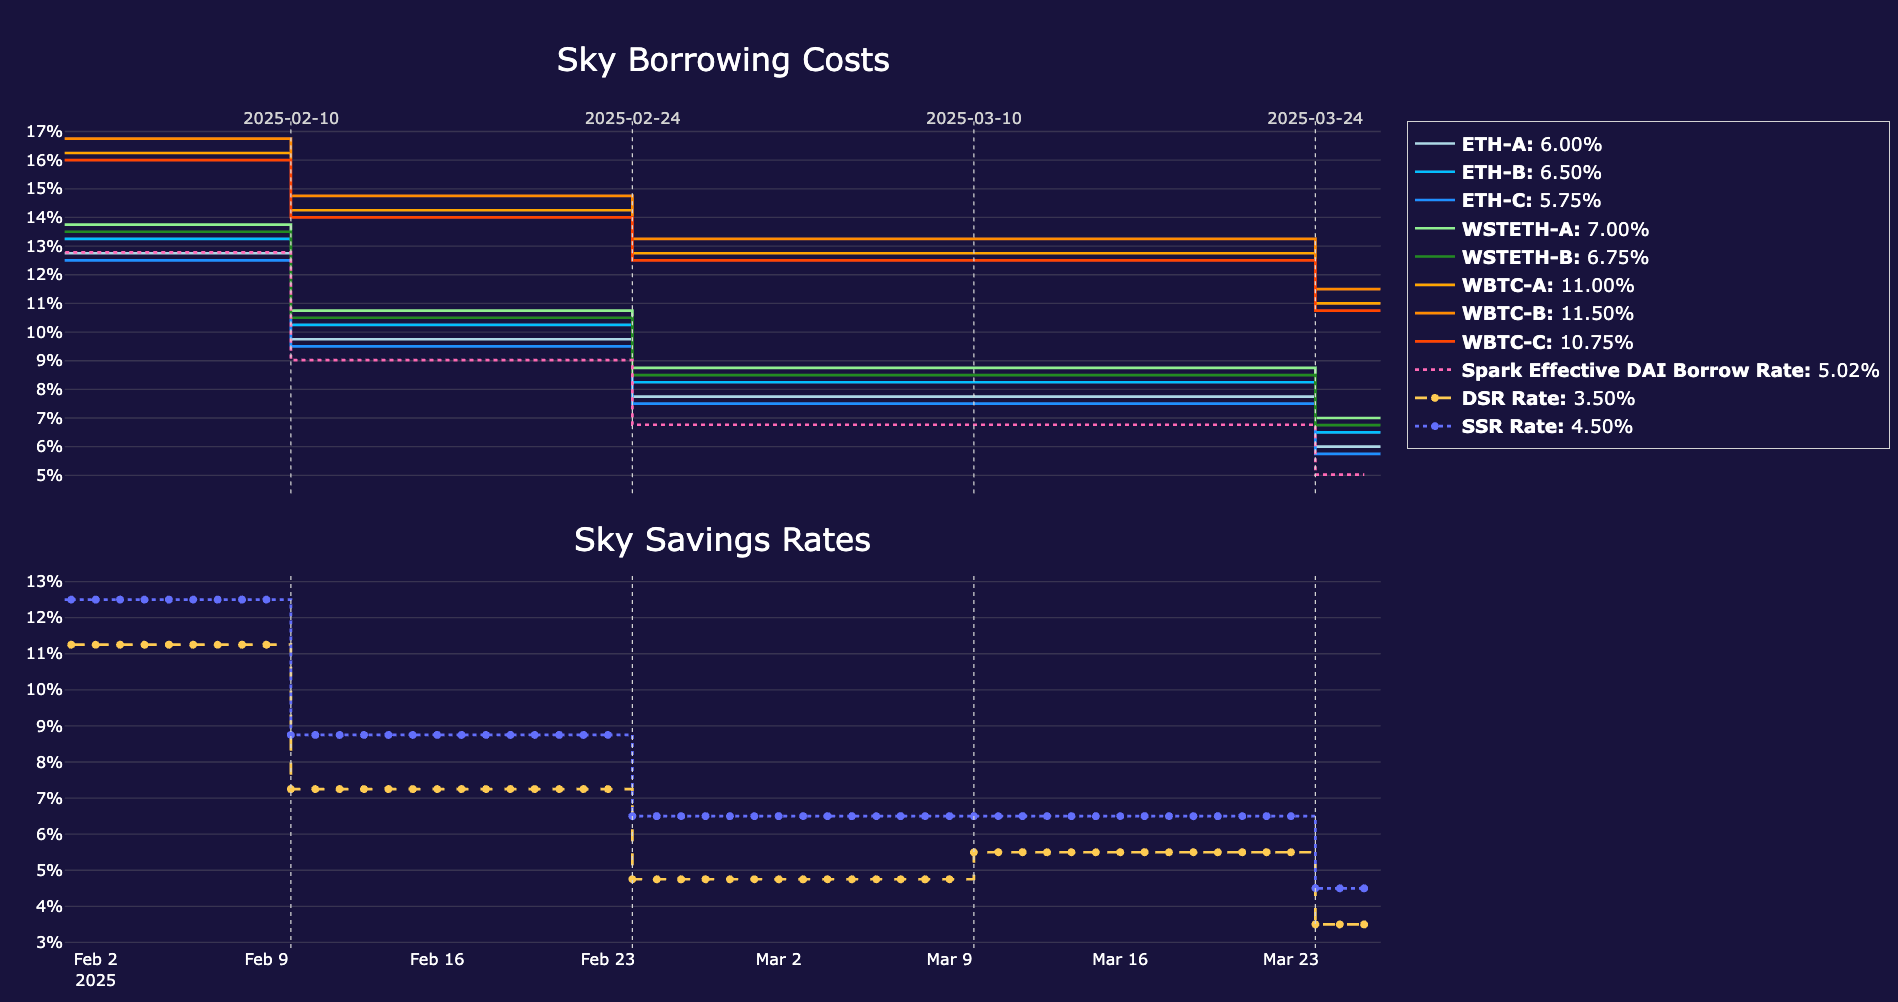
Borrow rates across major DeFi protocols on Ethereum Mainnet have continued to trend downward. Since our last market overview, Sky Core Vault stability fees have been reduced three times. Other protocols have also lowered their rates, contributing to a broader decline across DeFi.
A similar trend is evident in stablecoin supply rates. While both the SSR and DSR have undergone multiple reductions over recent months, they have remained within a competitive range. This has led to a significant increase in SSR utilization, as outlined in the “Savings Rates” section below.
In February, the Sky Ecosystem expanded USDS support to Arbitrum. On Arbitrum, USDS and sUSDS are supported through the Spark Liquidity Layer. As with the deployment on Base, USDS, sUSDS, and USDC are bridged into a peg stability module (PSM3) on Arbitrum, enabling liquidity for users on the network.
Since its launch, USDS supply on Arbitrum has grown to approximately 14.56 million. During the same period, USDS on Base has experienced substantial growth, reaching 101.38 million, gradually moving closer to the USDS supply on Solana, currently at 119.95 million. The total multichain USDS supply now stands at 235.90 million.
At a global level, stablecoin adoption has continued to accelerate. According to DeFiLlama, the total stablecoin market cap regularly reaches new all-time highs, currently standing at $234.616 billion. Similarly, the stablecoin market cap on Ethereum Mainnet has steadily climbed to new record levels, currently at $125.87 billion, up from $110.13 billion noted in our last market overview.
Regarding USDS market share across supported networks, on Ethereum Mainnet, USDS and DAI combined have increased from 6.01% to 6.62%. USDS market share on Solana is currently 0.97%, while on Arbitrum and Base, it stands at 0.40% and 2.49%, respectively.
In terms of collateral exposures, there have been few major changes since our previous update. The most notable development is the continued growth in stablecoin reserves, while other collateral categories have slightly decreased. Due to comparatively high SSR and DSR values amid the rapidly falling rate landscape, Sky’s collateral exposure in Q1 leaned heavily towards stablecoins and Cash RWA. This shift resulted in substantial growth in USDS supply, which in recent weeks has remained stable despite multiple rate reductions.
Following the recent announcement of the Spark Tokenization Grand Prix winners, an initiative set out to onboard up to $1 billion in tokenized RWA through the Spark Liquid Layer (SLL) to selected projects, the composition of the Cash RWA category may soon undergo significant changes. If approved by Sky Governance, allocations will be distributed as follows:
BUIDL (BlackRock, tokenized by Securitize) - $500M
USTB (Superstate) – $300M
JTRSY (Centrifuge-Anemoy Janus Henderson) – $200M
Taking a closer look at Spark exposures, the Spark Liquidity Layer has grown significantly in both absolute and relative terms, increasing from approximately $407.69 million (19.19%) to $594.07 million (27.61%). Meanwhile, both Spark Morpho DAI Vault and SparkLend have seen slight declines in their absolute and relative exposures, whereas the absolute exposure to Spark Aave Prime has remained flat.
BA Labs is currently developing a dedicated dashboard for the Spark Liquidity Layer, which will offer real-time insights into asset allocation changes. Once this dashboard becomes available, future editions of the Monthly Market Overview will incorporate this data.
The historically large SSR utilization has remained elevated throughout February and March. The combined SSR and DSR utilization rate stands at 51.57%, with SSR utilization ($3.23 billion) significantly outweighing DSR utilization ($1.04 billion). It remains to be seen whether the most recent parameter changes on March 24 will lead to any shifts in utilization.
In our previous market overview, we noted that the Sky Savings Rate (SSR) consistently remained above the market average, driving a significant increase in savings demand early in the quarter. This initial surge, combined with the inherently slower process of adjusting protocol parameters, as well as some large expenses which temporarily inflated annualised figures, led to the estimated annual net revenue briefly dipping into negative territory.
Following Stability Scope parameter adjustments, the estimate quickly recovered and returned to positive territory. The latest parameter update, implemented on March 24, further improved Sky’s estimated annual net revenue to approximately $86.55 million at the time of writing.
It is also worth noting that, as outlined in Sky in 2025 Update, several Sky stakeholders are currently working on an Automated Rate Setter, which will enable smoother adjustments to Stability Scope parameters and, for example, help the protocol manage periods of elevated SSR demand.
On February 24, Sky Governance voted to implement several changes to the Smart Burn Engine. Firstly, nearly all protocol-owned LP tokens (SKY <> USDS), except for 15 million USDS worth, were unwound from the Smart Burn Engine (SBE). The SKY tokens were transferred to the DS Pause Proxy (Sky Treasury), while the USDS were moved to the Surplus Buffer. Secondly, the Smart Burn Engine parameters were adjusted so that 100 percent of all excess surplus above 70 million USDS is allocated to burning/buy backs.
The resulting composition of protocol owned liquidity is illustrated in the image below. At the time of writing, Sky holds approximately $14.26 million worth of USDS<>SKY liquidity in Uniswap V2 and around $76.24 million worth of SKY tokens in its treasury. In the latest Executive Vote on March 24, the SBE hop parameter was reduced by 432 seconds, from 2,160 seconds to 1,728 seconds.
Since our last Monthly Market Overview, stability parameters have changed on four occasions. As illustrated in the chart below, parameters were changed on February 10, February 24, March 10, and March 24, as a result of Stability Scope Parameter Changes #21, #22, #23, and #24.
Comments
Nothing yet. Say the first thing.
Sign in to join the conversation.