

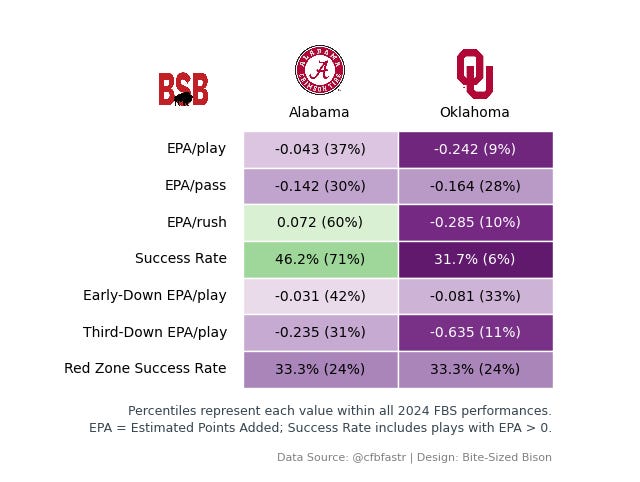
The 2025 College Football Playoff begins tonight (Dec. 19), kicking off a month of insane matchups, beginning with Alabama at Oklahoma. These two teams battled very recently (Nov. 15), and it ended as a defensive struggle, 23-21, somehow in favor of Oklahoma. SP+ gave Oklahoma just a 5.0% postgame win expectancy, which was the lowest of the season for a team that won. It looked like this.
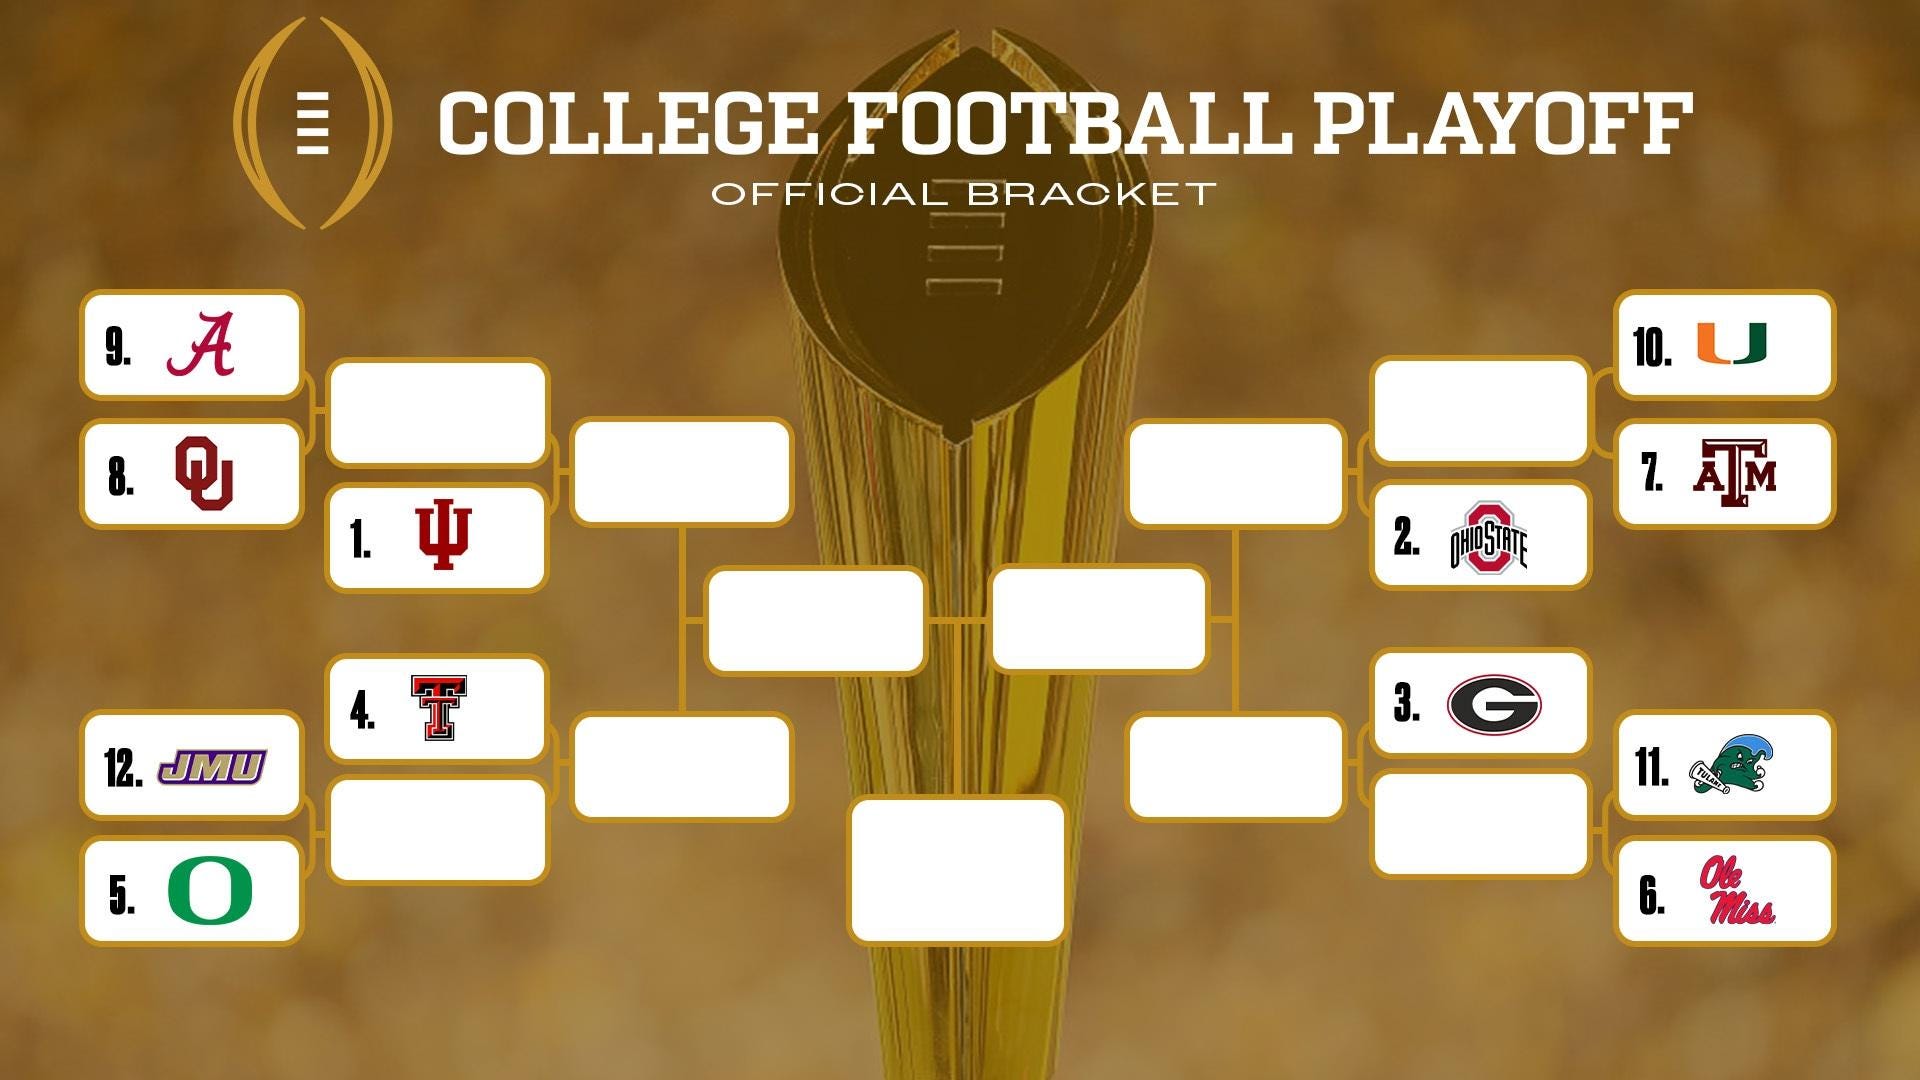
This inaugural matchup is particularly interesting to Indiana fans, who face the winner in the quarterfinal — at the Rose Bowl on Jan. 1.
Overview
Indiana didn’t necessarily draw an easy path, as the best defenses in the field are on the Hoosiers’ side of the bracket (as you’ll see below), but if the first two rounds fall the right way, there could be favorable matchups for IU — such as Indiana’s defense against Oklahoma’s below average offense, or Oregon’s weaker-than-Texas-Tech’s rush defense against Indiana’s imposing rushing attack that sets up its passing game.
Ole Miss’ offense has the easiest path of any offense not named Ohio State, and Miami got a tough draw due to its under-seeding (fair for its resume, of course). Ohio State may have its toughest test in the quarterfinal, depending on who wins on the other side of the bracket.
Oregon has a particularly tough path due to the wall of defenses its must punch through.
Overall, Indiana and Ohio State appear to be the two best teams in this field, but particular matchups could have the Hoosiers and/or Buckeyes on their heels a bit — the elite defensive fronts for Indiana’s offense and the explosive offenses for Ohio State’s defense being the primary two.
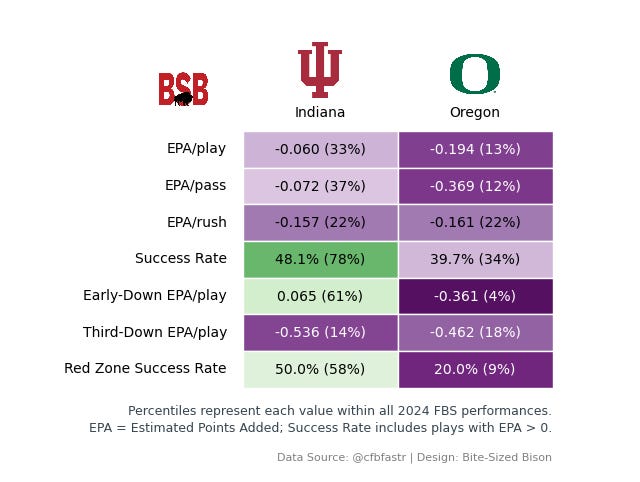
There’s also the potential rematch against Oregon for Indiana, a game in Eugene that ended, 30-20, in favor of Indiana. It looked like this:
If you’re looking for a Group of 5 upset, it’s most likely going to need to come from James Madison against Oregon.
Below are several visualizations Indiana fans might recognize from a season of reading BSB, and while the commentary is mostly written from an Indiana perspective, the charts are still useful for any CFP observer looking to know more about these matchups.
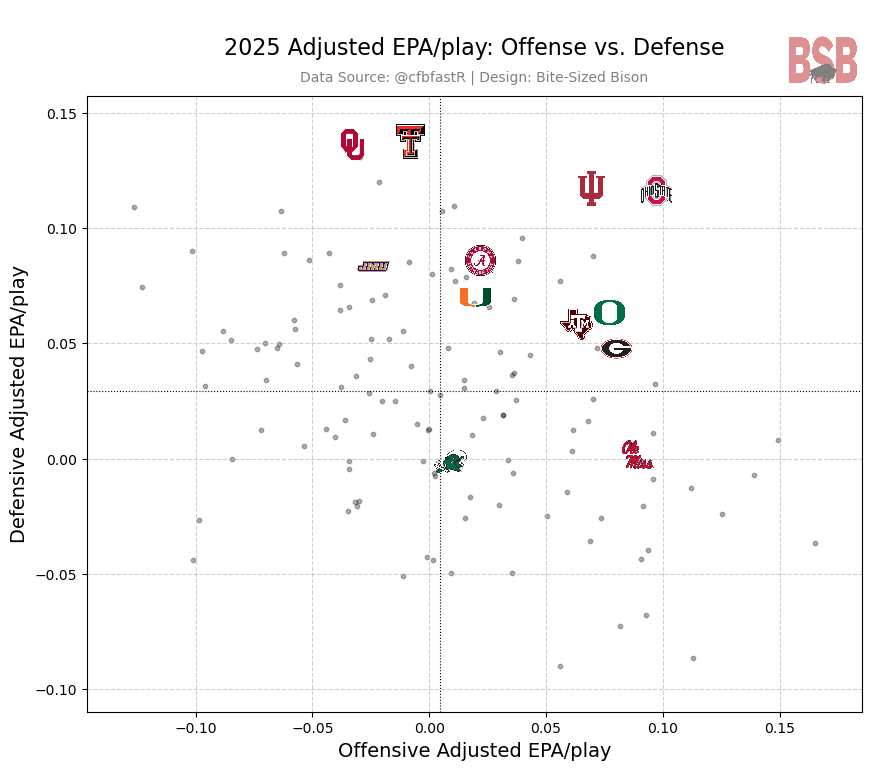
Indiana’s side of the CFP bracket is stacked with defenses; 5 of the top-6 defenses by EPA/play (including Indiana) are on that side, including Oklahoma (2nd) and Alabama (5th). A matchup between Kane Wommack and Mike Shanahan would be interesting, if Bama can get by Oklahoma.
Oregon has a murderer’s row of defenses along its CFP path, while Ole Miss (if it advances past Tulane) faces the two weakest defenses in the field by EPA before the semifinal, while boasting the 2nd-most efficient offense.
If Miami falls to Texas A&M, Ohio State’s offense may have the easiest set of defensive matchups all the way to the championship slot.
Let’s break this EPA look down one step further…
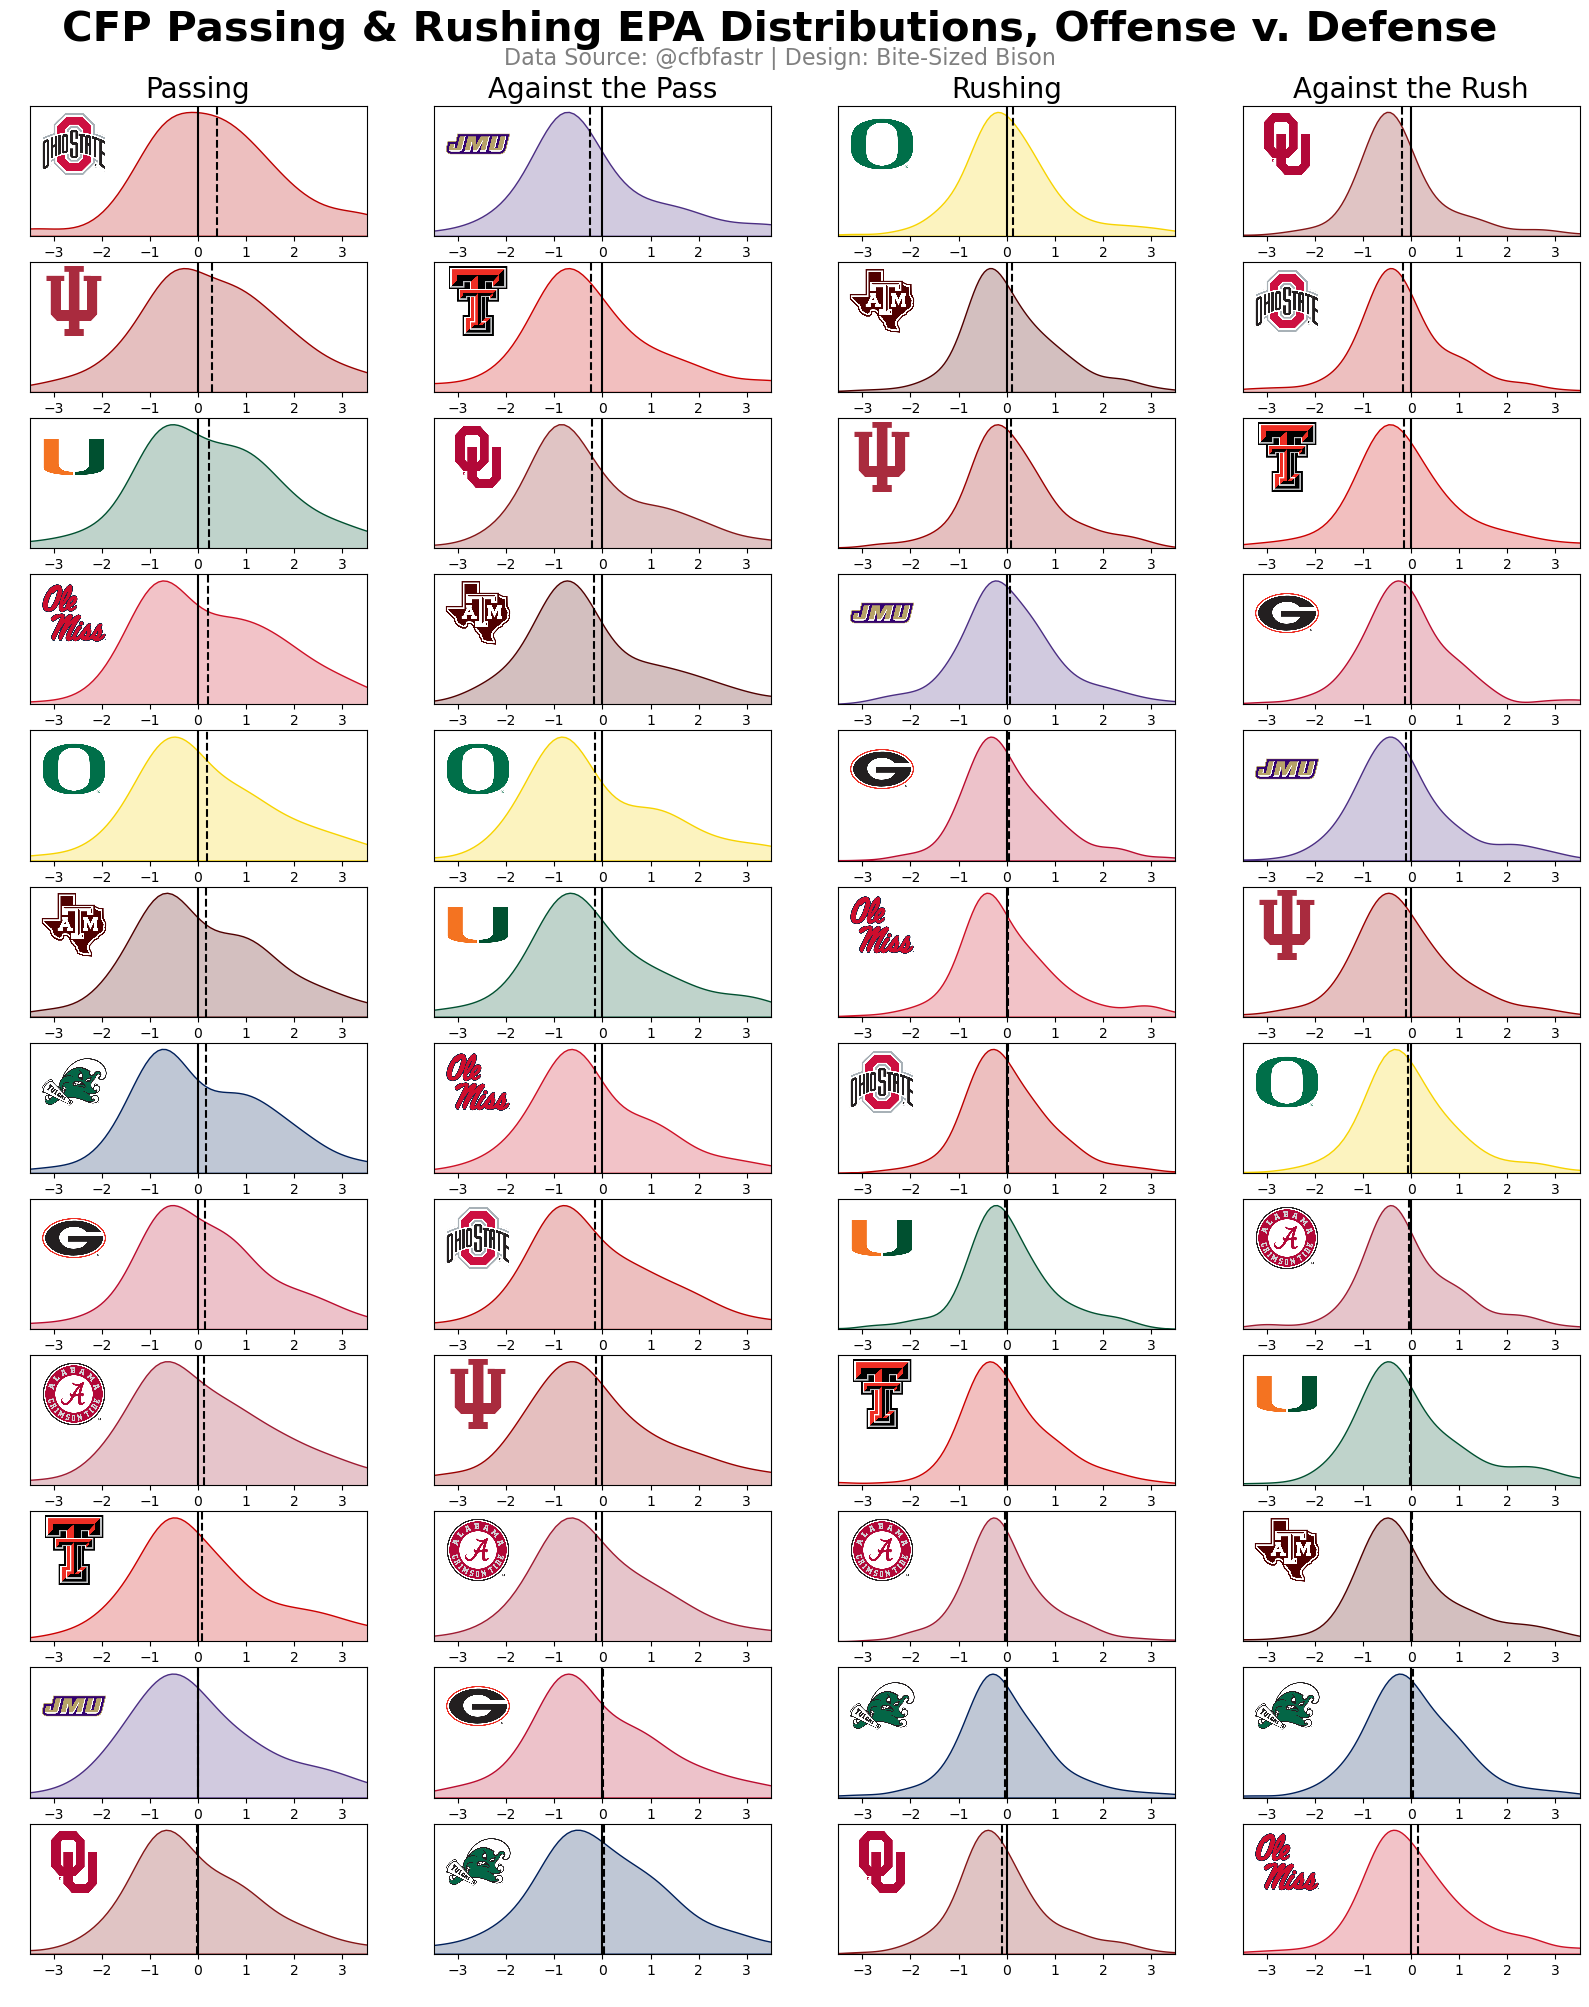
Note: The chart is ordered from top to bottom by EPA/play for each scenario. The curves are the distribution of plays by their EPA values within each scenario. This is also not adjusted for opponent like the previous chart.
While neither Alabama nor Oklahoma has proven to be as good as Indiana, the toughest challenge ahead for the Hoosiers (if it were to happen) is Oklahoma’s rushing defense, which has been even stronger than Ohio State’s this season, by EPA. Indiana ran effectively enough against Ohio State in the Big Ten Championship, but Oklahoma allows the 2nd-fewest yards/carry (2.47) nationally, and Texas Tech (who could get by Oregon for a potential matchup with IU in the semifinal) allows the fewest (2.30). Indiana likes to run the ball to achieve offensive balance, so matchups against Alabama and Oregon would be more favorable there, just with stronger offenses on the other side, though.
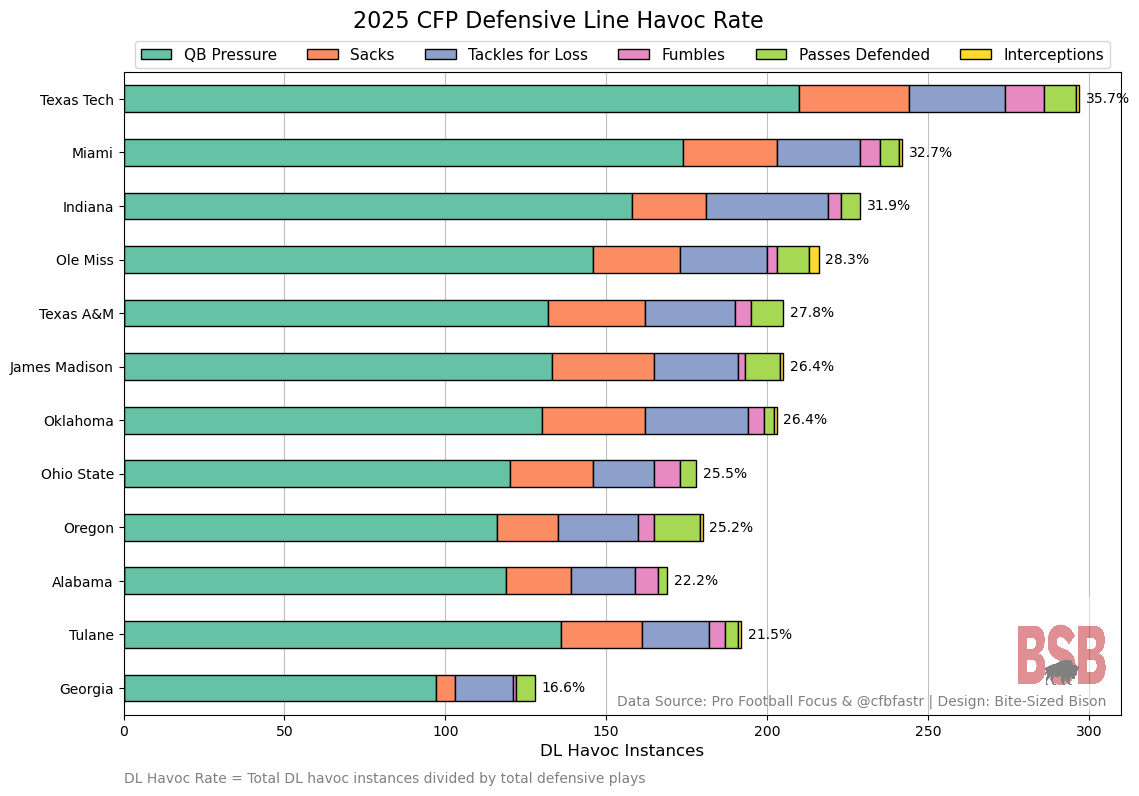
The top-4 defensive fronts by havoc rate are 1. Indiana, 2. Texas Tech, 3. Oklahoma, and 4. Texas A&M. Much of Tech’s (as shown by the graphic above) comes directly from its DL, while quite a bit of Oklahoma’s stems from its LB play.
Indiana fans have come to know Indiana as the dominant DL in the Big Ten, but Miami and Texas Tech have recorded more havoc instances from their DLs than IU. Indiana’s OL would have quite a challenge against that Texas Tech DL. The Hoosiers may be asking themselves whether a second matchup against Oregon is more favorable than lining up across from the Texas Tech defensive front, especially if they need to get through Oklahoma’s defensive front to get there.
Speaking of offensive lines…
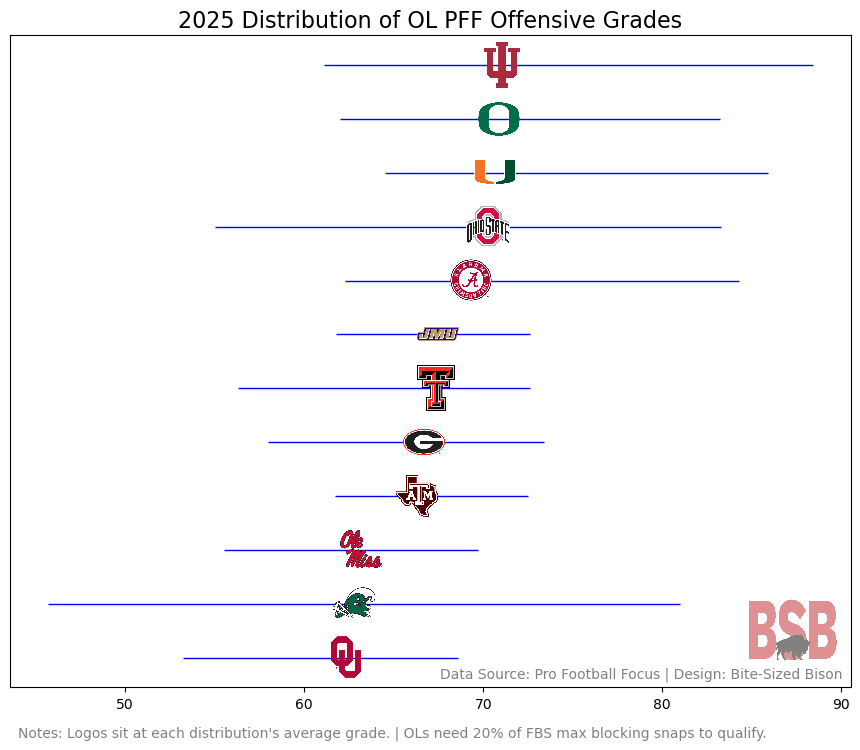
Aside from Indiana’s OL grading the best here, it also slaughtered the Oregon OL earlier this season and sacked Julian Sayin 5 times in the Conference Championship most recently. There isn’t an OL on this chart that Bryant Haines couldn’t scheme havoc against, which should instill some confidence in Indiana fans. It also might have IU fans leaning toward facing some of those weaker defenses with stronger offenses along the Hoosiers’ path.
If Oregon makes it past JMU, that Oregon-Texas Tech matchup in the trenches will be interesting! Take another look at the EPA curves above to see that matchup in more detail.
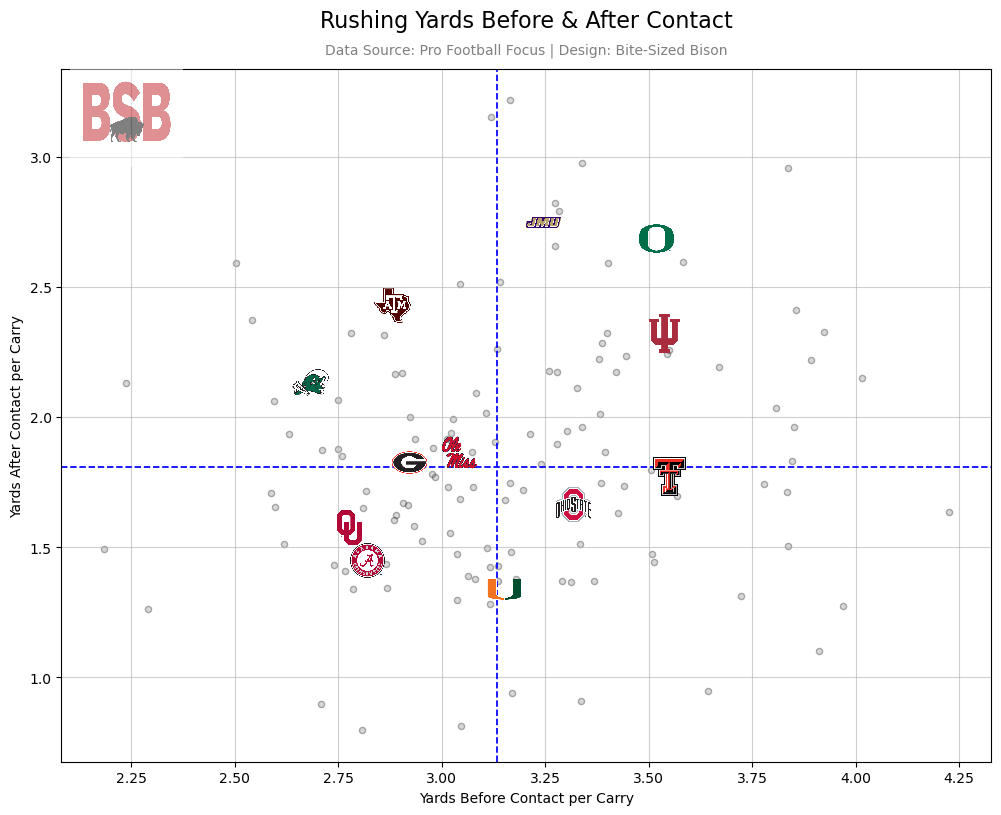
This is the chart that might offer the most optimism for Indiana fans in particular. Oklahoma and Alabama are the two worst running teams in the field. Alabama ranks 117th in rushing yards/game (116.3), and Oklahoma is 105th (123.8).
This phase of the game will be very interesting in both of Oregon’s first two games (if it gets by JMU). Texas Tech and JMU both wreak havoc at the line and are ranked 3rd and 5th, respectively, in EPA/play allowed against the rush, while Oregon (as shown in the chart) is a good running team, ranked 13th in rushing yards/game (218.4) and 5th in yards/carry (5.8).
It’s surprising how many teams are below the FBS median in yards before contact per carry.
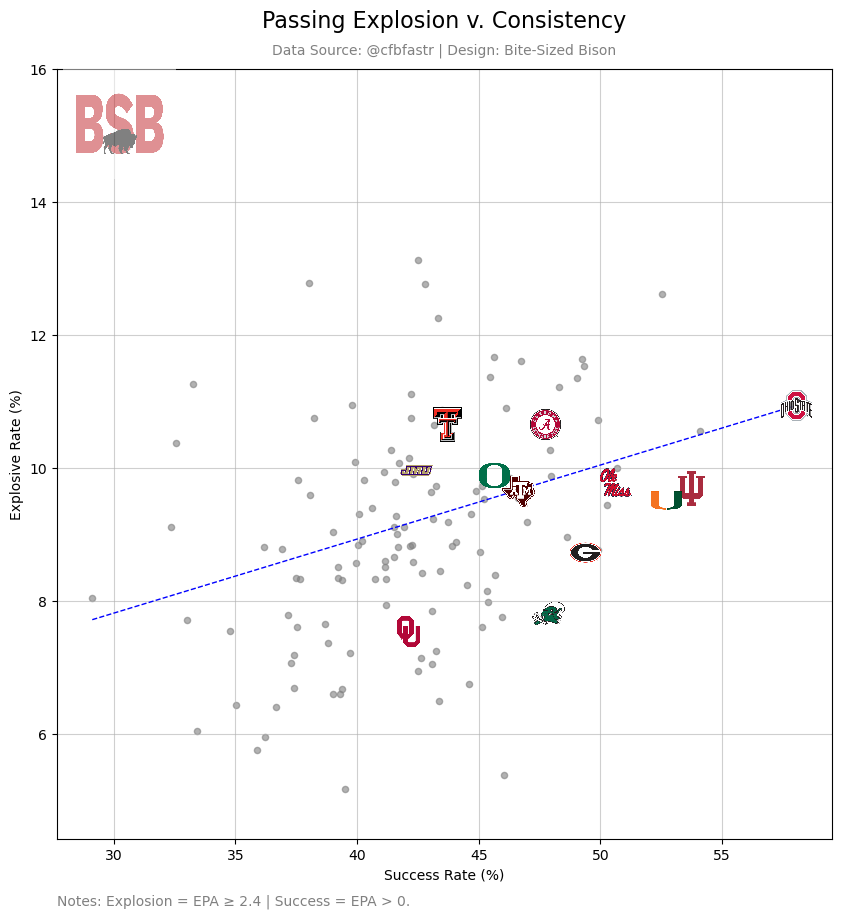
The EPA distributions above showed that the four weakest passing offenses in the CFP field are on Indiana’s side of the bracket, which is good for Indiana’s defensive profile. However, Alabama is the one team of those four that could break from that pattern, which isn’t surprising considering Kalen DeBoer.
Whoever advances to play Ohio State in the quarterfinal — between Texas A&M and Miami — will present an interesting passing matchup against Ohio State.
Let’s take a look at the biggest receiving threats in the field…
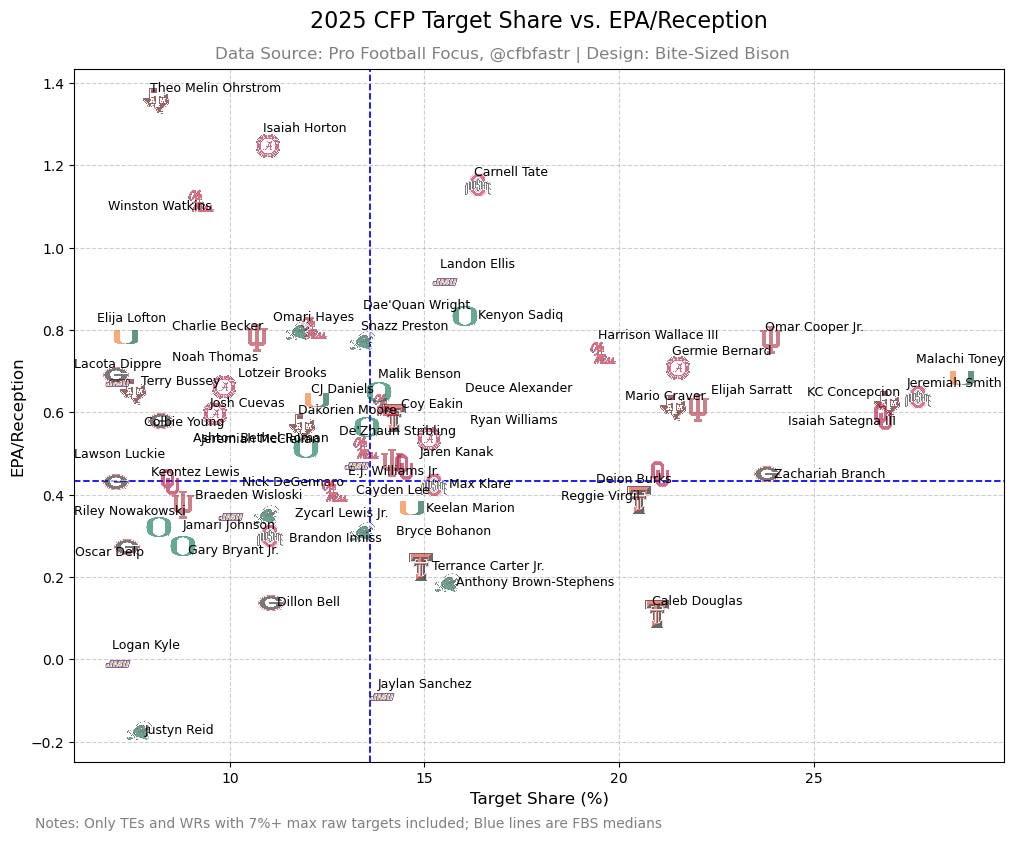
Who would’ve predicted this much space between Jeremiah Smith and Ryan Williams just a year later?
Omar Cooper finds himself in roughly the top-5 receiving threats in the CFP, with Smith, Malachi Toney, KC Concepcion, and Isaiah Sategna. Kenyon Sadiq is also in interesting territory for a TE.
When the field shortens, success rates begin to change:
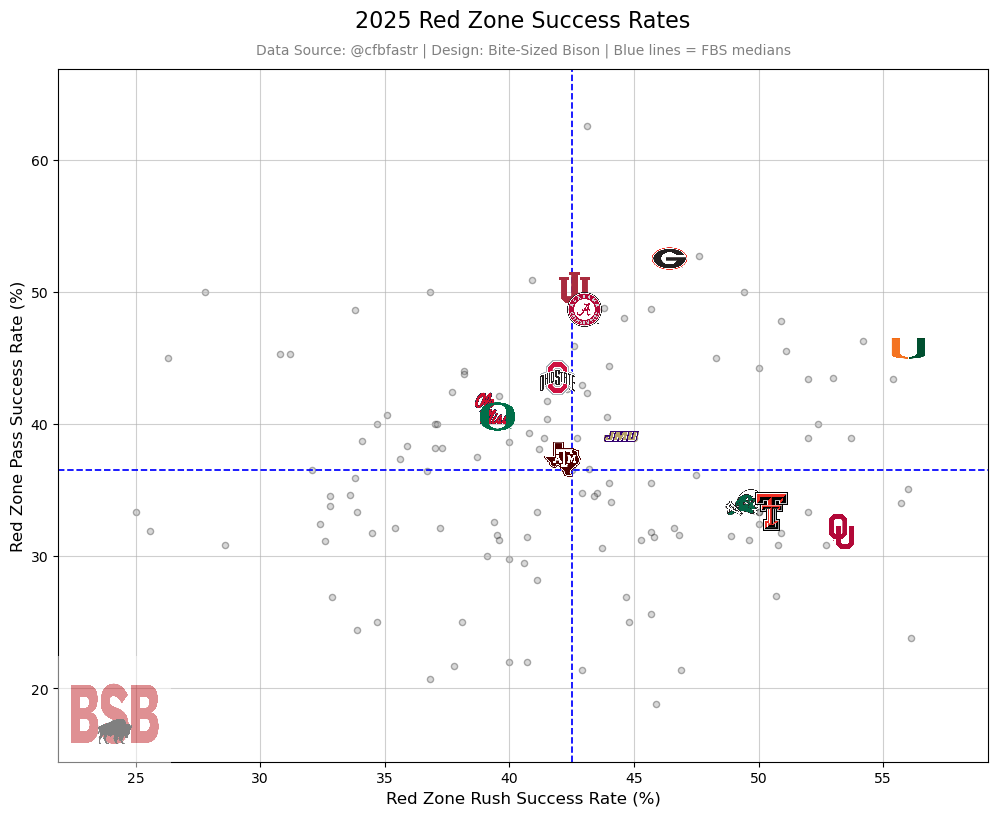
Oklahoma and Texas Tech overperform on the ground in the red zone, while Alabama finds most of its success — as usual — through the air. Georgia and Miami are the two best-performing red zone offenses by success rate (per play), but while Georgia ranks 2nd nationally in red zone TD rate (80.5%), Miami is 20th (71.1%). Indiana (72.3%) and Oklahoma (71.8%) are 15th and 16th, respectively.
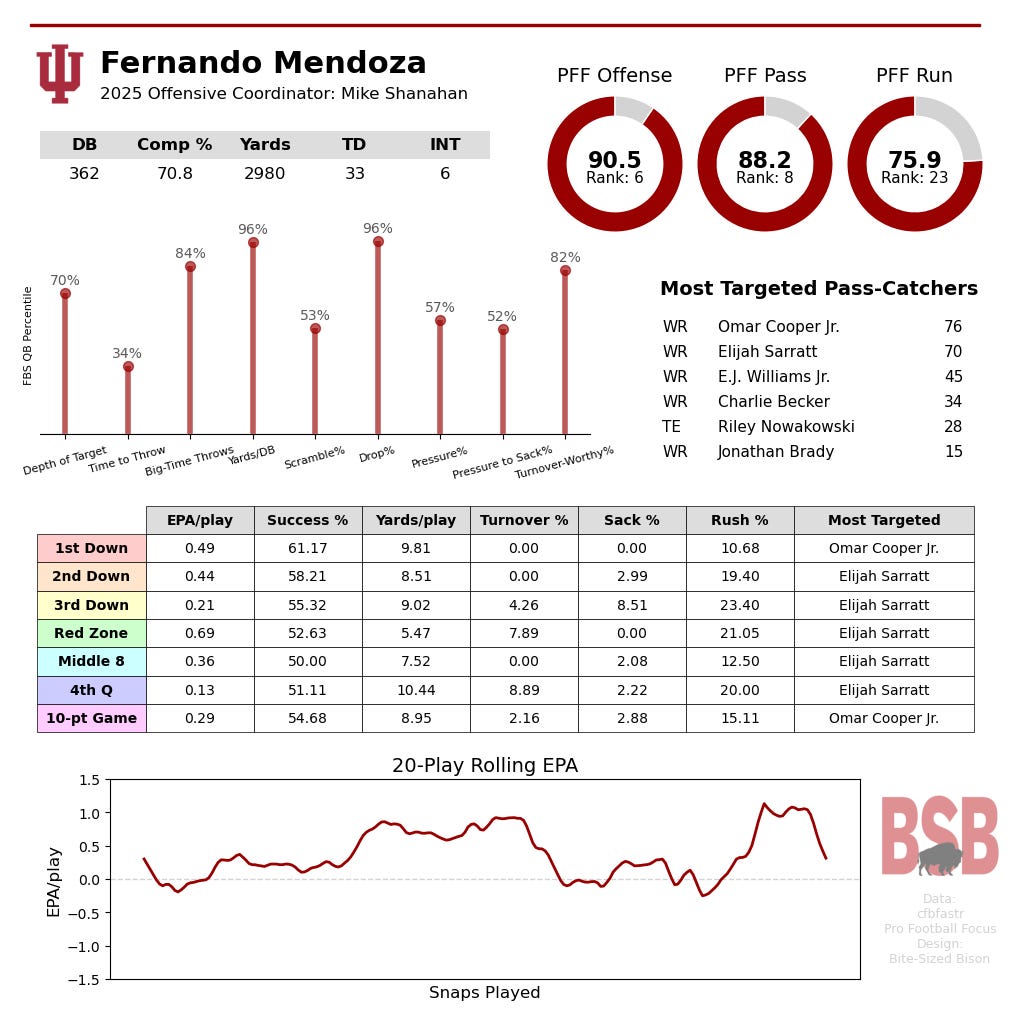
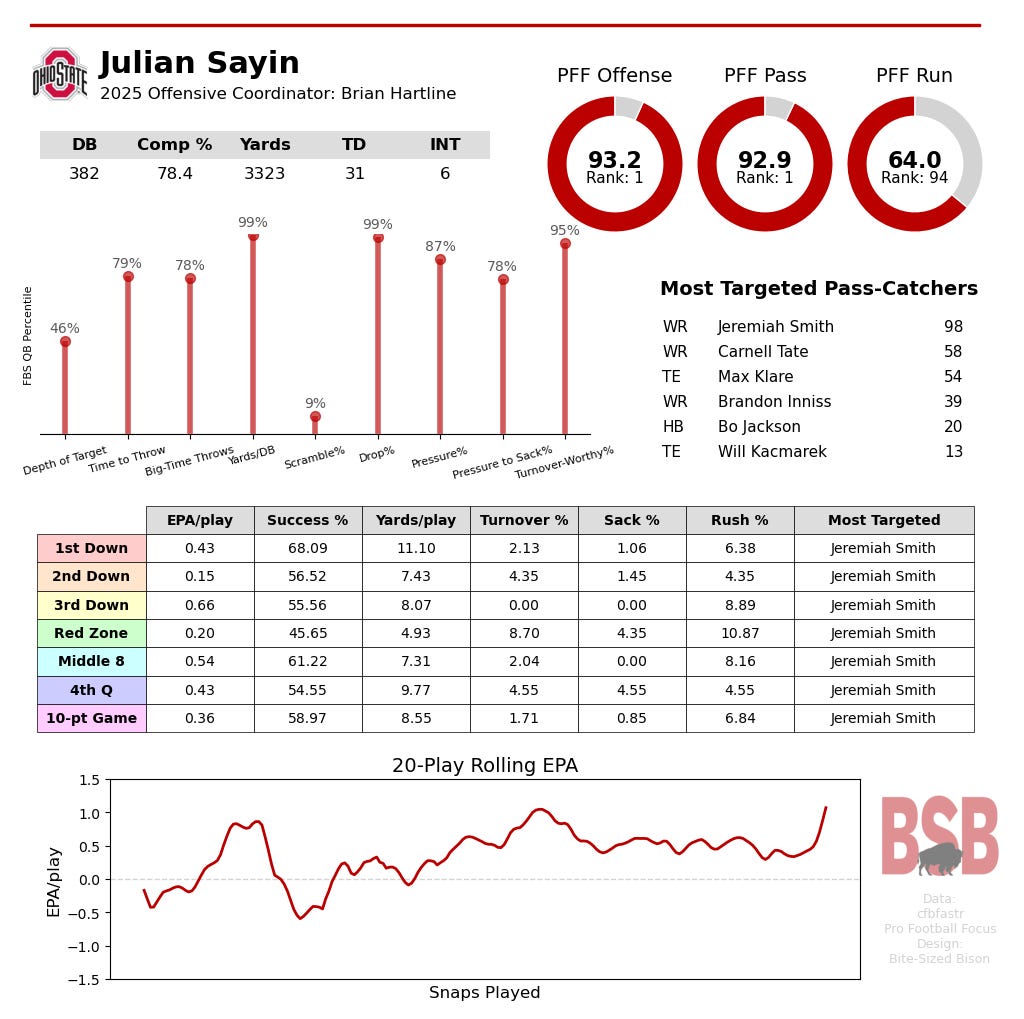
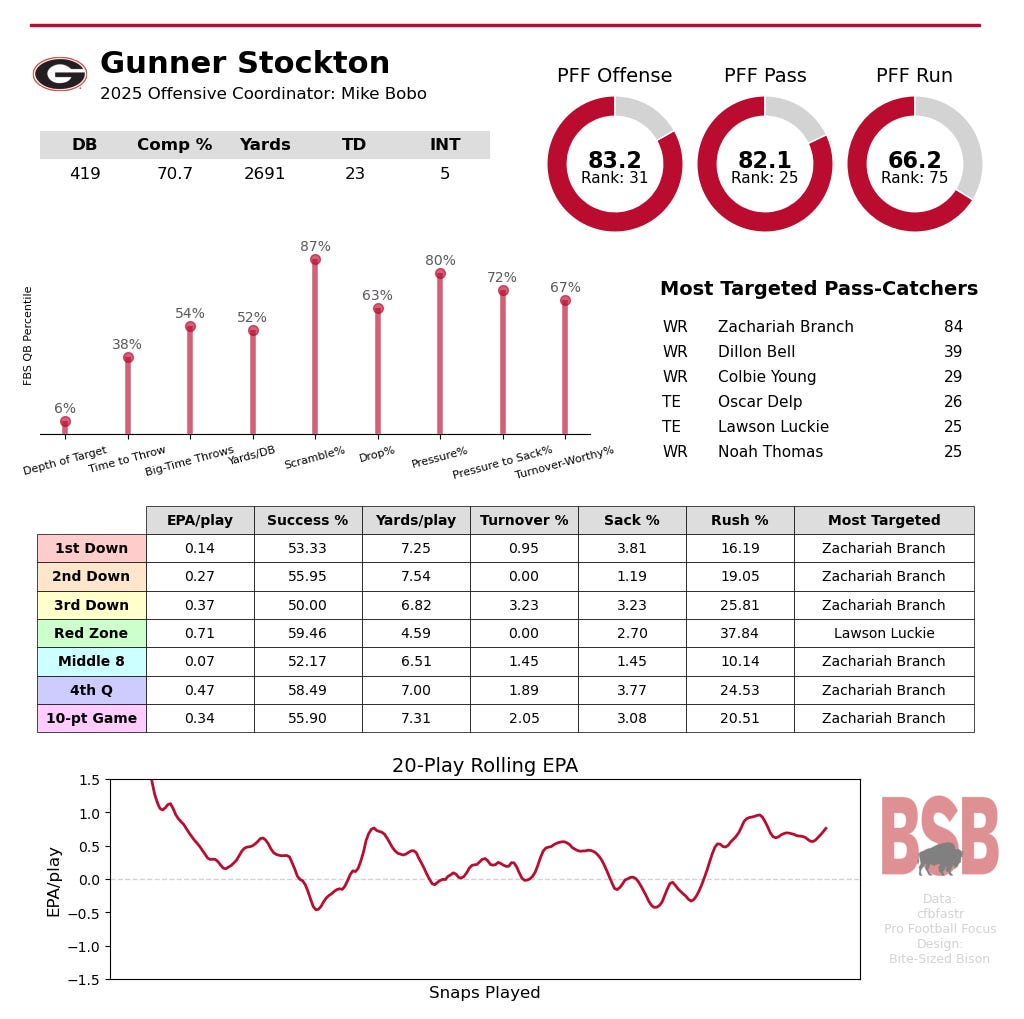
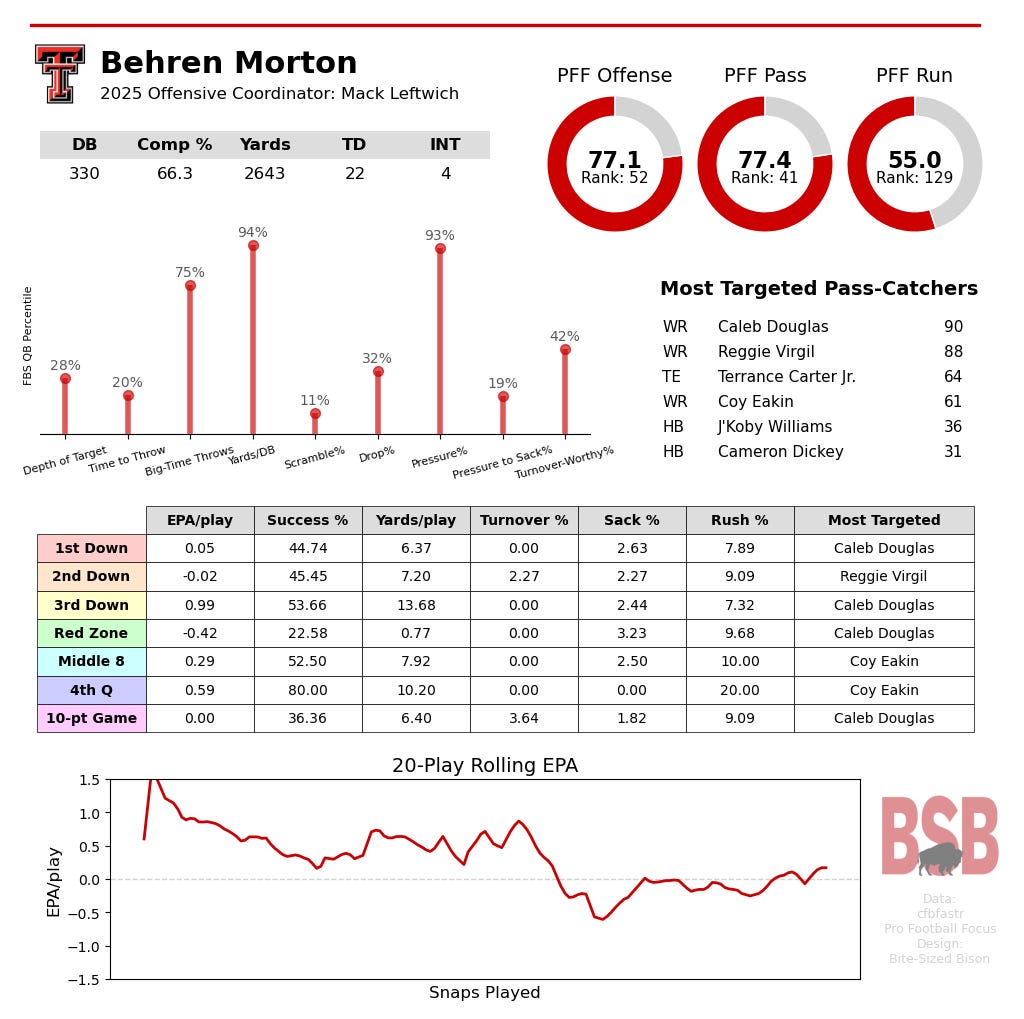
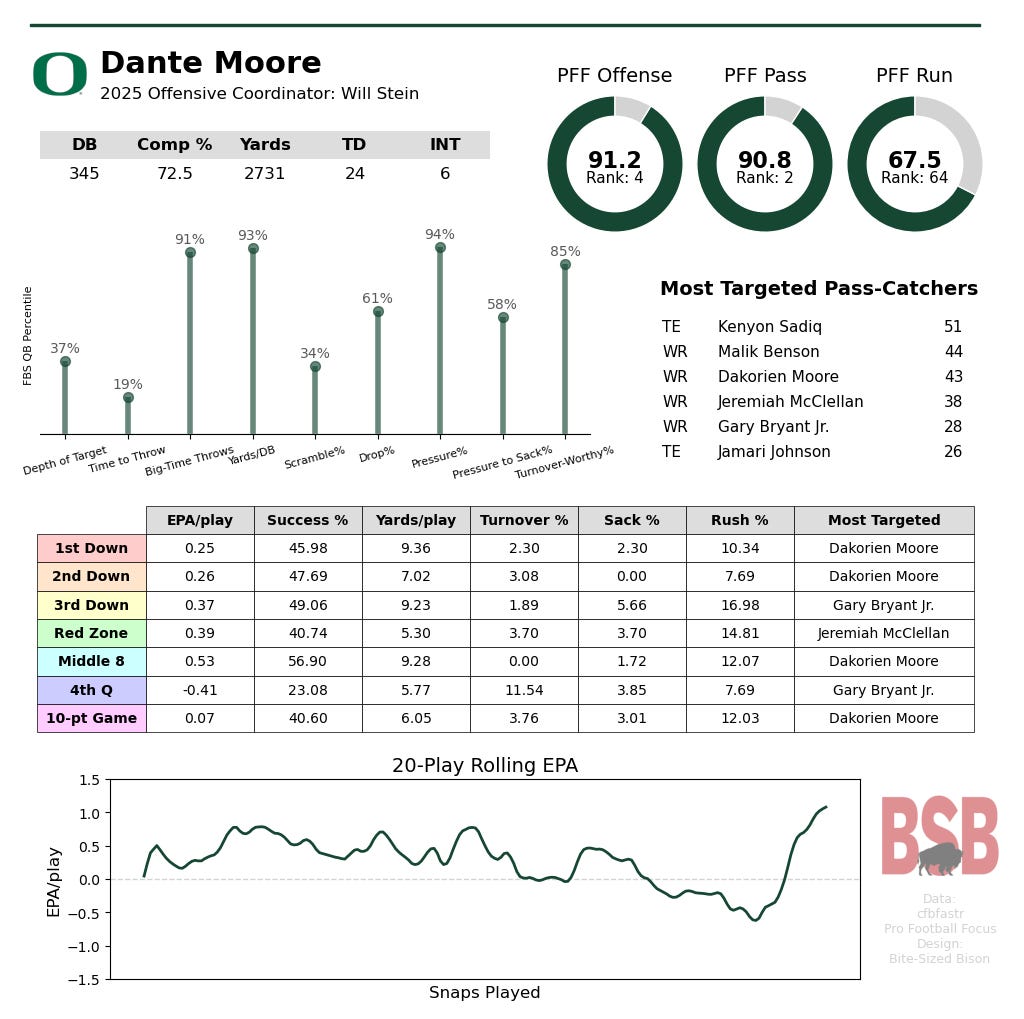
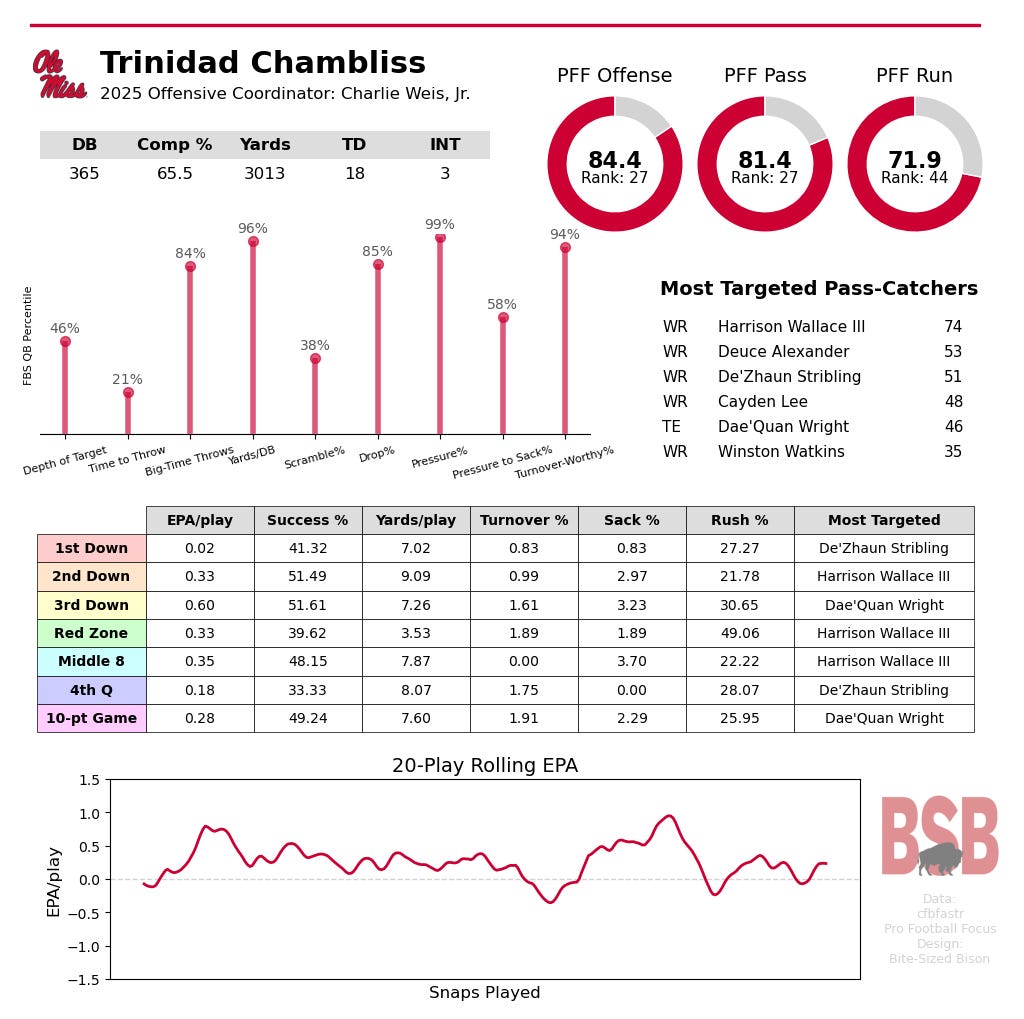
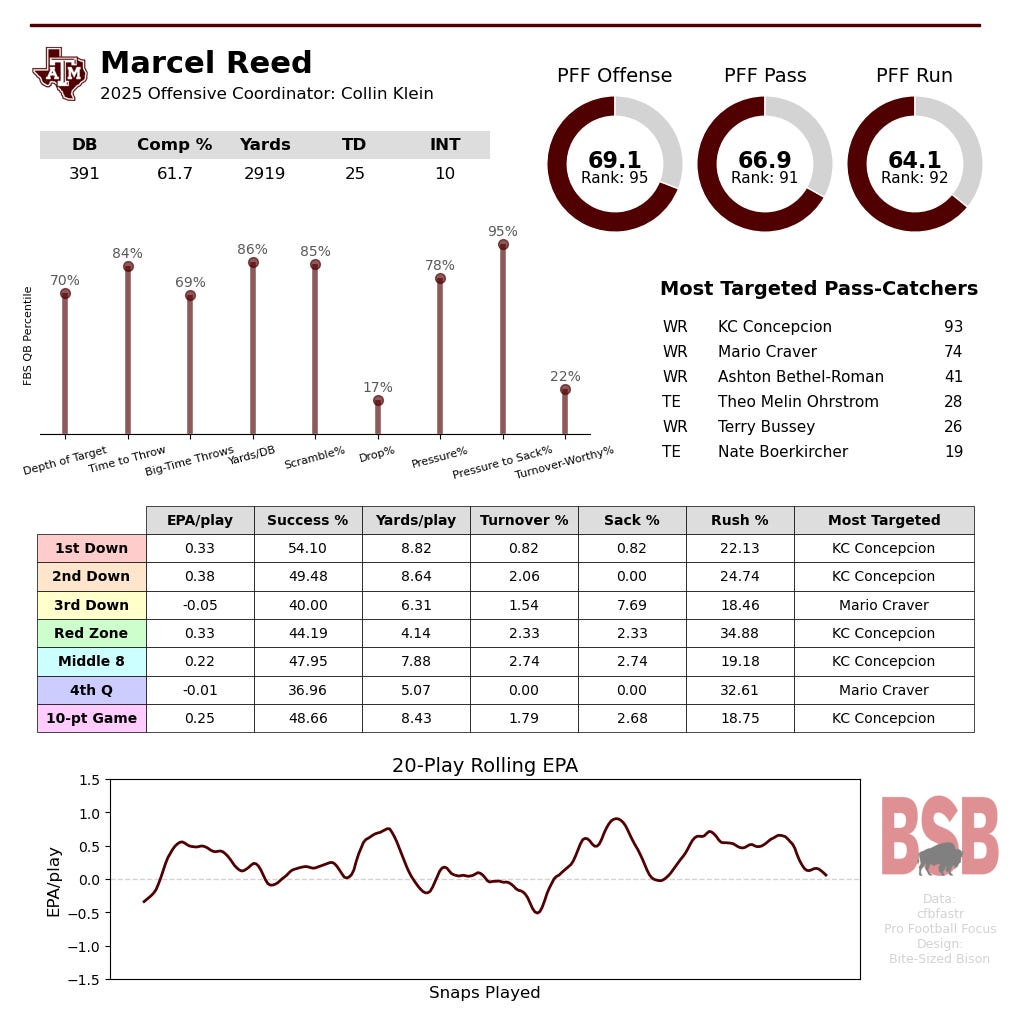
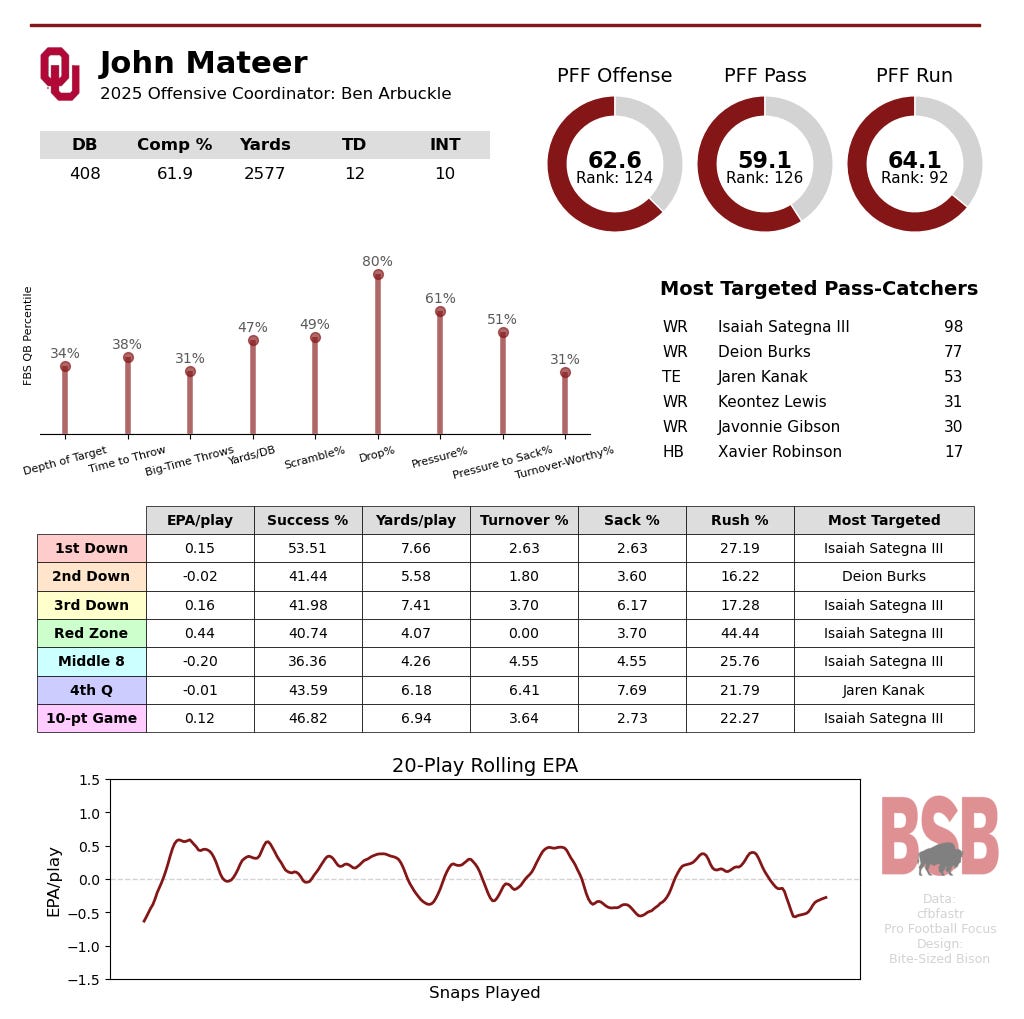
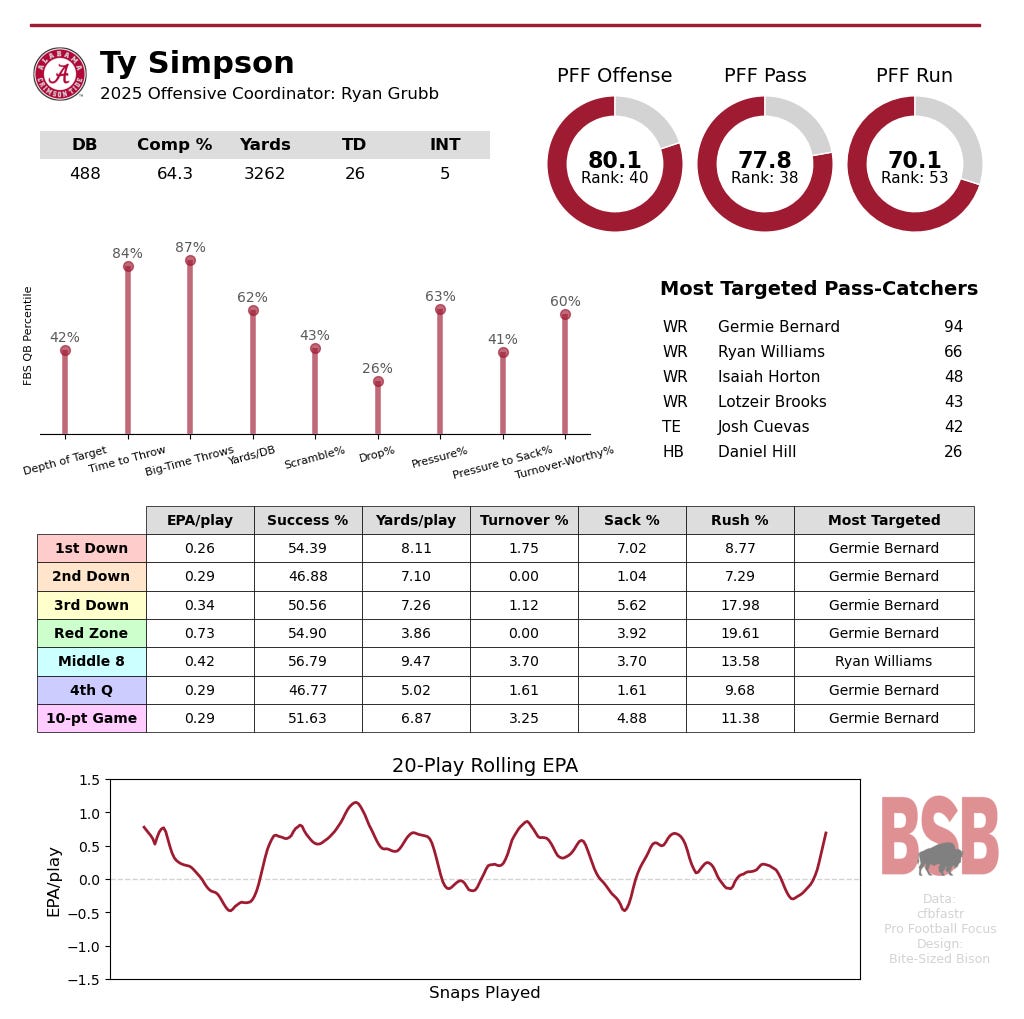
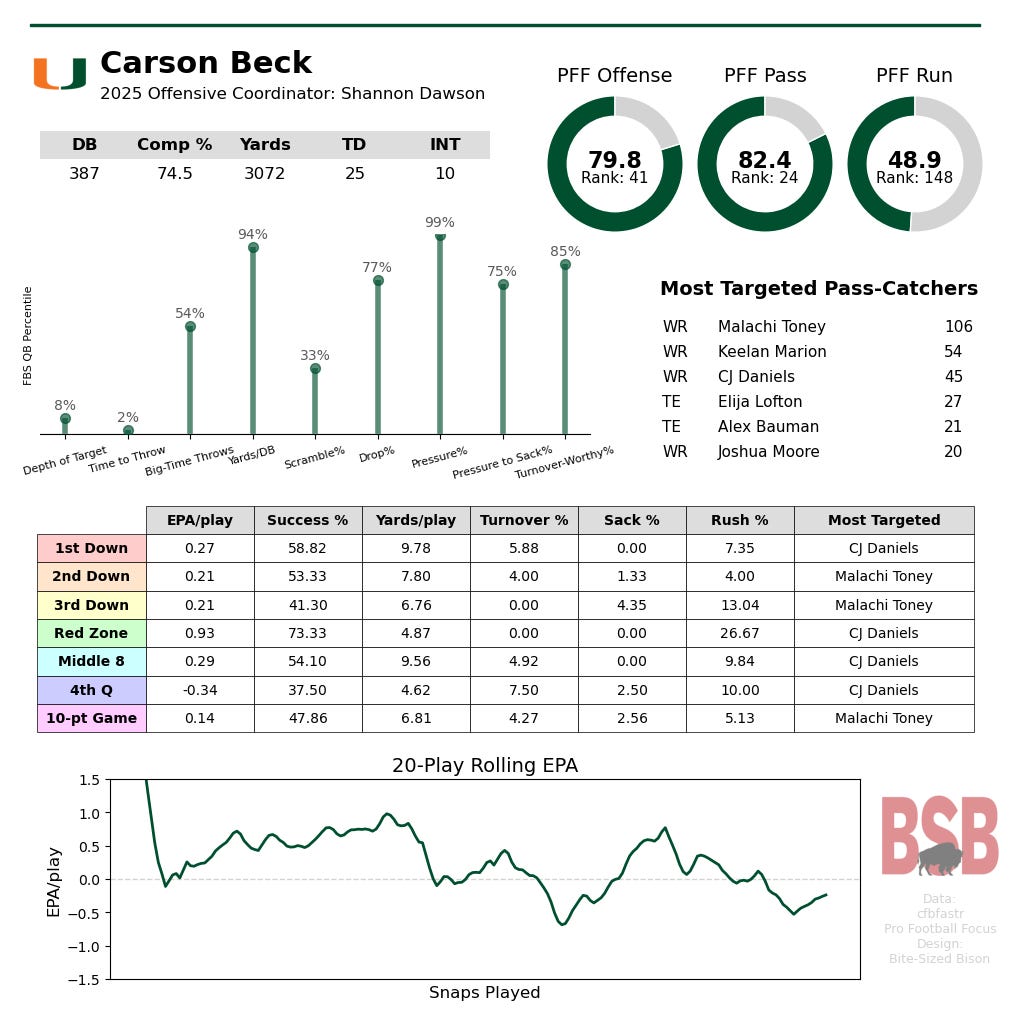
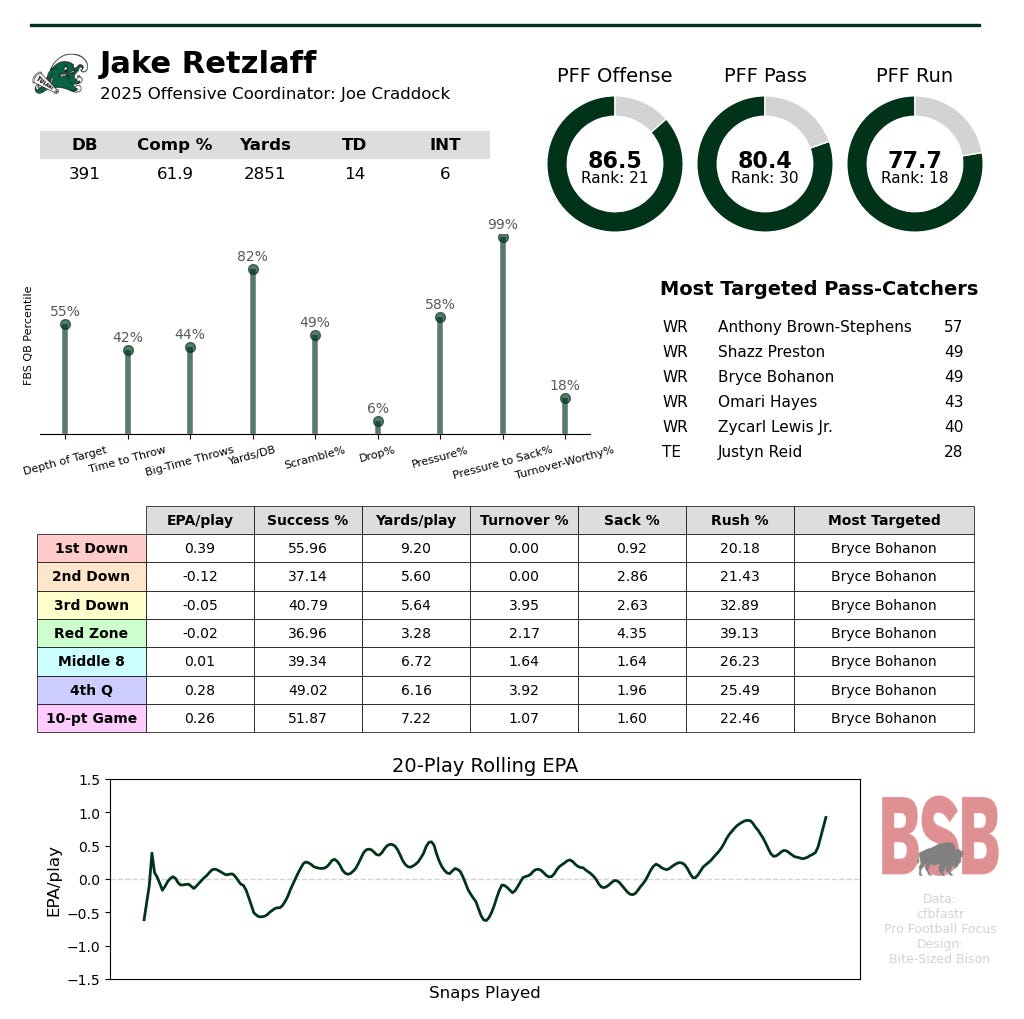
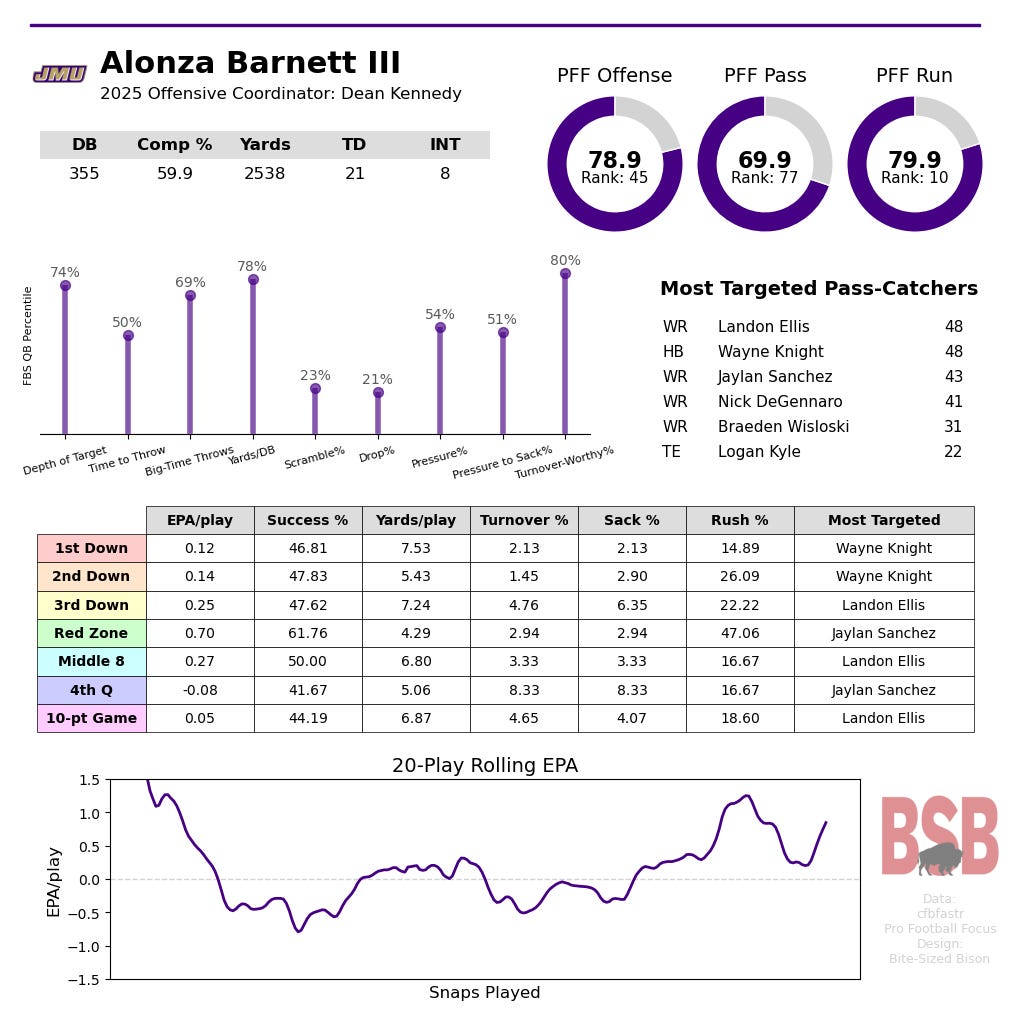
QB Profiles
Comments
Nothing yet. Say the first thing.
Sign in to join the conversation.