
One way I try to gauge the number of real human being readers my newsletter has is by analyzing certain “reader engagement metrics” Substack provides.
(I also continue to think Substack matters - or could matter - because I view the world as a battlefield of competing narratives and Substack, not manipulated, has the potential to slay/debunk false and toxic narratives.)
Specifically, I’m curious to see if my metrics are “in the same ballpark” as my “Covid Contrarian” colleagues. If they are not, I can’t help but ask myself why are my numbers so different (read: much worse) than my peers?
Three newsletters I’ve analyzed closely are the metric numbers produced by my Substack buddies Mark O’Shinskie, Simulation Commander and Jenna McCarthy.
All three of us started our newsletters at approximately the same time and all three of us would probably qualify as “Covid Contrarians” (a term, FWIW, I might have coined.)
When it comes to the metrics of story “likes” and “Reader Comments” all three of my friends blow away my numbers. This despite the fact that, according to Substack-published subscription numbers, I actually have 2,100 more subscribers than Mark and 1,200 more than Simulation Commander.
Jenna, on the other hand, has approximately 2,600 more (published) subscribers than I do (10K to 7. 62K).
***
For today’s analysis, I’m focussing on metrics from Jenna’s newsletter for the simple reason Jenna and I both happened to post stories on the same subjects within 16 hours of one another.
The two subjects I’ve analyzed below were “Stephen A Smith apologizes” and “Fauci pleads the Fifth.”
As this analysis seems to confirm, far more real live human being readers seem to be reading Jenna’s articles compared to my articles.
In fact, I wouldn’t waste a dispatch on this topic except for the fact that these numeric disparities strike me as “statistically significant.”
As all my readers should know by now, when I identify disparities that strike me as “odd” (or are not what I would expect to observe) I often flag or highlight these differences.
The conclusion I’ve reached with numerous “Substack metric” stories is that someone, somehow, is screwing with the reach of my Substack newsletter.
If this is true, this would mean that “someone” is sabotaging my ability to generate revenue from what is, for now, my full-time business.
The reason such a conclusion might be of interest to people besides myself is my conclusion that “if this is happening to me, I’m probably not the only person this is happening to.”
The allegation - which, to be clear, I haven’t proven - would be that some form of sophisticated censorship or shadow-censorship is very possibly occurring at least at some Substack newsletters.
This would be particularly disturbing as, for years, Substack was considered the media oasis that had fought and eschewed Orwellian censorship programs which, as Covid proved, definitely occurred at many other media and social media platforms.
My (disconcerting) conclusion would, thus, have two parts: These reach-suppression operations are now occurring even at Substack.
… And, since I believe these are sophisticated operations, someone highly intelligent and devious must be coordinating these “attacks” (with the likely motive being an effort to suppress or neutralize “threats” to the Powers that Be.)
I should note that several of my readers have opined in my Reader Comments that it wouldn’t necessarily be the founders and employees of Substack who might be engaged in any “reach suppression operations.”
That is, it could be people with access to Internet servers, email programs or any number of tech wizards who might know how to throttle the reach of “threats” with nobody able to conclusively figure out how this goal is being accomplished.
If this is true, I would still think Substack’s tech masters must know this is happening … and haven’t done anything to stop it.
(As to the question of why my newsletter might have been targeted, see this recent article.)
I have also come to believe that any tech or narrative- manipulation savants would easily be able to perform psychological profiles - or “risk assessments” - and identify the people perceived as most likely be able to thwart their planned future agendas or expose their past crimes.
I’m not sure of course, but perhaps with the assistance of AI, key generals within the Censorship Industrial Complex might have also concluded that my personality profile checks many of the boxes of a “significant threat?”
(Number of shares - cross-posts and re-stacks - are another important metric Substack content creators can track.)
With this wild and crazy prologue out of the way, let me now compare my metrics to those of Jenna McCarthy. I leave it up to my readers to see if you might also reach the same conclusions I’ve reached …
As noted, Jenna’s newsletter has approximately 10,000 subscribers and I have 7,627. This means Jenna’s newsletter has 1.38x more subscribers than my newsletter, a ratio readers might keep in mind as you consider the metrics listed below.
“Stephen A. Smith Apologizes” Metric Analysis …
Likes: 424
Reader Comments: 272
Cross-posts/re-stacks: 45
***
Bill Rice, Jr.’s story on Stephen A …
Likes: 62
Reader Comments: 52 (14 by me)
Cross-posts/re-stacks: 4
Discussion/comparison:
Jenna’s story produced 6.8x as many likes as my story.
Jenna’s story produced 5.2X as many Reader Comments as my story
Jenna’s story was shared 11.25x more than my article.
The most popular comment at my site generated 22 “likes” (far more than normal for my Reader Comments section).
The most popular comment after Jenna’s article on the same subject (made by our mutual friend, Laura Kasner) generated 113 “likes” - 5.14x more than my most popular comment.
“Fauci pleads the fifth” comparison/analysis …
Likes: 289
Reader Comments: 243
Cross-posts/re-stacks: 33
Likes: 64
Reader Comments: 63 (15 by me)
Cross-posts/re-stacks: 8
- Jenna’s story produced 4.51x as many likes as my story on the same subject.
- Jenna’s story produced 3.86x as many Reader Comments as my story.
- Jenna’s story was shared 4.13x more than my article.
- The most popular comment at Jenna’s site got 73 “likes.” The most popular comment at my newsletter got 9 “likes.” Jenna’s “most popular” Reader Comment produced 8X more likes than the most popular comment at my newsletter.
***
While I acknowledge that Jenna might be a better and more entertaining writer than myself and probably does have a more loyal subscriber base than I do, I don’t think the disparity in these particular metrics should be this dramatic.
(For an even more-stunning disparity, look at my metrics compared to all the liberal or Status-Quo-defending authors who are setting readership records on Substack these days).
As I’ve written tongue in cheek, I have asked myself if it’s possible I’ve simply lost my Mojo as a Substack author. Perhaps my act, content, writing style, whatever, has grown stale or, like Fonzi and “Happy Days” once did, I’ve jumped the shark.
However, I don’t think this is the case as I recently published a story that produced the same impressive metrics my articles used to routinely produce.
As noted in this story, when Meryl Nass cross-posted one of my stories - and my newsletter tapped into Dr. Nass’s subscriber base - in a couple of days, all my key metrics exploded into the stratosphere.
This morning I did one of my patented metric analysis and can report these eye-opening changes in my metrics, which should illustrate my point.
Metric Analysis - “What I think really happened with Covid”
Increases generated by this one story …
Page views: This key metric more than doubled (from an average of approximately 3,500 to 7,555).
New Subscribers: Increase of more than 100-fold (from average of losing three to five subscribers with every new story to netting 116 new subscribers (Note: in a period of one week).
“Likes:” Increase of approximately 4.5-fold - from a recent average of approximately 55 “likes” to 261 “likes.”
Reader Comments: Increase of at approximately 4-fold - from an average of approximately 15 unique posters (per story) to 62 “unique” readers who made a post in my Reader Comments after reading this story. (Total reader comments were 149).
Most popular reader comment: My first comment was the “most popular,” generating 39 “likes,” which is at least five times more than the most popular comment at most of my stories in the past six months.
Significantly, almost all of this impressive growth happened after Dr. Nass cross-posted my article.
For example, only eight people (not counting myself) had made a reader comment in the first 24 hours after I posted this story. (Dr. Nass cross-posted my story about 28 hours after I had hit the send button. For some curious reason, she said she had a hard time figuring out how to find and then cross-post my article.)
In the three days after she cross-posted my article, 44 more people made comments and the number of my “likes” went from 62 to 261 (+ 199).
So what’s my main take-away?
When people who are not currently subscribers do get my articles, they still like my stuff (literally). Apparently, I haven’t lost my Mojo.
But, just as I suspected would be the case, my spike in good fortune was short lived. When Dr. Nass doesn’t cross-post my article, my numbers revert right back to a non-impressive and depressing norm.
In the last two weeks, my new stories net me from zero to 2 new subscribers and every story produces a new Substack phenomena (at least for myself) - the instantly “disabled email” (a figure that ranges from five to 19 per new article).
Also, my all-important “Page View” metric is dipping even below 3,500 (when six months ago, I averaged at least 4,500 Page Views per article).
For example, in the last 27 hours since I published my “Conclusions” article, I’ve generated only 3,031 Page Views (and 31 of those page views were me “checking my metrics.”)
Above, readers witnessed me dance a little two step, celebrating the 149 Reader Comments my “What I think really happened in Covid” story generated.
Well, yesterday’s story (so far) has generated a grand total of 29 Reader Comments (six by me), which were made by just 18 of my 7,627 “subscribers.” (My follow-up story to “What I really think about Covid” produced 28 Reader Comments, 15 of these by me and my sweet wife.)
About those Page View Numbers we authors get …
As a final point, I want to alert my Substack colleagues that the Page View numbers we all receive should be viewed as highly-dubious (IMO).
For example, according to Substack metrics, the story that Dr. Nass cross-posted supposedly produced “7,555 Page Views.”
However, this can’t be right as Dr. Nass told me in an email that, according to her metrics, 19,000 of her readers opened my article after she cross-posted it. If 19,000 of her readers opened it and 2,200 of my subscribers opened this article, that’s at least 21,200 total readers.
Substack’s dashboard also features a box that tells content providers where their “traffic” for a given article came from.
With this article, Substack tells me that 1 percent of readers of my “What I think really happened in Covid” article came from Dr. Nass’s Substack. Well, one percent of 7,555 total readers would be just 76 “bonus” or extra readers (not 19,000).
Substack also tells writers how many new subscribers each article produced. With this article - thanks to the Dr. Nass boost - I produced 45 total new subscribers (including three “paid”), per this data field.
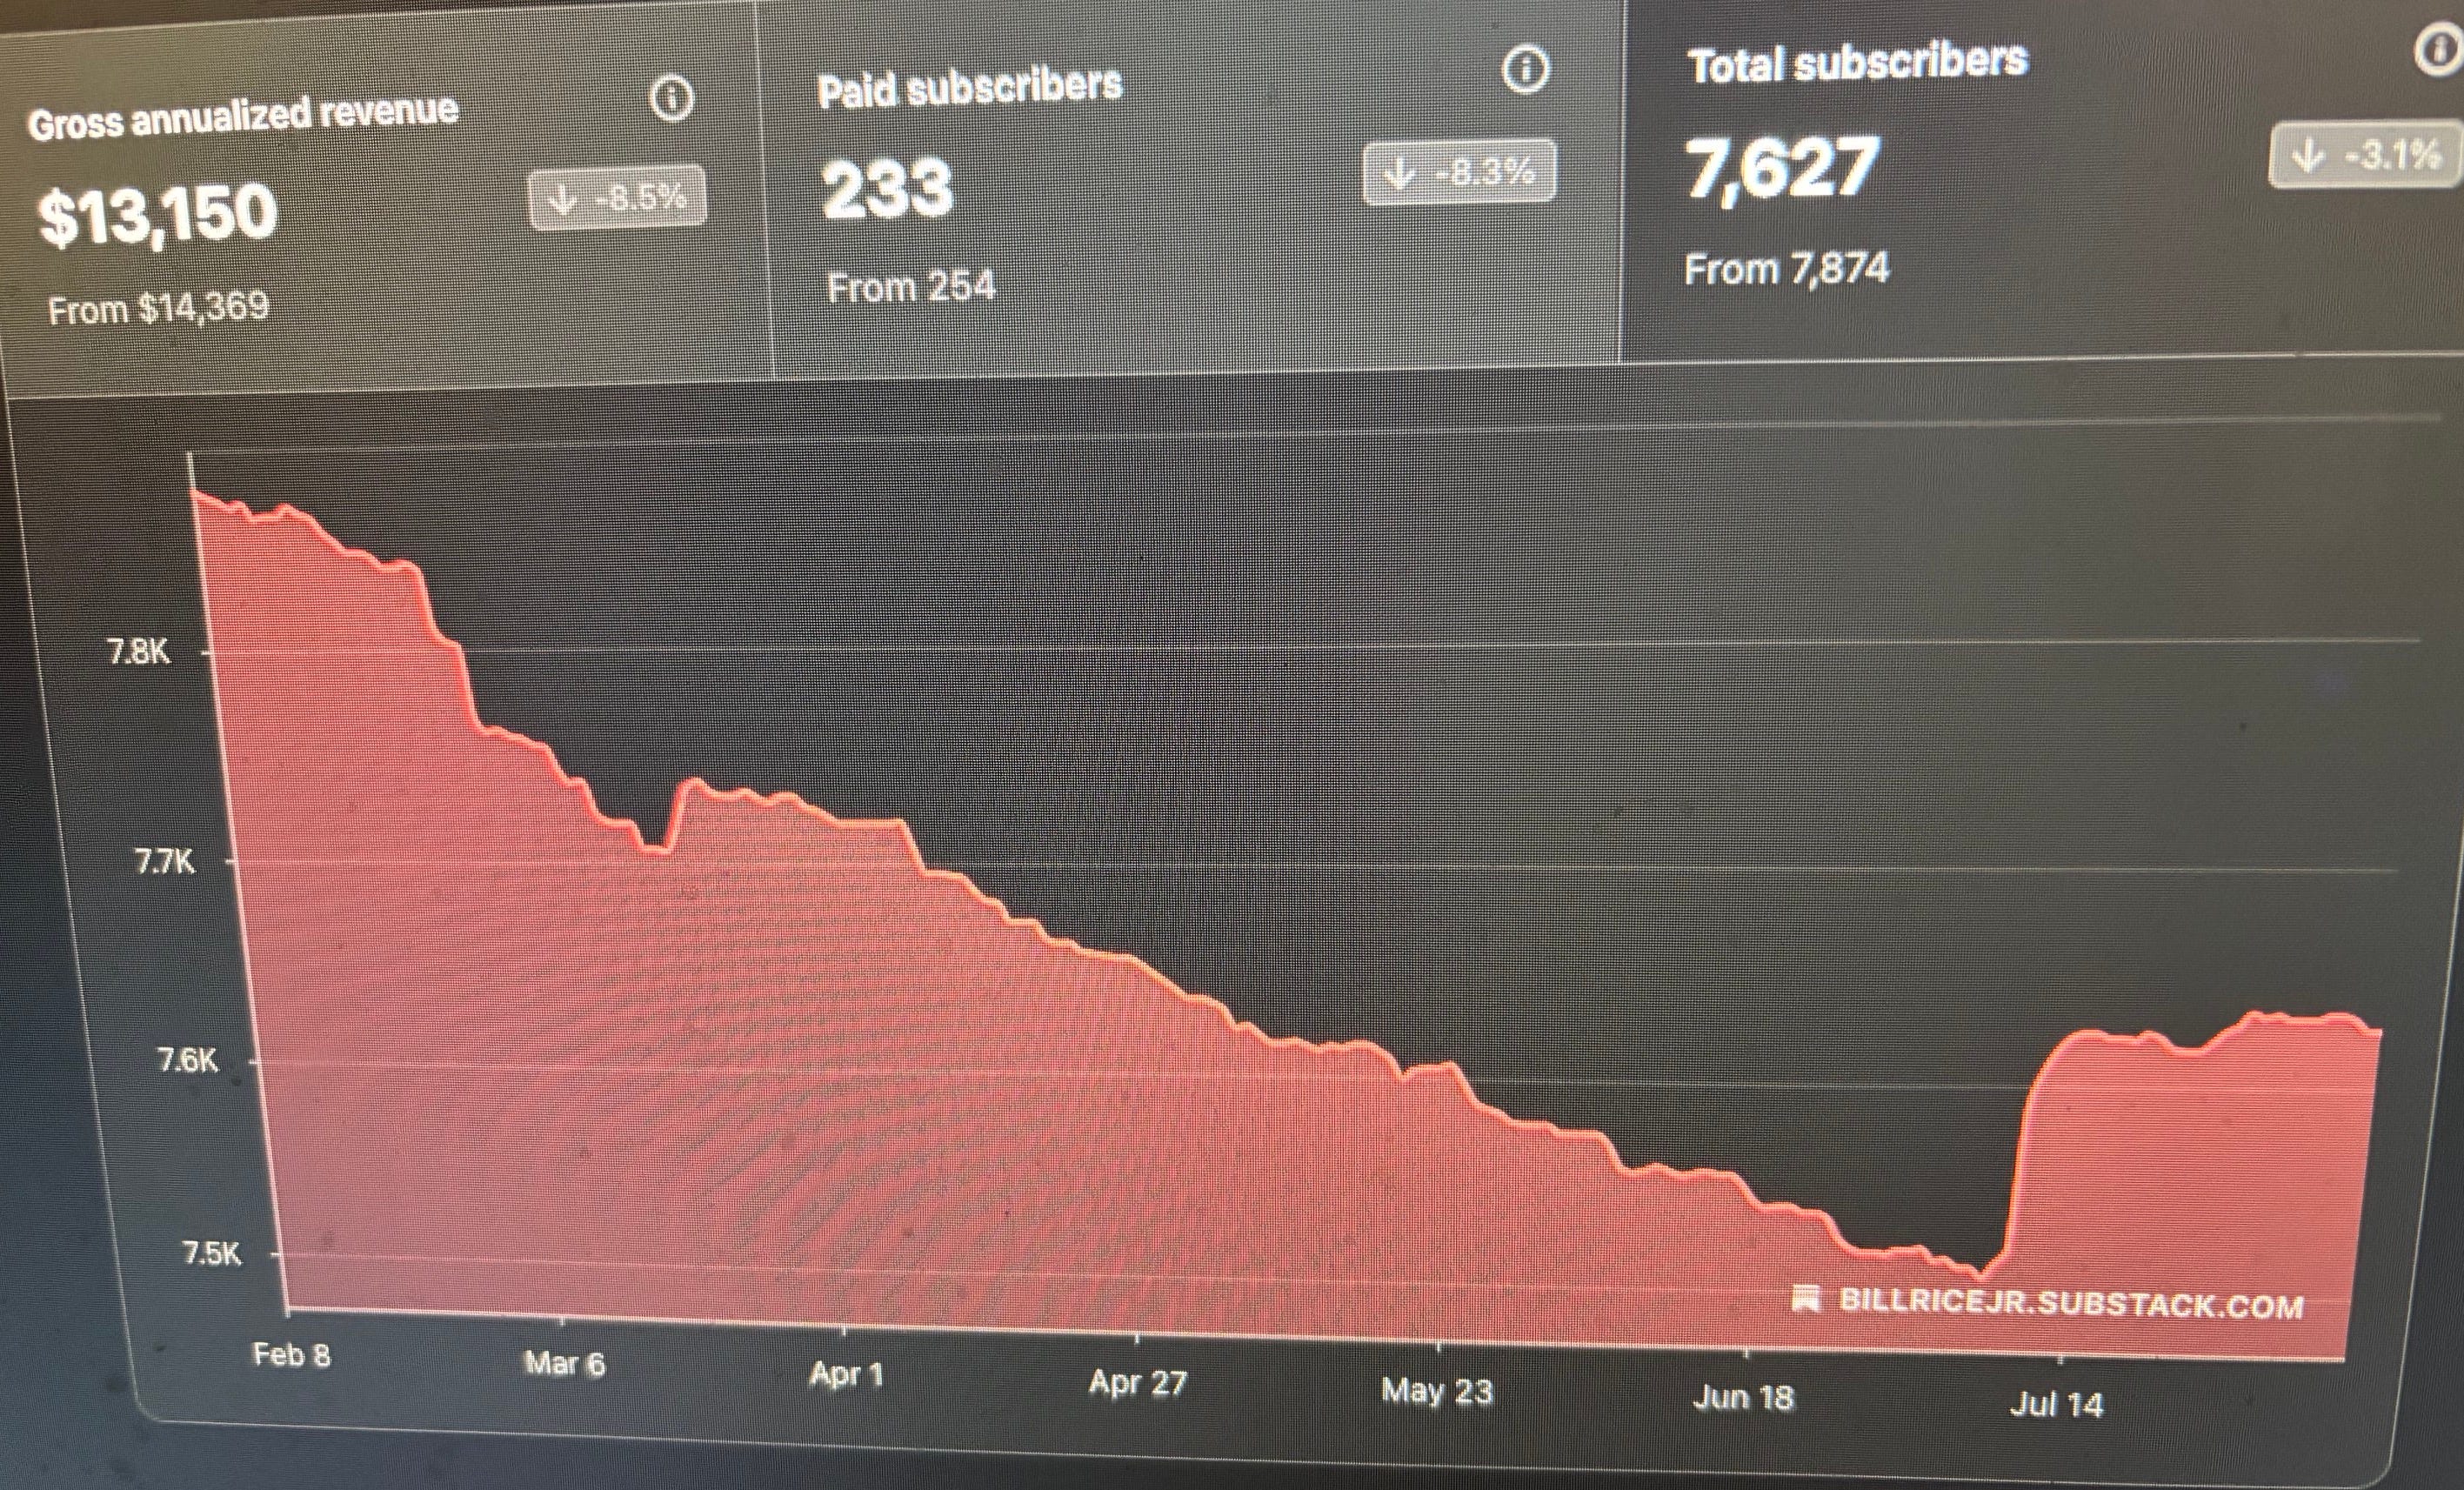
However, per the above-shown metric graph, I added 116 new subscribers in the seven days after Dr. Nass cross-posted my article.
Before I published this article, I had 7,509 subscribers. Seven days later I had 7,625 (a difference of 116 net subscribers).
Since no other story produced more than one new subscriber, my conclusion is that all, or almost all, of this huge spike of new subscribers came courtesy of this Good Doctor’s subscribers.
Other anecdotes that make me think I haven’t lost my Mojo …
While my latest article produced only 3,000 readers and only 18 of my 7,627 subscribers (0.23 percent) made a comment, the comments I did receive were flattering enough to turn my face crimson.
For my file “Maybe I haven’t lost my Mojo after all,” I copied and pasted these seven comments:
“Double thumbs up to this one.”
“Great statements and conclusions.”
“Great! Bill, will save this for posterity.”
“This is thoroughly excellent, Bill.” (Thank you, Mark O’Shinskie!)
“Incredible post, Bill, asking all the right questions …”
“Great post! …”
“God bless you, good Sir. Wishing you continued success in your good endeavors here.”
I will say I have very smart readers, readers who also read many other Substack newsletters and are probably typical for any Covid Contrarian author.
Based on very kind “reviews” like these, I can’t help but conclude that if more readers on Substack saw my last article, this article would have produced far more than 3,000 readers (which might be the lowest figure I’ve generated in three years) and far more than only 18 readers would have made a Reader Comment. (This story did generate an atypical 74 “likes,” which is curious given the Page View numbers were among the lowest I’ve recorded in years.)
Again, I can’t help but conclude that someone, somehow, is suppressing the reach of my Substack newsletter.
Which I can only conclude must mean I’m firing Hellfire posts at targets that must rate high on the PTB’s Vulnerability Scale - which is the one take-away that makes me feel good about the work I am doing on Substack.
***
(Yesterday’s article - which produced one of my lowest Page View metrics in years - did generate two new monthly paid subscribers, which are greatly appreciated. I also appreciate the reader gratuities I regularly receive from a handful of incredibly generous readers).
Bill Rice Jr.'s Newsletter is a reader-supported publication. To receive new posts and support my work, consider becoming a free or paid subscriber.
Comments
Nothing yet. Say the first thing.
Sign in to join the conversation.