
🎧 Beyond the Pass — Operator Podcast (1:51)
Stop your bar subsidizing your kitchen
0:00
-1:51
Prefer reading? The full breakdown is below.
A 78-cover gastropub in the Cotswolds came to me with a problem they couldn’t name.
Food sales: £9,400/week.
Food cost: 31%.
Kitchen labour: 28%.
On paper, the kitchen was running at a 41% gross margin. The owner’s accountant told him the kitchen was “doing fine.”
It wasn’t. The site was losing roughly £1,800 a month on food, and the bar was quietly subsidising it.
This is the most common situation I see in UK pubs. The numbers look defensible, sometimes even good, and yet the kitchen is structurally negative. The reason isn’t the food cost. It’s how pub economics distort the metrics most operators rely on.
In most pubs, kitchen and front-of-house labour are tracked as a combined figure. Or worse, allocated against total revenue (food plus wet) rather than food alone.
That single accounting choice masks a £40k to £70k problem.
If your kitchen runs five staff at 40 hours each, that’s 200 hours a week. If those hours support £9,400 of food sales, you’re producing £47 per kitchen hour.
Anything under £80/hour in a UK gastropub is structurally fragile. Most pub kitchens I audit run between £38 and £62 per kitchen hour, and the operator has no idea, because the labour line on the P&L is averaged across both sides of the business.
The bar covers it. Until it doesn’t.
Pub menus are prep-heavy by design. Sunday roasts. Pies. Slow-braised shoulder. Beer-battered fish. All of it sounds like “pub food,” and all of it requires hours of pre-service work that never appears in any costing sheet.
When I audit a pub kitchen, I separate service hours from prep hours. A typical pub kitchen spends 35% to 45% of its total labour on prep, for a menu that often has 22+ items.
That prep is real money. But because most pubs cost dishes on ingredients alone, it never gets attributed to the dishes that consume it.
The roast that takes 14 minutes of plate-up plus 3.5 hours of prep across the week looks like a 28% food cost dish. Properly loaded, it’s closer to 47%.
That’s not a margin. That’s a leak with a gravy boat.
Wet sales and food sales both carry 20% VAT, but the way operators read their own numbers tends to flatten that out. A £14 pub main looks like £14 of revenue. It isn’t. It’s £11.67 ex-VAT.
On a 78-cover gastropub doing £9,400/week in food, the difference between gross and ex-VAT thinking is roughly £1,560/week, or £81,000/year.
Most operators run their food cost percentage against the gross figure, which makes everything look 4 to 5 points healthier than it actually is.
A “31% food cost” gross is a 37% food cost ex-VAT. Combined with prep-loaded labour, the dish is now negative before the customer has paid.
The instinct, when an operator finally sees this, is to cut something. Drop a dish. Lose a chef. Reduce hours.
It almost never works.
Cutting labour in a prep-heavy menu makes the prep window collapse, which destroys service quality, which loses covers, which makes the labour ratio worse. I’ve watched operators chase this loop for two years.
The only fix is structural:
Rebuild the menu around prep efficiency
Separate kitchen labour from FOH on the P&L
Cost dishes ex-VAT and prep-loaded
Benchmark revenue per kitchen hour weekly
None of that requires more staff or higher prices. It requires seeing the numbers correctly for the first time.
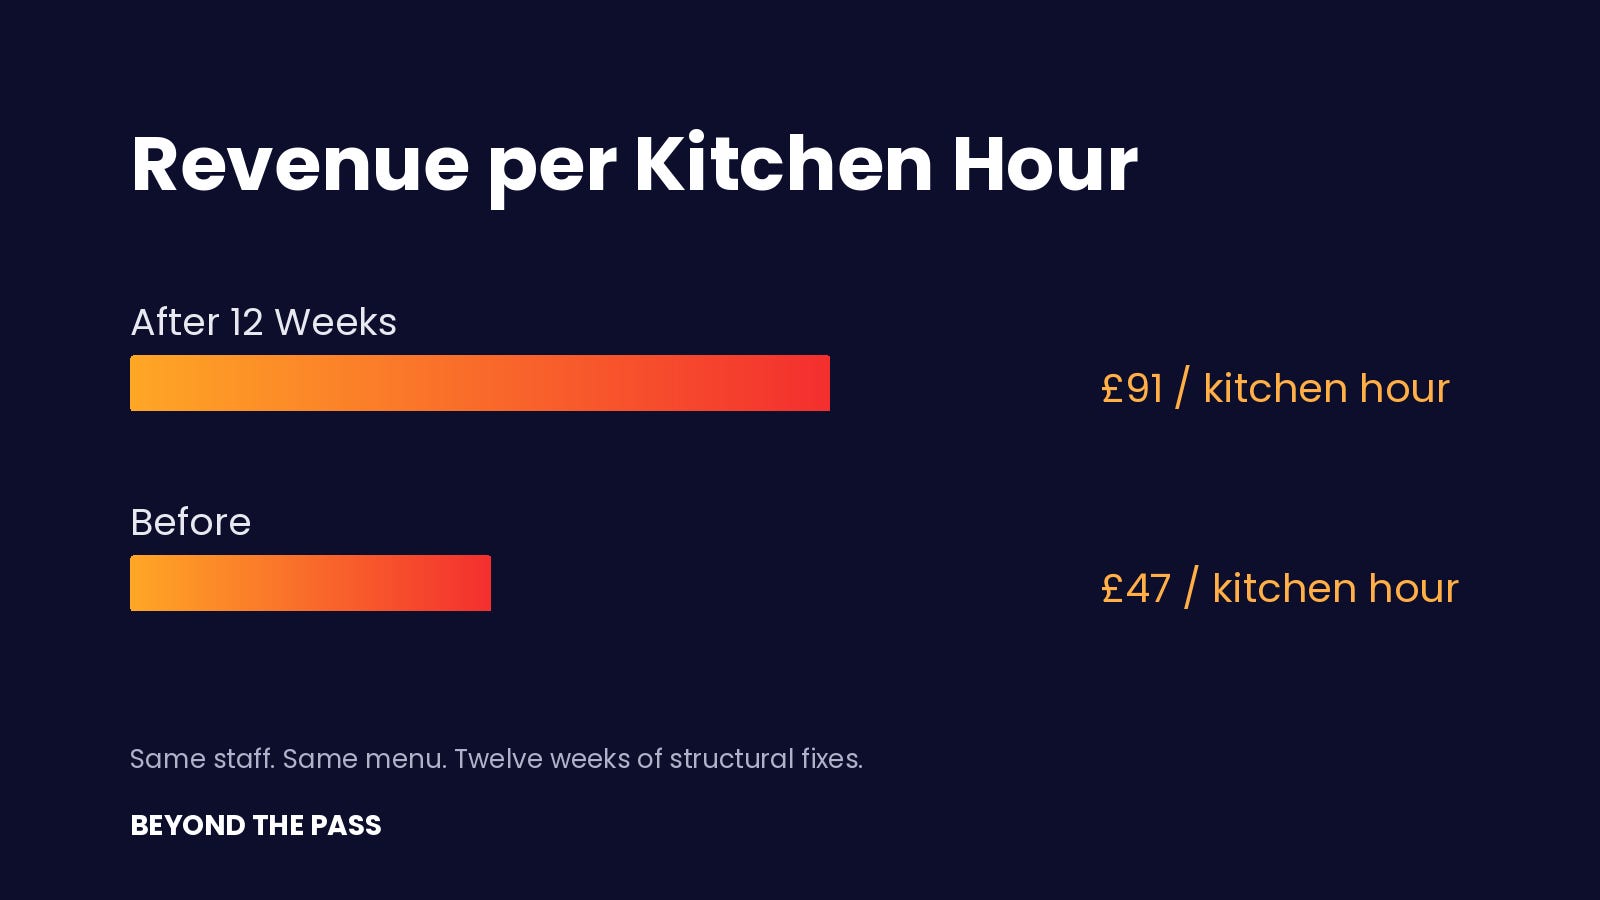
The Cotswolds pub I mentioned at the top? Same staff. Same suppliers. Same rough menu. Twelve weeks later the kitchen was producing £91 per kitchen hour and contributing £2,100/month instead of bleeding it.
The bar stopped subsidising the food. The owner stopped sleeping badly.
You don’t need to fix everything at once. You need to see one number correctly.
Pull these three figures off your last full trading week:
Total food sales, gross
Total kitchen hours worked. Chefs and KP only. Exclude FOH and management.
Total prep hours that week, including the Sunday morning pre-service block
Then run the calculation:
Step 1. Divide food sales by 1.20. That gives you ex-VAT food sales.
Step 2. Add prep hours to service hours for total kitchen hours.
Step 3. Divide ex-VAT food sales by total kitchen hours.
That number is your revenue per kitchen hour, ex-VAT. Not the version your accountant gives you. Not the blended figure that lets the bar carry the kitchen. The real one.
Use these benchmarks:
Under £55. The kitchen is structurally negative, even on busy weeks.
Between £55 and £75. The bar is subsidising you.
Over £80. The structure is roughly sound. The leak is somewhere else.
The Cotswolds pub came in well under £55 before the rebuild and over £85 after. Same staff. Same suppliers. Same rough menu. Different system.
This calculation takes five minutes if you have payroll data and a calculator. It tells you whether the kitchen is the problem before you spend twelve weeks trying to fix the wrong thing.
Two more numbers worth pulling
Once you have your revenue per kitchen hour, two more checks complete the picture.
Food cost ex-VAT. Not gross. Strip the 20% out properly. If the gross figure looks “fine” but the ex-VAT version pushes past 35%, the menu is the leak, not the labour.
Bar margin contribution to total site profit. If the bar is producing more than 60% of operating margin, the kitchen isn’t profitable. It’s being carried.
These three numbers together tell you whether the kitchen is the problem, the menu is the problem, or the bar is masking both.
If you want a free 15-minute diagnostic that surfaces these numbers automatically for your own site, it’s here.
Thanks for reading Beyond the Pass! This post is public so feel free to share it.
No posts
Comments
Nothing yet. Say the first thing.
Sign in to join the conversation.