
Well, whatever happens from here, at least we’ve performed better than the last T20 World Cup. Instead, this time, Australia (snigger) are graciously filling the Oceania group stage elimination quota.
Analysing the Black Caps’ performances so far in this T20 World Cup, and, by extension, their Super 8s prospects, has been oddly straightforward: their strengths are incredibly strong, while their weaknesses are glaringly weak, with little middle ground. As you’ll see, this is not a team that does things by halves: they’re either all in or barely at the races.
Let’s start on a positive note by analysing their strengths.
Strengths: Powerplay & Middle Overs Batting
For the last three T20 World Cups, New Zealand chose to be sandbagged at the top of the order by the dual anchors of Kane Williamson and Devon Conway. Across these three tournaments, Williamson struck at a glacial 113.4 and Conway at 111.7, both from 15 innings, while both chewed up more than 300 balls. Across this same period, Babar Azam struck at 111.8 in T20 World Cups, and we’re all aware of the recent discourse around his position in the Pakistani lineup.
So, while RizBar became the face of T20 anchors, KaneWay (ConWilliamson?) were equally guilty. Never was this more evident than in the 2022 World Cup semi-final against Pakistan, when the Black Caps limped to 152/4, with Kane scoring 46 (42) and Conway 21 (20), before Pakistan cruised to the total three down.
How the tables have turned. This time around, New Zealand have gotten with the times, quietly transforming their greatest weakness into their greatest strength, thanks to the dynamic opening partnership of Finn Allen and Tim Seifert.
To cut to the chase, across the 2026 T20 World Cup group stage, no team struck faster in the powerplay than the Black Caps, who have motored along at a SR of 164.58, equivalent to a run rate of 9.87. South Africa equal this strike rate precisely, also scoring 237 runs off 144 balls in their powerplays, but no team bests it. Accordingly, the Black Caps have also hit the second-most powerplay boundaries (40, behind South Africa’s 44).
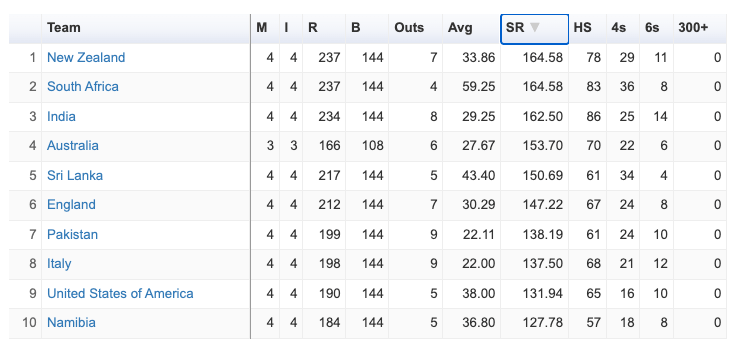
The tradeoff with this rapid scoring rate is that the Black Caps have lost 7 wickets in powerplays, with only India (8) and Pakistan (9) losing more among the Super 8 teams. At the other end of the scale, South Africa has struck the seemingly impossible balance of only losing 4 powerplay wickets, while still having the equal-fastest strike rate in this phase.
However, the middle overs are where the Black Caps have really excelled in this tournament, standing head and shoulders above the other sides. Throughout the group stage, the Black Caps struck at 168.83 between overs 7 and 16, with the next-best strike rate being Scotland at 145.
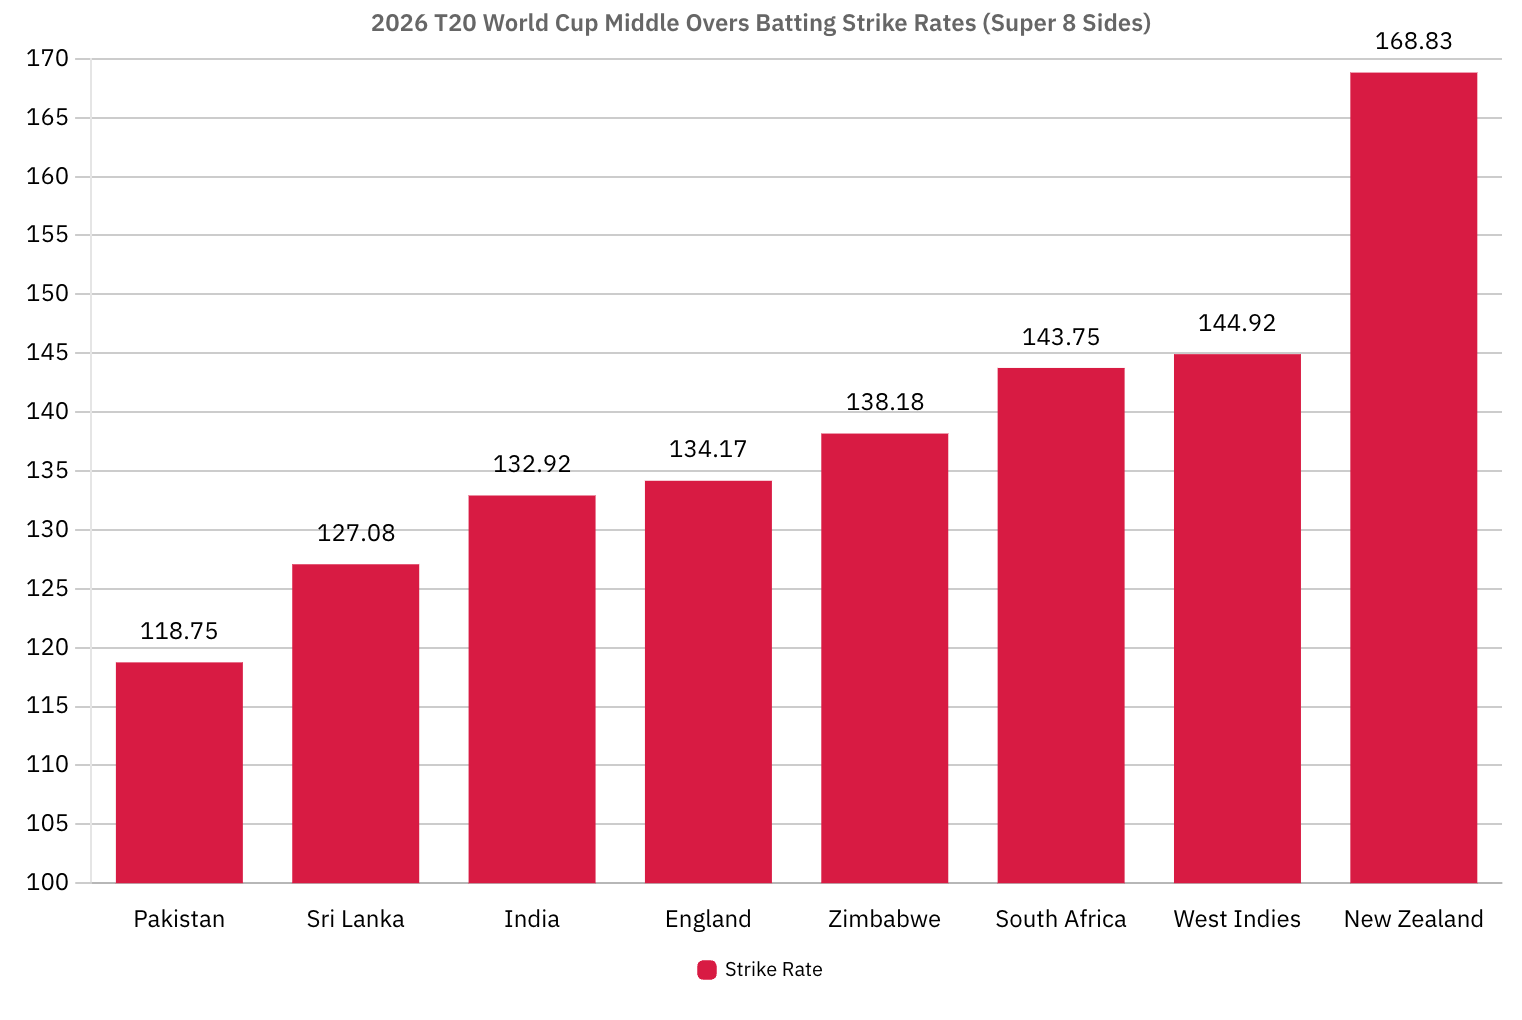
To emphasise the gulf here, Pakistan struck at just 118.75 in the middle phase, the slowest of any Super 8 side, while even the fearsome Indian batting lineup ‘only’ struck at 133.
Somehow, this destructive middle-overs batting has come without sacrificing wickets. New Zealand have averaged 65 during the middle phase and lost just six wickets so far: no team has a higher average during this phase, while only Zimbabwe (4) have lost fewer wickets. Similarly, no team has scored more middle overs runs throughout the group phase than New Zealand’s 390, with Scotland second on 348.
As in the powerplay, this middle overs dominance has been built on boundaries, with New Zealand hitting 30 fours during this phase, well clear of India’s 25 in second place. Glenn Phillips has been especially destructive throughout this period, blasting 96 runs in the middle overs at a 213 strike rate.
Then again, the Black Caps have been so good in the middle overs that they have gone largely untested at the death. New Zealand have faced just 35 death balls at this tournament, with only Zimbabwe and Italy facing fewer in the group stages.
India, on the other hand, has had almost 3x as much practice at the death, facing all 96 possible death deliveries so far. When NZ has made it to the death overs, they have performed adequately without being outstanding: they have lost the fewest wickets (1) and have the highest average (60)—largely a consequence of facing so few balls—but strike at 171.4, which puts them 6th out of the Super 8 teams, although they are ahead of tournament favourites India (167.71).
All told, across all phases, New Zealand have the highest strike rate (165.94) and second-highest batting average (49.1) of the remaining Super 8 teams. Every member of their top 6 averaged at least 36 and struck at more than 150 during the group stage. Consequently, New Zealand have completed their 4th, 9th, and 11th highest successful T20I chases in this tournament, against Afghanistan, Canada, and the UAE, respectively. In my pre-tournament preview, I noted the Black Caps’ historic weakness when chasing totals of 170+, so succeeding in three such chases in the group stage is an excellent sign.
All hail the batriarchy. Let’s just finish the article here, no need to dig into their form on the other side of the ball…
Weaknesses: Bowling
While it’s a fantastic sign that New Zealand have completed three of their highest T20I chases in this tournament, questions must be asked about why the Black Caps had to chase such large totals to begin with, particularly against Canada and the UAE.
The further I dug into the numbers, the clearer it became that bowling—by pretty much everyone, across all phases—has been the Black Caps’ biggest weakness so far. Let’s examine it phase-by-phase:
Powerplay
Throughout the group stage, only Nepal (3) took fewer powerplay wickets than New Zealand (4), while Sri Lanka and Namibia took as few. By contrast, South Africa took three times as many powerplay wickets (12).
Only Namibia and Nepal took their powerplay wickets at a higher average throughout the group stage, while only Namibia took theirs at a worse strike rate, and only Ireland and Namibia had higher powerplay economy rates than New Zealand’s 9.46. Among Super 8 sides, the next-highest powerplay economy rate has been South Africa at 8.67.
Matt Henry’s numbers are the most concerning to me in this phase. While he has been economical, conceding 7.78 runs per over, he is yet to take a powerplay wicket, which is most atypical for him, nor has he even looked particularly threatening. At the other end, Jacob Duffy has been going at a run rate of 10 in this phase and has taken just one powerplay wicket.
It is a rarity that you can call New Zealand’s new ball bowling a major weakness, but in this case, the numbers don’t lie.
Middle Overs
The story doesn’t improve for New Zealand’s bowlers in the middle phase. Throughout the group stage, only the UAE and Oman took fewer middle overs wickets than New Zealand’s 6. These were also the only two sides with worse averages and strike rates than New Zealand’s 55.17 and 40, respectively.
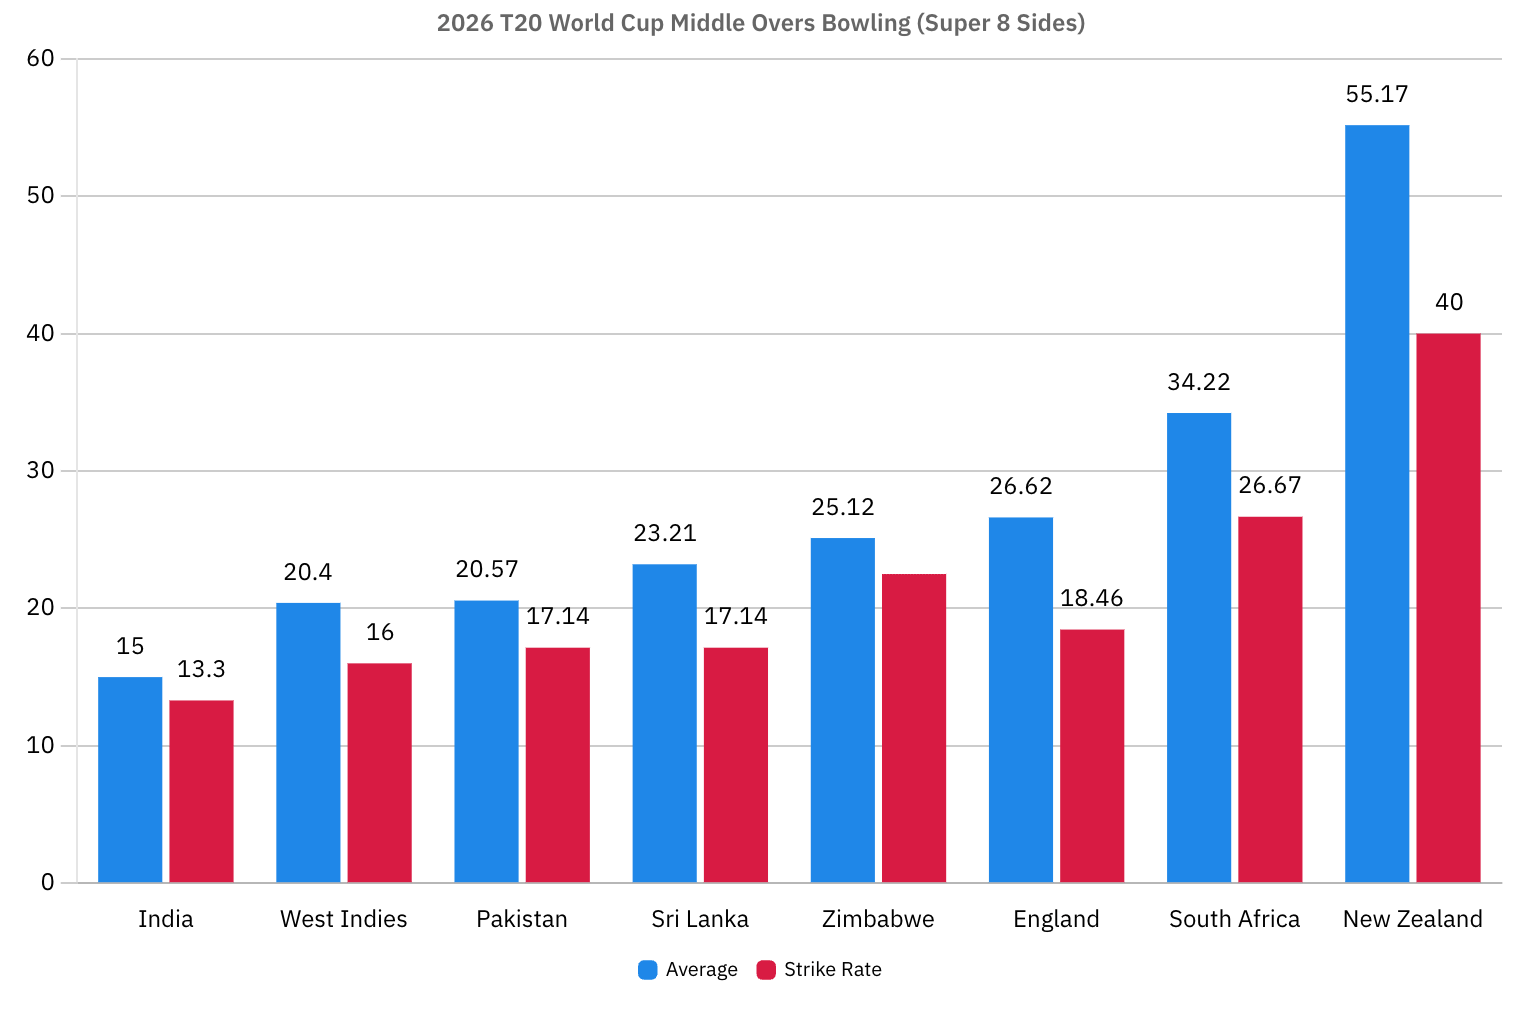
In terms of economy, the Black Caps ‘only’ rank 12th out of 20 in the middle overs, conceding 8.28 runs per over. However, of the teams ranked below them, only England (8.65) qualified for the Super 8s.
The biggest concern in this phase is that no one has been able to consistently take wickets—six NZ bowlers have taken a wicket in the middle overs, but none have taken multiple.
Mitchell Santner and Jimmy Neesham have been New Zealand’s most used bowlers in this phase, delivering 47.5% of NZ’s middle overs. While Santner has been his typical miserly self, conceding just 6.64 runs per over, he hasn’t looked at his threatening best, while Neesham has been comfortably milked at 8.75 runs per over. Jacob Duffy has also struggled, going at 10.33 during the middle overs.
Death
While New Zealand are better at picking up wickets at the death (9), this is of little value as they continue to bleed runs at an 11.24 economy rate, by far the worst of the Super 8 sides, with England, the next-worst, going at 10.79.
Worryingly, the Black Caps bowlers have conceded 11 sixes at the death so far, with only the Netherlands, England, and Oman conceding more.
During this phase, Henry and Ferguson have been the go-tos, delivering 8.1 of New Zealand’s 13.1 death overs (61.8%), and conceding 9 and 9.84 runs per over, respectively.
Bafflingly, New Zealand have also turned to Ravindra and Phillips for one death over each, which were rightly dispatched for 14 and 27 runs. Hopefully, Santner has learned his lesson.
Combined
Across all phases, the Black Caps have taken just 18 of a possible 40 wickets (with 50% of these coming at the death), at an average of 38.66 and an economy of 9.01. Among teams that have qualified for the Super 8s, these are the worst bowling numbers in all three categories, and, in the case of bowling average, the worst by a significant margin.
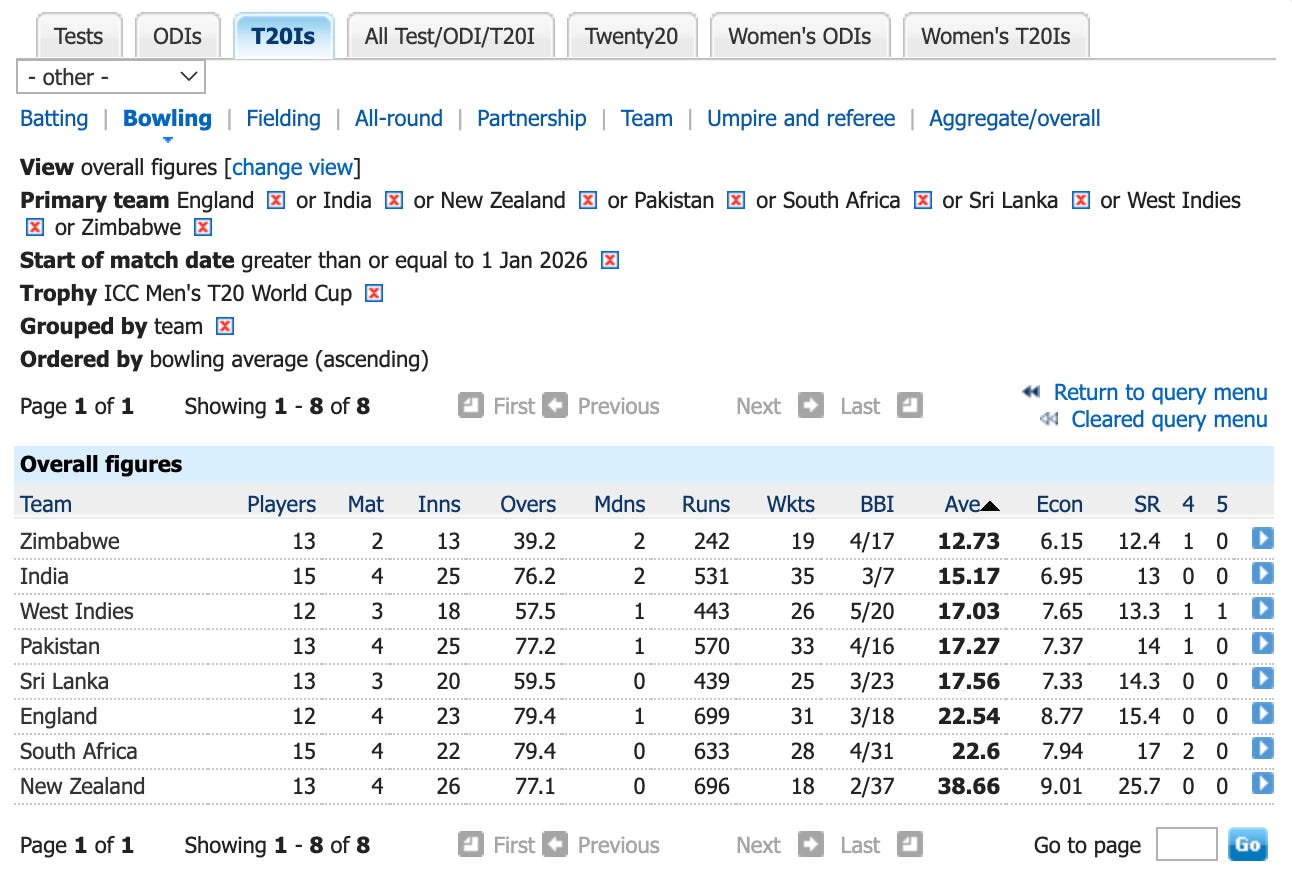
You don’t need to be a statistical genius to know that’s not good.
If the Black Caps bowlers can simply revert to the mean—not even be outstanding, just average—during the Super 8s, while the batting continues to fire on all cylinders, it may be a recipe for success. Unfortunately, right now, that looks like a big if.
Tactical Considerations: Super 8s
From here, New Zealand will move from Chennai to Colombo, where they have been pre-seeded (don’t get me started…) into a Super 8s group with Pakistan, Sri Lanka, and England.
The biggest point to note here is that the Black Caps must be prepared to face a trial by spin. Not only are they playing in Colombo, notorious for its ragging conditions, but they’re facing the three Super 8 sides who delivered the most spin overs in the group stage.
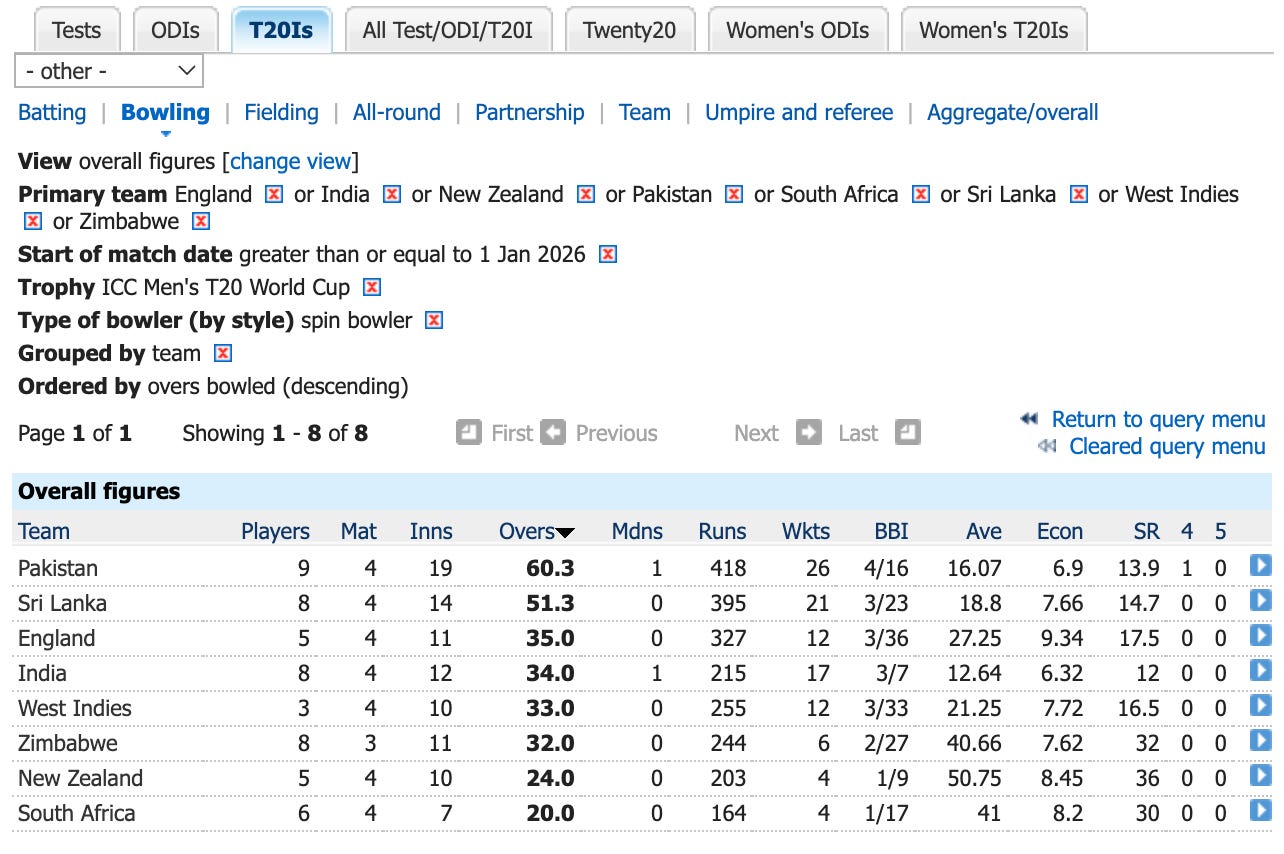
So far this tournament, Pakistan have bowled spin for 60.3 of their 79.2 overs, or 76.2% of the time. In these overs, they have conceded an RPO of just 6.9, the second-most economical of the remaining sides.
Similarly, Sri Lanka has bowled spin in 51.3 out of 79.2 overs, or 64.7% of the time.
England aren’t as spin reliant, but have still bowled it in 35 out of 79.4 overs, or 43.8% of the time.
By comparison, New Zealand have bowled spin in just 24 of 77.1 overs, or 31.1% of the time, and averages 50.75 when doing so.
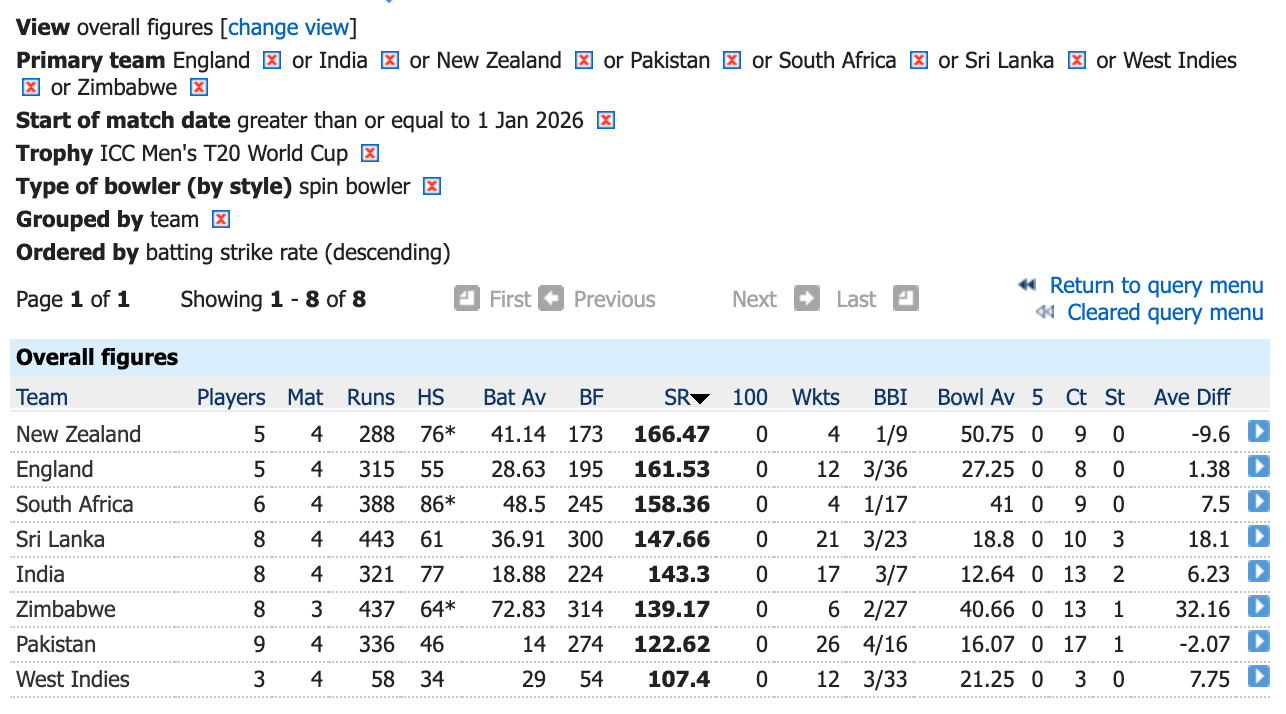
So far in this tournament, NZ has fared well when facing spin, averaging 41 and striking at 166.5, but there’s no doubt that the Super 8s will constitute a far greater challenge.
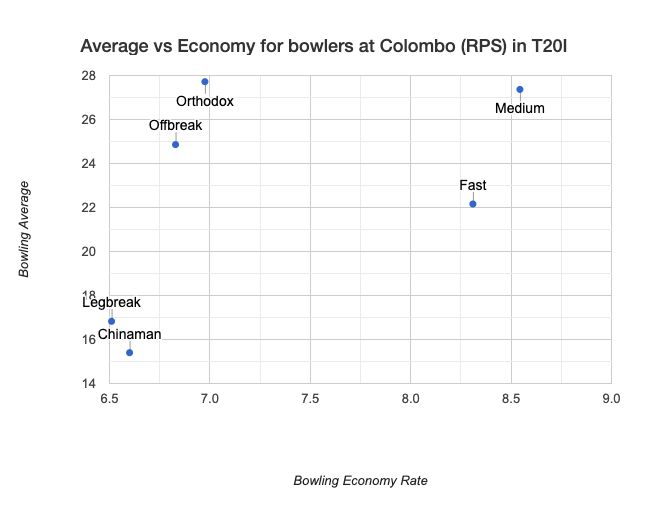
Specifically, it should come as little shock to learn that spinners are markedly more economical than seamers at the Ranasinghe Premadasa Stadium, conceding less than 7 runs per over on average, compared to over 8 for the seamers. In particular, the success of legspinners at this venue may see Ish Sodhi come into the fold for the Black Caps.
The other consideration worth noting is that Colombo has been the venue where the most twos have been run in this tournament, at least according to a stat broadcast during SL vs Zim last night that I was slightly too slow to screenshot, and now can’t seem to locate. Take my word for it?
More broadly, the average first innings score at this venue in T20Is in 2026 has been 172.25, up significantly from the last few years, where it has hovered around 130.
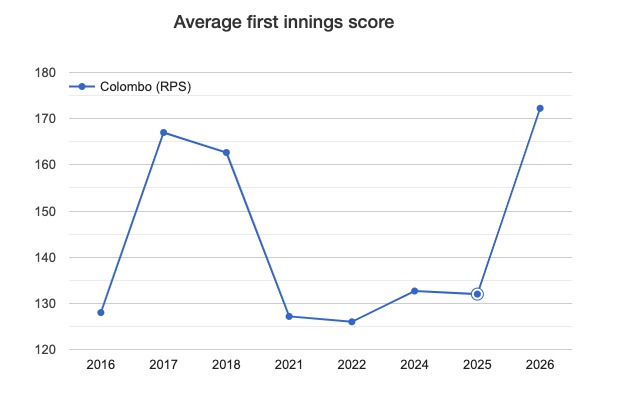
There is also a significant bias towards winning the toss and bowling first at the Ranasinghe Premadasa Stadium. In T20Is, the team batting second has won 69% of the time (20 victories) compared to 31% of the time (9 victories) for the team batting first. Although in all T20s, not just T20Is, this chasing bias practically disappears: the team batting first has won 27 games, compared to 28 for the team batting second.
Ultimately, though, I believe that New Zealand’s fate throughout the Super 8s (and beyond?) rests on at least one of Matt Henry or Jacob Duffy finding form pronto. Right now, our batting is flying, striking faster than any side remaining in the tournament, Mitchell Santner is his miserly self, conceding runs at 6.64 per over, Lockie Ferguson is bowling fast, and we’re just about getting away with a mishmash of Ravindra, Neesham, and Phillips as the fifth bowler (touch wood). New ball wickets are very much the missing piece. If the Black Caps can rectify this issue, the sky is the limit in this tournament. If not, well, they won’t need to bother booking a return ticket to India.
Thanks for reading! Like my work? Please consider supporting me via a paid subscription or Buy Me A Coffee. For more info on how your support helps me produce this work and what your contributions go towards, see my About Page!
Just keen to keep reading about cricket? Same! If you liked this article, you might also enjoy:
Comments
Nothing yet. Say the first thing.
Sign in to join the conversation.