
Introduction
Laravel Debugbar is one of the fastest ways to understand what a single request is doing.
It shows you the queries, route, views, exceptions, timing, memory use, and more in a toolbar at the bottom of the page.
The safe way to use it is simple:
- install it as a development dependency
- keep it enabled only on local environments
- use it to inspect real request bottlenecks
- never expose it on a public production app
That last part matters. The official docs are blunt about it: Debugbar can leak stored request data by design, so it should stay out of publicly accessible environments.
Which package name should you install?
This is the first place many tutorials get confusing.
You will still see both of these names online:
fruitcake/laravel-debugbarbarryvdh/laravel-debugbar
The current documentation and GitHub repository use fruitcake/laravel-debugbar.
As of March 16, 2026, Packagist shows fruitcake/laravel-debugbar v4.1.3 as the current package for Laravel 11, 12, and 13 on PHP 8.2+, and it replaces barryvdh/laravel-debugbar.
So for a modern Laravel app, this is the command I would use:
composer require fruitcake/laravel-debugbar --dev
The --dev flag is the important part. It keeps the package in your development dependencies instead of treating it like production runtime code.
Install Laravel Debugbar
Run:
composer require fruitcake/laravel-debugbar --dev
Laravel package discovery handles the service provider automatically in normal installs, so you usually do not need to register anything by hand.
Once the package is installed, open a normal HTML page in your app with local debugging enabled. You should see the toolbar at the bottom of the page.
How Debugbar gets enabled
By default, Debugbar is enabled when APP_DEBUG=true.
The package docs also expose an explicit DEBUGBAR_ENABLED environment toggle through the published config, which is useful when you want a second safety switch.
A practical local setup looks like this:
APP_ENV=local
APP_DEBUG=true
DEBUGBAR_ENABLED=true
The production rule is even simpler:
- keep
APP_DEBUG=false - do not install Debugbar as a normal production dependency
- set
DEBUGBAR_ENABLED=falseif you want an extra hard stop
If your deployment installs Composer dependencies with --no-dev, that already gives you a good first layer of protection.
Publish the config if you need control
You can use the package without publishing its config, but publishing is worth it when you want to tune which routes get ignored or how the toolbar behaves.
Run:
php artisan vendor:publish --provider="Fruitcake\LaravelDebugbar\ServiceProvider"
That creates config/debugbar.php.
Two settings are especially useful:
enabled, which reads fromDEBUGBAR_ENABLEDexcept, which lets you ignore noisy paths likeapi/*,horizon*, ortelescope*
That helps when the toolbar is technically working but the signal is buried under routes you do not care about.
What Laravel Debugbar is good at
Debugbar is best for request-by-request debugging while you are actively developing.
Typical uses:
- spot slow or repeated database queries
- confirm which route and controller handled a request
- see which Blade views were rendered
- inspect timing and memory use
- catch exceptions, log entries, and redirects faster
It is not a production monitoring tool.
If you want a bigger-picture dashboard for application behavior, Laravel Pulse is the closer fit. Debugbar is more like a local microscope for one request at a time.
Use Debugbar to catch an N+1 query
This is where the package becomes genuinely useful.
Imagine a controller that loads users and then touches each user’s posts inside a loop:
use App\Models\User;
Route::get('/debugbar-demo', function () {
    $users = User::query()->take(10)->get();
    foreach ($users as $user) {
        $user->posts->count();
    }
    return view('users.index', compact('users'));
});
This works, but it is a classic N+1 query pattern.
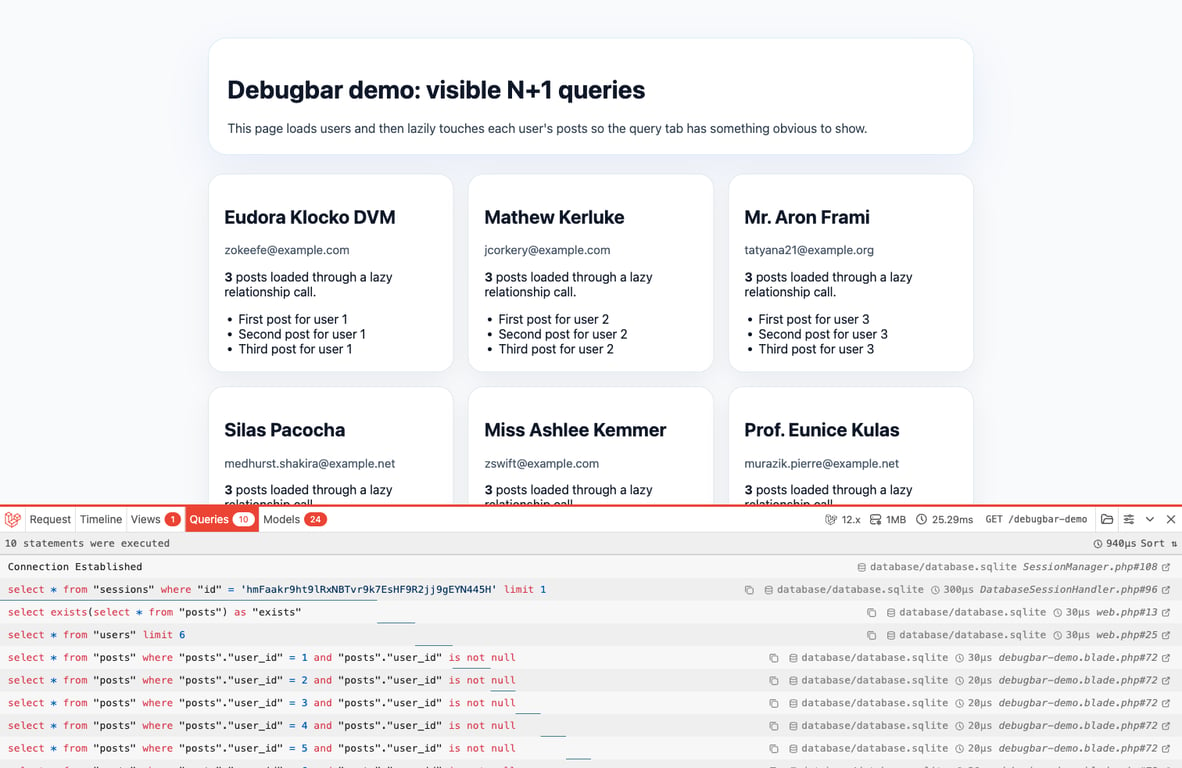
If you open that page with Debugbar enabled, the Queries tab will show the first query for the users, followed by repeated queries for each user’s posts. That is the kind of bug Debugbar makes painfully obvious.
Here is what that looks like in practice when the same lazy-loaded relationship keeps firing one query per user:
A better version is:
use App\Models\User;
Route::get('/debugbar-demo', function () {
    $users = User::query()
        ->withCount('posts')
        ->take(10)
        ->get();
    return view('users.index', compact('users'));
});
Now you still get the data you need, but without the repeated per-user queries.
That is the real value of Debugbar: it turns vague “this page feels slow” debugging into a visible list of concrete work the request is doing.
What if Debugbar does not show up?
These are the first things I would check:
APP_DEBUG is off
If APP_DEBUG=false, the toolbar will not be enabled by default.
You are not rendering a normal HTML page
Debugbar is injected into the response output. If you are returning JSON, a file download, or another response without a normal page body, do not expect the usual bottom toolbar.
The package can still collect useful request data for some request types, but the classic “toolbar at the bottom” experience is really meant for rendered pages.
Config is cached
If you changed environment values or published the config and nothing matches what you expect, clear Laravel’s cached state:
php artisan optimize:clear
The route is excluded
If you added the route to the except array in config/debugbar.php, Debugbar will skip it.
You installed it without --dev
That does not stop Debugbar from working locally, but it is a strong sign the install was not set up with production safety in mind. I would fix that immediately.
Laravel Octane note
This changed over time, so it is worth stating clearly.
Current Laravel Debugbar 4.x works with Octane out of the box according to the official installation docs.
If you are upgrading from Debugbar 3.x, remove the old Debugbar flush config from config/octane.php. That older workaround is not part of the current 4.x setup.
Should you ever use Laravel Debugbar in production?
My default answer is no.
The package can expose request data, and it also adds overhead because it has to collect and render profiling information. That makes it great for local development and a poor default for a public production app.
If you absolutely must inspect it somewhere beyond local, treat that as an exception:
- restrict access tightly
- keep the window short
- disable storage unless you truly need it
- remove it again as soon as the debugging session is over
For everyday production visibility, use tools designed for that job instead of stretching Debugbar past its safe use case.
Conclusion
Laravel Debugbar is worth installing because it gives you fast feedback with almost no setup. You can add it in minutes, load a page, and immediately see where the request is spending time.
The trick is not the install itself. The trick is keeping it local-only, using it to answer specific questions, and not letting a development convenience drift into production.
If you want to keep improving the request and query side of your app after this, these are the next reads I would keep nearby:
Comments
Nothing yet. Say the first thing.
Sign in to join the conversation.