
"Nobody gives you credit for the tool, they give you credit for solving the problem."
The secret to learning SQL better is not thinking about SQL. It is thinking about the problems. Why? Because sometimes, to know which tool to bring to a disaster scene, you must first understand the disaster. And to really know whether you can use a tool effectively, you must use it in a real disaster, not in a simulation. You see, the tool is not the star of the show. The problem is. Nobody gives you credit for the tool; they give you credit for solving the problem.
As someone who has spent a lot of time teaching SQL and writing SQL learning material, I will tell you right now that many beginners do not actually struggle with SQL syntax. They struggle with thinking analytically. They know the “tool” but do not know how to use it in a disaster.
A lot of SQL resources teach commands in isolation. They focus on the tool, not the problem. You learn SELECT statements, GROUP BY, joins, and maybe a few window functions, but you rarely get pushed to think through a complete analysis workflow from beginning to end.
As an educator, I have always tried to teach SQL by focusing on the problem first. Let’s analyze Day 22 of SQL Essentials for Data Analysis: A 50-Day Hands-on Challenge Book (Go From Beginner to Pro) shows you exactly what that strategy looks like.
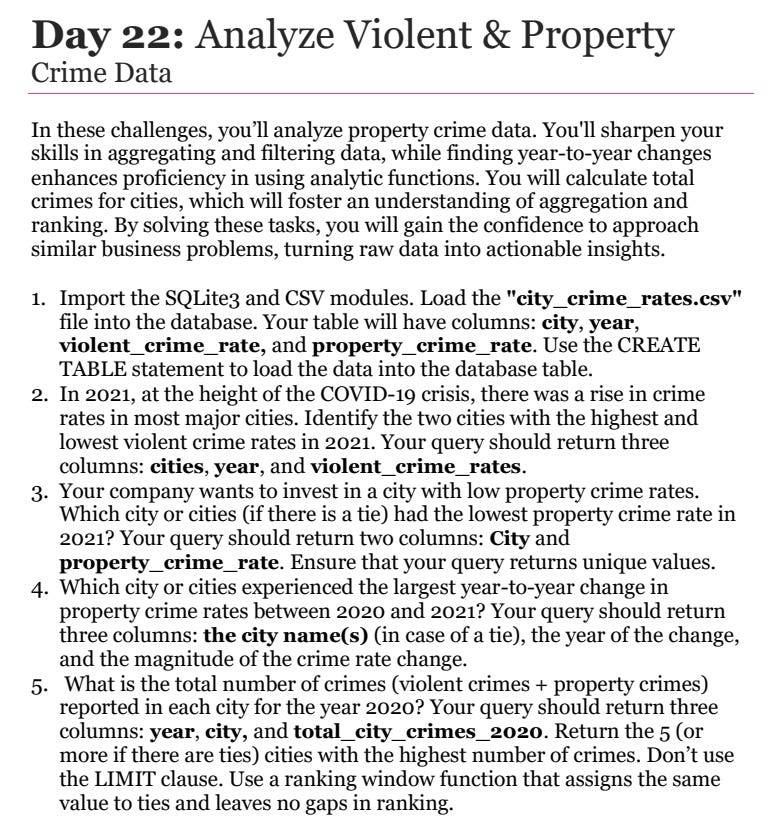
The chapter is called Analyze Violent & Property Crime Data. The dataset contains real city-level violent and property crime statistics across multiple years. Instead of giving readers preloaded tables and disconnected exercises, the goal was to force them to work through realistic analytical thinking step by step.
That is basically a mini capstone project disguised as five SQL questions. And honestly, if I was learning SQL right now, these are exactly the kinds of questions I would want to spend my time solving.
The first task asks you to import SQLite3 and CSV modules, create a database table, and load the city_crime_rates.csv file into SQLite.
1. Import the SQLite3 and CSV modules. Load the “city_crime_rates.csv” file into the database. Your table will have columns: city, year, violent_crime_rate, and property_crime_rate. Use the CREATE TABLE statement to load the data into the database table.
That may sound basic, but is it really though?
Most learning platforms completely skip this step and hand learners perfectly prepared tables. Real work does not happen that way. A huge percentage of analysis work involves getting data into the database correctly in the first place. That is why I wanted readers to experience schema creation, data types, inserts, file handling, and Python-SQLite integration directly instead of hiding the setup process from them.
One bad schema decision can create problems for every query that follows. That lesson sticks much harder when you build the pipeline yourself.
The second challenge asks you to identify the two cities with the highest and lowest violent crime rates during 2021.
2. In 2021, at the height of the COVID-19 crisis, there was a rise in crime rates in most major cities. Identify the two cities with the highest and lowest violent crime rates in 2021. Your query should return three columns: cities, year, and violent_crime_rates.
Again, this sounds simple until you realize this is exactly the kind of question stakeholders constantly ask. What performed best? What performed worst? What changed?
You practice filtering correctly using WHERE clauses and structuring ranked outputs properly instead of simply dumping rows from a table. Slowly, you stop thinking like someone solving exercises and start thinking like someone answering actual questions and solving problems.
Once you use SQL to solve a real problem, something inside you clicks. You finally connect the dots. That transition matters more than most beginners realize.
This was one of my favorite questions in the chapter.
3. Your company wants to invest in a city with low property crime rates. Which city or cities (if there is a tie) had the lowest property crime rate in 2021? Your query should return two columns: City and property_crime_rate. Ensure that your query returns unique values. The task asks you to identify the city or cities with the absolute lowest property crime rates in 2021 while correctly handling ties.
Most beginners immediately throw LIMIT 1 into the query and call it a day. That works until multiple cities share the same value. And this is exactly where beginner SQL starts breaking down because real datasets contain ties constantly.
I wanted readers to think in terms of qualifying sets instead of isolated rows. That shift is incredibly important because analysis is rarely about finding one magical record. It is about identifying all qualifying outcomes correctly.
The chapter forces you to think in terms of qualifying sets instead of isolated rows. You start using aggregation more carefully and learn that “lowest” does not always mean “single row” and “highest” does not mean “single row” either.
This is where the chapter becomes really interesting.
4. Which city or cities experienced the largest year-to-year change in property crime rates between 2020 and 2021? Your query should return three columns: the city name(s) (in case of a tie), the year of the change, and the magnitude of the crime rate change.
The challenge asks you to identify which cities experienced the largest year-to-year changes in property crime rates between 2020 and 2021. Importantly, this pushes you toward analytic functions instead of awkward beginner-style solutions.
You start asking the right questions. Should I use LAG()? Should I partition by city? You are focusing on the problem and you are thinking about how to use SQL to solve the problem. You calculate differences across years. You analyze trends instead of isolated values.
Honestly, this is one of the biggest jumps from beginner SQL to professional SQL. Once you understand how to compare values across time periods properly, you unlock patterns used everywhere in analytics, including sales trends, customer churn, revenue tracking, and financial reporting. At this point, you are not just writing queries; you are solving real problems.
The final challenge asks you to calculate total crimes for each city in 2020 and return the top cities using a ranking window function instead of LIMIT.
5. What is the total number of crimes (violent crimes + property crimes) reported in each city for the year 2020? Your query should return three columns: year, city, and total_city_crimes_2020. Return the 5 (or more if there are ties) cities with the highest number of crimes. Don’t use the LIMIT clause. Use a ranking window function that assigns the same value to ties and leaves no gaps in ranking.
I specifically wanted readers to avoid relying on LIMIT because it becomes a crutch very quickly.
The chapter specifically pushes you toward DENSE_RANK(), which forces you to handle ties correctly while preserving proper ranking behavior. That matters in real reporting environments where ties happen constantly and rankings need to remain logically consistent.
This final task combines aggregation, ranking functions, filtering, and ordering into one realistic query structure. It mirrors the exact kinds of SQL patterns analysts repeatedly use in dashboards, reporting systems, and BI tools. It feels practical because it is practical.
I still think online SQL platforms have value. They are excellent for syntax repetition and quick practice. But many of them accidentally train learners to think in disconnected exercises instead of complete workflows.
I wanted this chapter to feel different. Everything builds naturally on the same dataset. Readers ingest the data themselves, clean it, analyze it, compare years, rank outcomes, and use analytic functions properly. By the end, they have effectively completed a small analysis project rather than a random collection of exercises. And since you have the data, you can even go beyond the 5 questions by analyzing the data further.
That confidence transfer matters because employers are not paying people to solve isolated small problems. They are paying them to work through messy analysis from beginning to end.
What I wanted this chapter to teach was something bigger than SQL syntax. I wanted it to teach analytical thinking. By the end of these five questions, readers have already practiced loading data, building tables, filtering information, handling ties correctly, analyzing time-series changes, and using window functions properly. That is the difference between “learning SQL” and becoming useful with SQL.
And honestly, if I was starting over today, these are exactly the kinds of questions I would want to spend my time solving.
These are the best hands-on materials that teach how to use the important libraries in data analysis: pandas, Matplotlib, seaborn, NumPy, etc. You will also learn to write SQL queries by answering questions that data analysts face in the world, using real datasets. Get the bundle if you want real, practical learning.
No posts
Comments
Nothing yet. Say the first thing.
Sign in to join the conversation.