
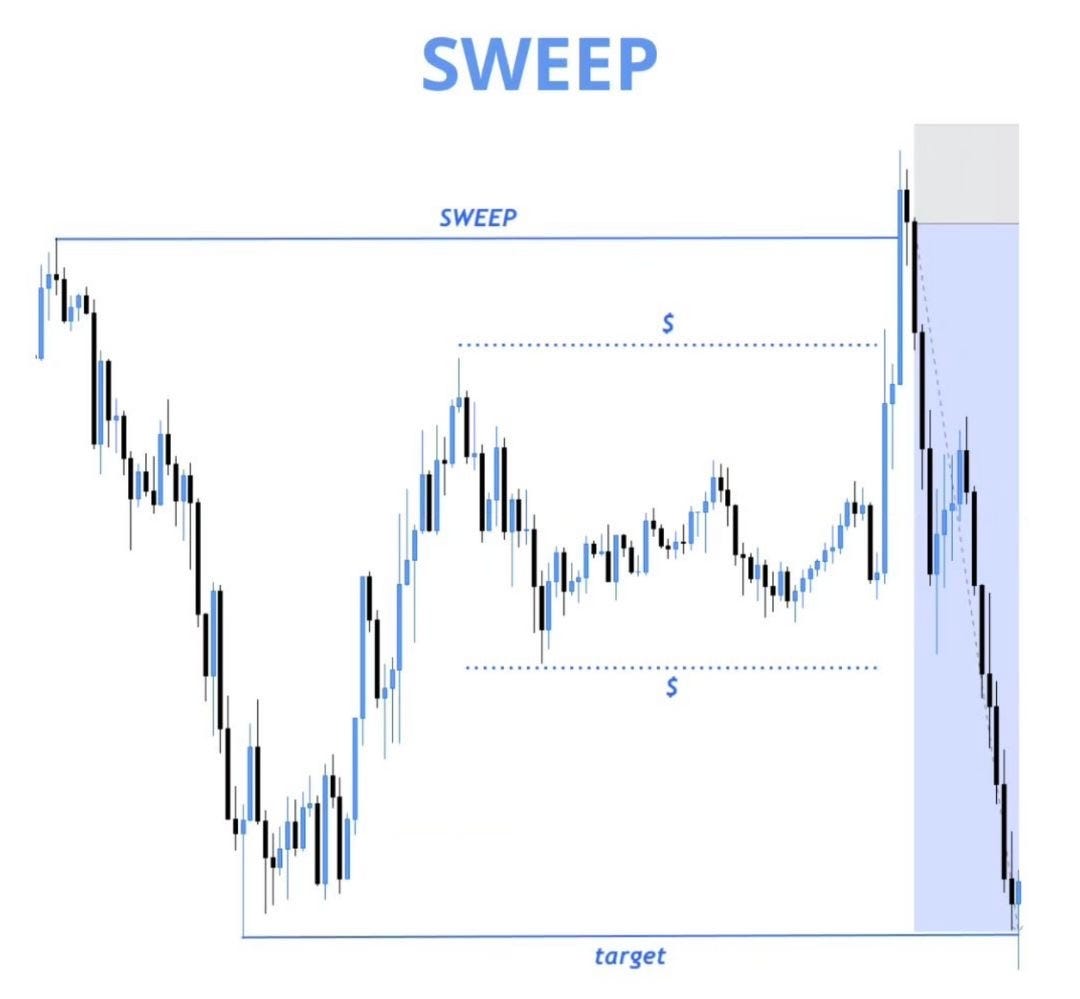
In our last few posts, we talked about drawing lines at the floor (Support) and the ceiling (Resistance). But here is a secret that the big institutional banks and professional traders know: Those lines aren’t just boundaries, they are target zones.
When a retail trader buys a stock at a support floor, where do they usually put their safety net (Stop Loss)? Right underneath that floor.
When hundreds of thousands of traders all put their safety nets in the exact same spot, it creates a massive Liquidity Pool.
The Trap: The big players (the “Smart Money”) need huge amounts of buy or sell orders to fill their own massive positions. To do this, they will intentionally push the price just far enough to crash through a floor or ceiling, triggering everyone’s safety nets all at once.
The Sweep: This is called a “Liquidity Sweep” or a stop hunt. It looks like a scary sudden drop or spike on the chart. Retail traders get panicked because they just got knocked out of the trade, but immediately afterward, the price violently reverses and heads in the direction they originally wanted.
The big players didn’t crash the stock because it was failing, they just went fishing for the money resting below the floor to fuel their next big move.
Once you understand liquidity, you stop looking at the market like a series of random patterns. You start looking at it like a map of where the money is hiding, and you learn to wait for the sweep to happen before you place your bet.
The Homework: Spotting the Honey Pot
Step 1: Open a Chart
Go to TradingView or your charting app and find a clear horizontal floor (Support) where a stock has bounced two or three times.
Step 2: Think Like the Big Banks
Look right below that floor. If you were an institutional trader looking to buy millions of shares, why would that zone underneath the floor be the perfect place to hunt?
Step 3: Look for the Tail
Look for a candlestick with a very long wick that pierced right through that floor before the price snapped back up. That thin line is the footprint of a liquidity sweep.
Step 4: Post Your Analysis
In the comments, share your insight: “On the chart for [$Ticker], I see a major liquidity pool sitting right under $[Price] because that’s where the main floor is.”
No posts
Comments
Nothing yet. Say the first thing.
Sign in to join the conversation.