

I spent a day pulling ICP’s entire on-chain history from DFINITY’s public APIs. Burn rate back to Genesis, minting, staking behaviour, storage, canister counts, identity users. Every number in this article came from an endpoint you can query yourself. I’ve listed them at the bottom so you can check my work if you want. Data pulled 2 August 2026.
Here is what I found:
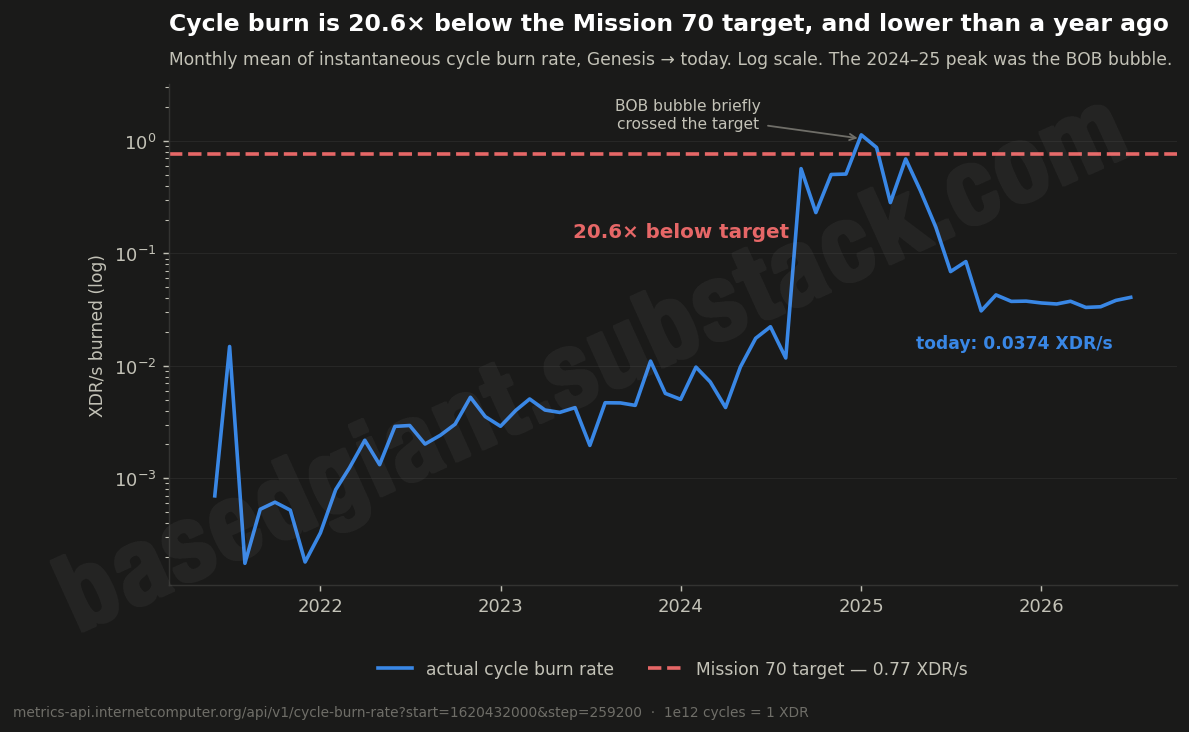
Cycle burn is running at 0.037 XDR per second against the Mission 70 target of 0.77 XDR. That is a ~20x gap, and burn is lower today than it was a year ago.
The target has been exceeded exactly twice, in January and February 2025, during a burn spike that then decayed to a fraction of its peak.
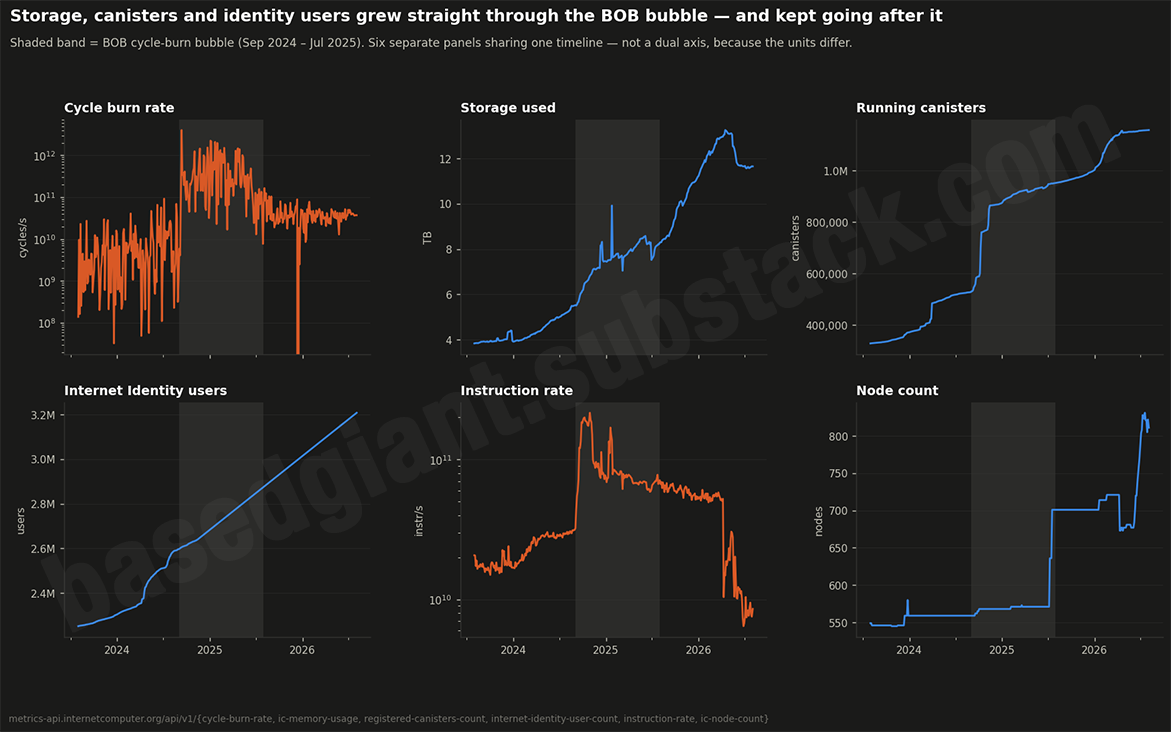
Canister count and identity users grew straight through that bubble and kept climbing after it popped. Storage grew too, though it has slipped from an April peak.
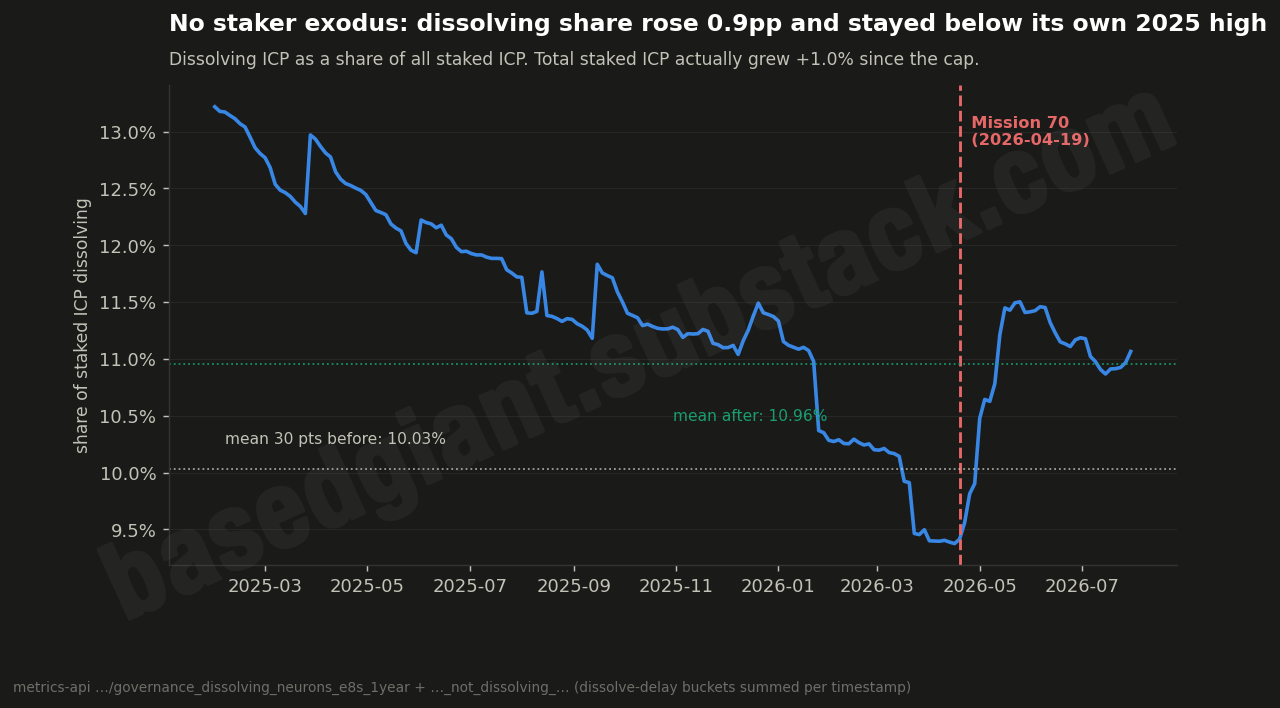
Mission 70 caused no staker exodus. Total staked ICP actually rose. The “8 Year Gang” was re-bucketed to the new cap rather than leaving.
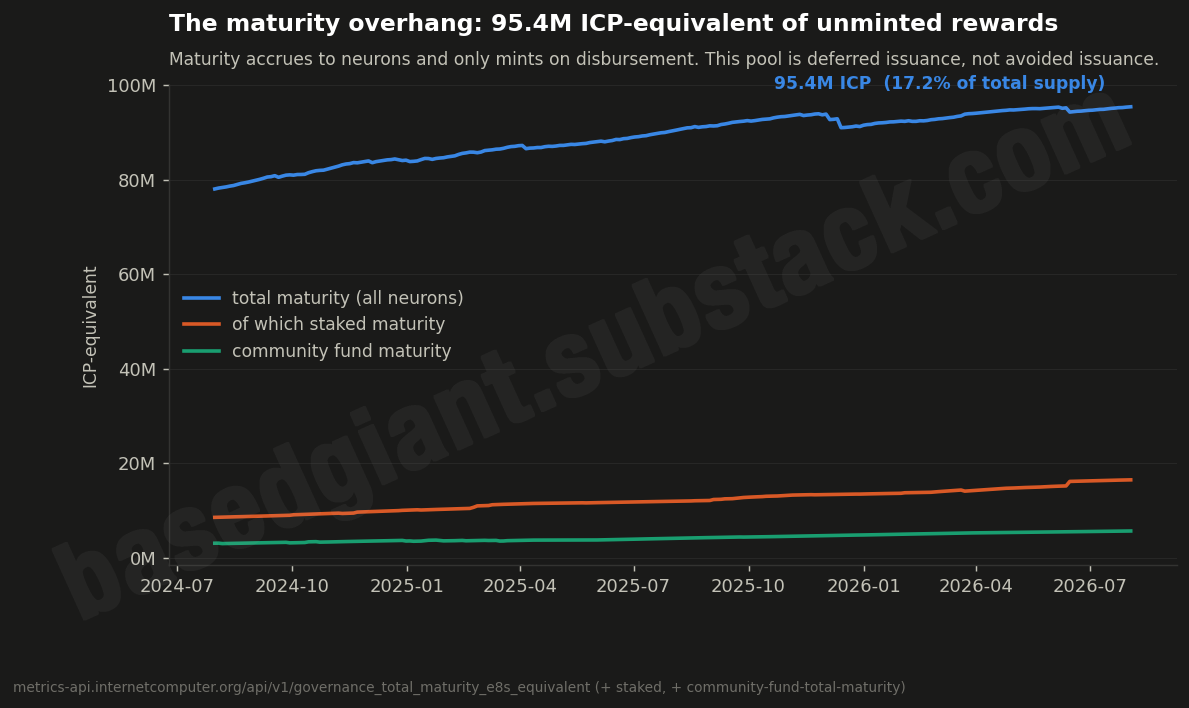
95.4 million ICP of maturity is earned but unminted. That is 17.2% of total supply, and it is part of why measured inflation looks lower than it is.
99.85% of ICP burned is real cycle conversion, not transaction fees. The burn is small, but it is genuine demand.
Two of those findings are bearish, two are bullish, and two of them go both ways. That is roughly how the data came out, and I’m not going to pretend otherwise in either direction.
The gap is 20x, and it is DFINITY’s own number
Mission 70 is DFINITY’s plan to cut ICP inflation by 70% during 2026. The supply side does most of the work: sliced voting rewards, and reduced node provider rewards, taking annual inflation from 9.72% to 5.42% by January 2027. That part passed the NNS back in April and is already happening.
The demand side is the other half, and it needs the network’s cycle burn rate to reach 0.77 XDR per second. XDR is the IMF’s basket of currencies. 1 trillion cycles is defined as 1 XDR, worth about $1.36 today.
I measured the current rate at 0.0374 XDR per second, taking the median of the last 90 days. The most recent single sample was 0.0361 XDR per second.
That is 20.6x below the target.
In dollar terms, the whole network’s usage revenue is about $4,391 a day, or $1.60 million a year. Mission 70 requires roughly $90,511 a day, or $33.04 million a year.
*Worth noting: DFINITY’s own whitepaper stated the starting rate as 0.05 XDR per second, which produces the 15x figure you might see quoted. The measured rate is lower than that, so their own number understates the task.
The only time ICP hit the target, it was a bubble
Here is the part that might surprise some of you who are newer to ICP.
The target has been reached twice. Monthly average burn hit 1.1344 XDR per second in January 2025 and 0.8758 XDR in February 2025. Both well above the required 0.77 XDR.
But then it collapsed. Today’s rate is only about 3% of that January 2025 average, and under 1% of the spike’s single highest reading.
Pulling the full series back to Genesis makes the shape obvious. From 2022 through 2023 the network averaged 0.0035 XDR per second. Through the first 8 months of 2024 it averaged 0.0110. Then in September 2024 it jumped roughly 48x in a single month, stayed elevated for 11 months, and fell back.
The spike coincided with the BOB frenzy, a token where people burned cycles for a chance to mine it. I want to be precise here: I measured the spike and its decay, but I did not independently verify the cause. However, the BOB attribution is common ecosystem knowledge.
Either way, the mechanism matters for how you read it. That burn came from a token lottery. Mission 70’s burn is meant to come from enterprise cloud subscriptions. Those are different economic objects, and citing the first as evidence for the second doesn’t hold up.
What it does prove however, is that the network can physically process that throughput. The infrastructure handled 1.13 XDR per second without breaking. That is a real finding and it is an important one.
On-chain ICP analysis, with receipts included. Free to subscribe.
Adoption kept growing after the bubble popped
This is the section that changed my mind, and it’s the strongest bullish evidence in the whole data pull.
If the 2024-25 spike was the only thing holding ICP up, everything else should have fallen with it. But it didn’t.
Storage matters more than the others, and here’s why. Canisters pay a continuous rental fee for the memory they hold. Stored bytes are therefore contractual recurring burn. You cannot fake it with a token lottery, because the lottery doesn’t store anything.
Storage grew 49% during the spike and another 42% in the year after it. Though it peaked at 13.26 TB in April 2026 and has since slipped about 12% to 11.65 TB. Canister count did the same. Identity users are the sharpest case: they barely moved during the spike, up just 1.6%, then grew 21.5% after it, so that growth is not the bubble’s echo. Node operators added 45% more machines over three years and 46% more CPU cores. None of that follows a speculative burn that has since evaporated.
The counterweight, because there is one: instruction rate is at 4% of its peak, and 73% below where it sat before the spike even started. Actual compute executed has fallen hard while stored bytes rose. ICP is accumulating storage customers considerably better than compute customers, and storage is the cheaper of the two per unit of burn.
Also worth knowing: total network memory capacity is about 1,580.00 TB against 11.65 TB used. That’s 0.74% utilisation. Nothing here is capacity constrained.
Mission 70 didn’t break the stakers
The loudest objection to Mission 70 was that capping maximum dissolve delay from 8 years to 2 would break faith with long-term holders and trigger an exit. It’s worth checking whether that happened, because it’s the kind of prediction people make loudly and then never revisit.
It didn’t happen.
Total staked ICP rose 1.04%. Dissolving stake went up 19% in absolute terms, but the share of stake that is dissolving sits at 11.07%, which is still below its own January 2025 level of 13.22%.
The structural fingerprint is clearer than the headline numbers. Every dissolve-delay bucket above the new cap terminates on the same date, 19 April 2026. The bucket that held over 156 million ICP at 96+ months simply stops. The 24-month bucket, which is where a capped neuron now lives, reads over 183 million ICP today and is still growing.
The long-lock stake was re-bucketed to the new 2 year cap, not withdrawn.
One thing to not misread: total potential voting power jumped 67% in a single three-day step on 22 April, and deciding voting power jumped 65% on the same date. Every adjacent step is under 1%. That is the voting-power formula being re-parameterised, not stakers doing anything.
The catch: 95 million ICP is earned but unminted
Here’s where the picture gets less flattering, and it’s the finding I’d most want a perma-bull to sit with.
Measured minting over the last quarter annualises to about 2.5% of supply. Over the full trailing year it’s 3.59%. Either figure is below Mission 70’s stated supply-side target of 5.42%, which sounds like the plan is running ahead of schedule.
It isn’t, and part of the reason is maturity.
Voting rewards stack as maturity and only become minted ICP when a holder disburses them. The ledger records the disbursement, not the stacking itself. So the low measured minting rate is partly delayed issuance, not avoided issuance.
The maturity pool currently holds 95.4 million ICP-equivalent. That is 17.2% of total supply, sitting as a claim that hasn’t hit the ledger yet. It grew by 4.94 million ICP over the trailing 12 months, which is 0.89% of supply per year.
Does that explain the gap? Only about a third of it.
The gap between measured minting (2.5%) and the accrual target (5.42%) is 2.92 percentage points, or roughly 16.2 million ICP a year. Maturity growth covers 4.94 million of that, about 30%. On the longer 364-day basis the gap is narrower and maturity covers closer to half.
I can’t close the rest with this data, and I’m not going to invent an explanation for it. What I can say is that anyone quoting ICP’s low measured inflation as a bullish datapoint, is quoting a number with a 95 million ICP asterisk attached.
The burn that exists is real
One objection I expected to find support for, and didn’t.
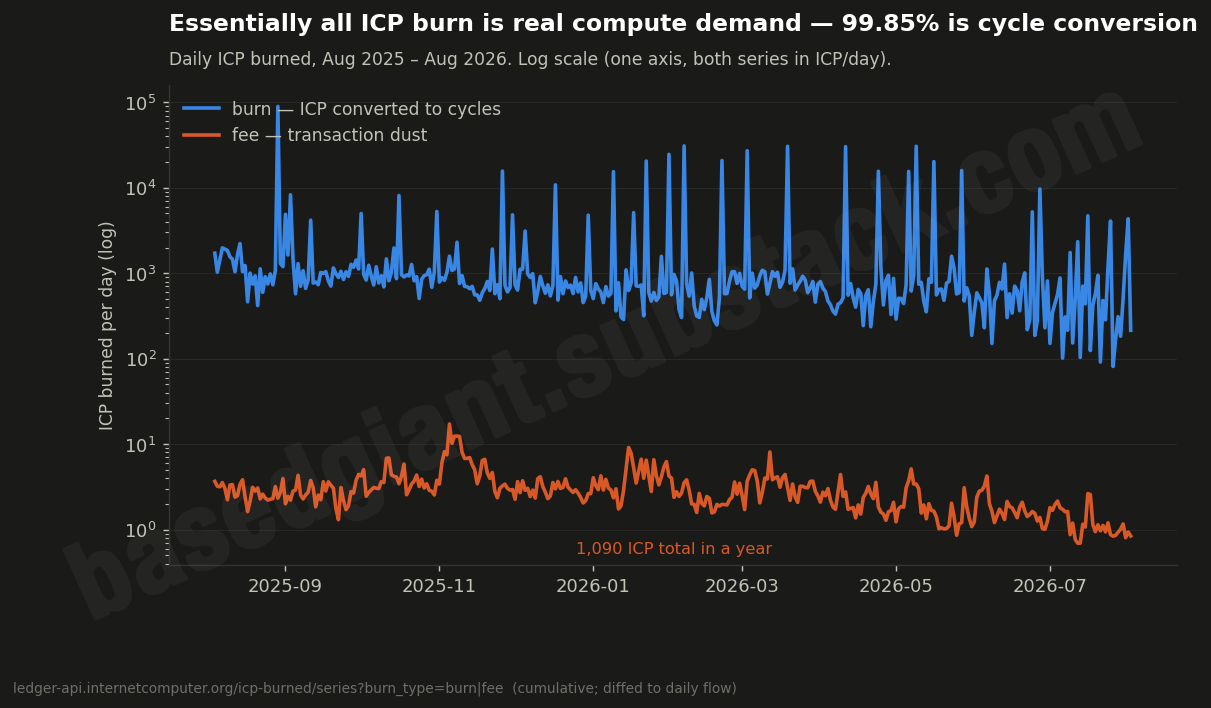
A common criticism of low-burn networks is that most of what gets burned is transaction fee dust, and other “gotchas” rather than genuine demand for compute. On ICP that turns out to be false.
Splitting the burn by type across 364 days:
Essentially all of it is someone actually buying compute. The burn is small, but it is not noise.
One thing worth noting: mean daily burn is 2,055 ICP against a median of 741. That’s a 2.8x gap, which means burn is lumpy. It’s driven by periodic large conversions rather than a steady retail drip.
While we’re here: about “deflationary day” posts
A quick note, because you’ll see these. I’ve made this exact post myself in the past, which is part of why I wanted to actually check the data.
Over 364 days, 16 days were net deflationary. That’s 4.4%. So a post announcing that ICP burned more than it minted on some specific day is describing a real but roughly 1-in-23 event.
The reason is the payout calendar. Mean daily minting is 54,544 ICP against a median of 10,179. Large node provider payouts lands between the 13th and 16th of every single month. 78 days out of 363 account for 86% of all minting. Those are the days where minting ran more than 3x the median.
On the other 285 days, minting is low and a deflationary day is much easier to hit. It tells you about the payout schedule, not about burn strength.
The number that actually matters is simpler: burn offsets 3.8% of minting. Net annualised inflation is +3.45%. For the network to break even against current minting, minting would need to fall 96% or burn would need to rise 26.5x. That is a higher bar than the 20x gap to the Mission 70 target, because it must offset all issuance, not just hit the burn number.
What I’d watch instead of the price
Three things will tell you whether this is working, and all three are checkable.
The cycle burn rate on ICP Index. Is it genuinely climbing toward 0.77 XDR per second, or holding flat around 0.037? Over the last twelve months it has been flat to slightly down. If that changes, it changes everything else in this article.
Whether DFINITY ever publishes a cloud engine customer count. Cloud engines are the product Mission 70’s demand side is built on, and they are not generally available yet. A company winning enterprise deals eventually wants to talk about them. Too much silence past general availability would be its own answer.
Storage growth. It is the only demand metric here that is contractual, recurring, and immune to speculation. Storage compounded for two years before slipping from its April 2026 peak; whether it resumes climbing is the tell. If it does while burn stays flat, that says something specific: ICP is winning cheap storage customers faster than expensive compute ones.
My verdict
The technology claims survive head on contact with the data. The commercial ones don’t, yet.
Everything Mission 70 depends on is built and demonstrably working. The burn mechanism functions, supply-side cuts passed and are landing, stakers didn’t flee. Storage, canisters and users have compounded for three years straight, entirely independently of the speculative spike that made ICP’s burn chart look good for eleven months in 2024 and 2025.
What’s missing is customers. The gap isn’t 20% or 200%. It’s 2000%, against a burn rate that has fallen over the past year while the target stayed fixed. Five months left in the year the target was set for, on a product that hasn’t reached general availability.
My honest prediction is that Mission 70’s demand-side target will not be hit in 2026. I’d be glad to be wrong. Nothing in this article is an argument against ICP. It’s an argument against taking the target on pure faith, which is a different thing.
The adoption substrate is real though and compounding in a way I did not expect before I pulled this data. If cloud engines ship and sell into the European sovereignty demand that is currently being written into law, the burn side has a path. If they don’t, ICP is just a well-built network with 0.74% utilisation and a token that inflates at 3.45% a year.
If this was useful, subscribing is free and it helps more than you’d think.
On-chain ICP analysis, with receipts included. Free to subscribe.
Data Sources
metrics-api.internetcomputer.org,
ledger-api.internetcomputer.org,
ic-api.internetcomputer.org.
Comments
Nothing yet. Say the first thing.
Sign in to join the conversation.