
Summary
Market: Volatility has collapsed, what next? Are crypto equities indicating that sentiment is improving? Short term holders remain underwater.
On-Chain: Fees and transactions on the Bitcoin and Ethereum networks
Cryptoverse: World Mobile launches in the Philippines; Uniswap fee switch
Macro: Is AI inflationary, not deflationary? Gold leads bitcoin in a bull, lags in a bear; the case for a turn in the Yen
A quick word first for those of you who couldn’t join our recent webinar, “Has Crypto Hit Bottom”. We run through the arguments we made in Chainletter 83, that the medium term outlook is better than it has been for some time.
We begin by examining the fundamental drivers. Crypto is finally moving from the laboratory and is being adopted by mainstream finance, with real-world assets set to come on-chain at scale. We draw the parallel with the dot-com years, where the lasting winners turned out to be the smaller networks quietly building traction rather than the names everyone knew. From there we set the macro scene: the steady debasement of currencies, and a regulatory fog that has started to lift with the Genius and Clarity Acts.
Then we turn to where we think we sit in the cycle. We look at Bitcoin’s gold ratio, at ETF flows, and make the case for Ethereum as the more institutionally investable of the two, with the settlement-layer thesis set out in full.
And finally, the question in the title. We talk through the signs that suggest a bottom, Bitcoin’s growing habit of shrugging off bad news, and the three catalysts we’re keeping an eye on. A Q&A rounds things off, including an honest assessment of downside risk.
It’s an hour well spent, we think. The recording is here.
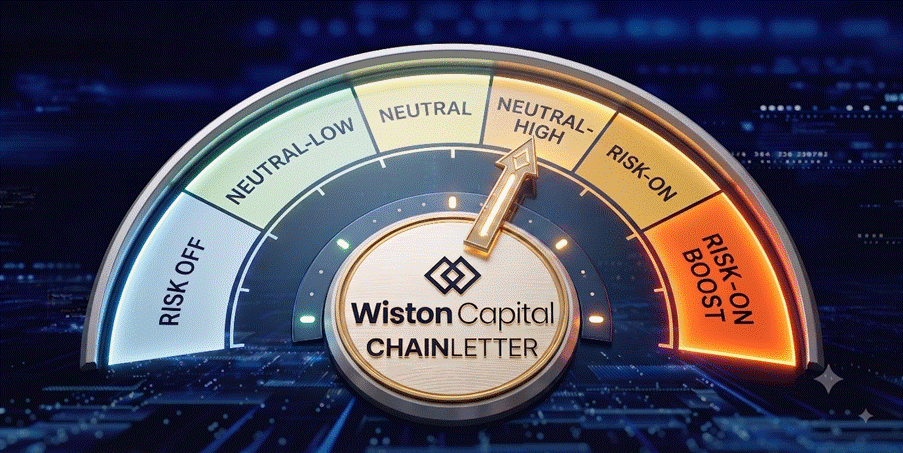
Our short term internal risk model is dialling down from Risk-On towards Neutral. The culprit is a declining liquidity indicator.
Markets are very, very nervy. Admittedly it’s the August silly season, but caution is the watchword as we approach the autumn. While geo-political tensions are most frequently cited, the more important factor is the unwind of the tech bubble, not to mention tremors in Japan. We’ll come onto that in the Macro section.
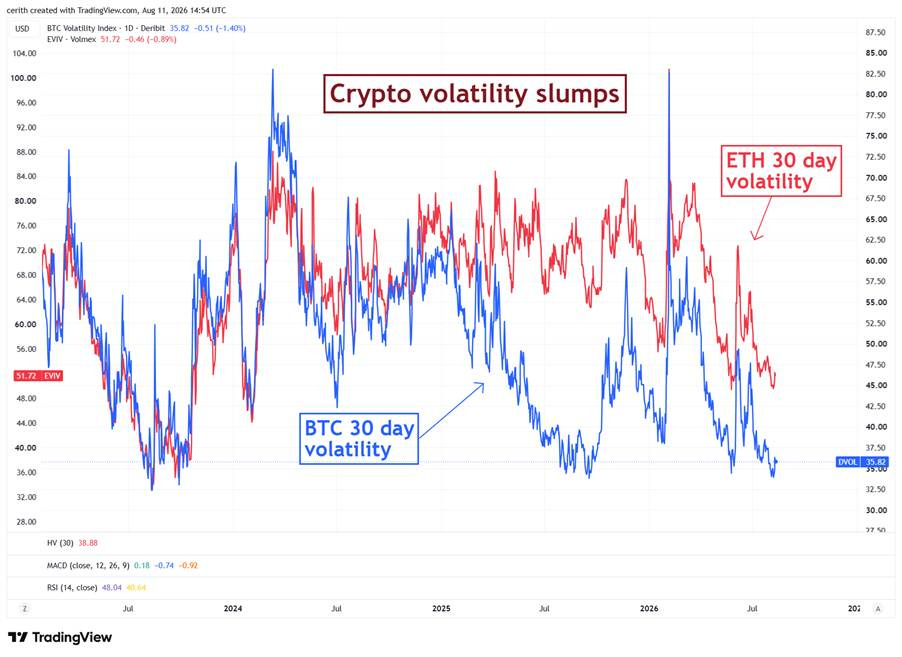
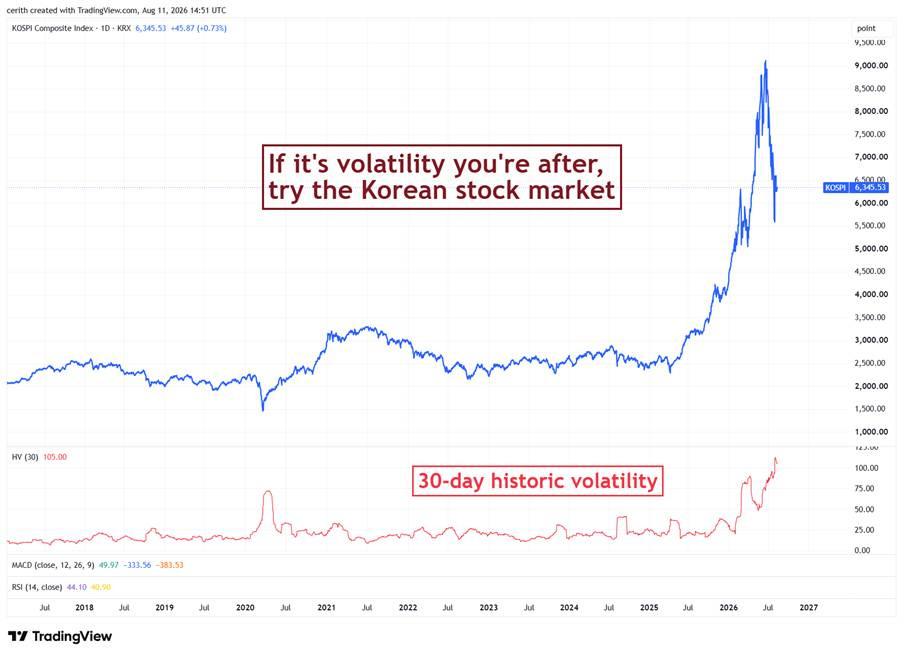
Crypto prices remain subdued, and volatility has collapsed. If it’s volatility you’re after, crypto is not for you at the moment. You want to be in AI stocks.
No more so than in Korea where Samsung Electronics and SK Hynix are bouncing around like rubber balls in a pinball machine. Never a great source of comfort in my experience.
Low volatility environments are normally followed by the next big move. Historically it’s typically been up, as superbly described in this ByteTree note, but it doesn’t have to be.
The red lines on the chart below mark the rare occasions (87 trading days in its history) when BTC 30-day vol has been below 20%. It doesn’t take a genius to see a pattern, and fits with the four year historical cycle. In most cases the next move has been up, in several cases substantially.
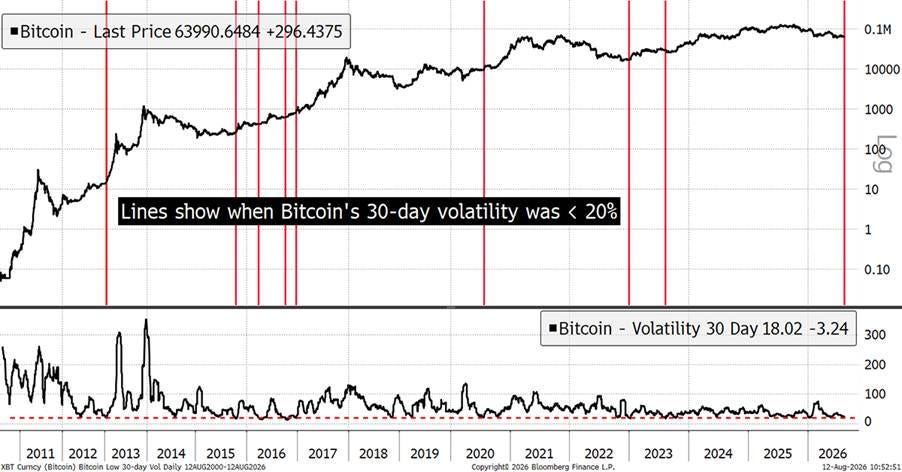
Source: Bytetree
The equity market’s view on crypto seems to have improved over the course of the last month, a possible sign that we’re past peak capitulation.
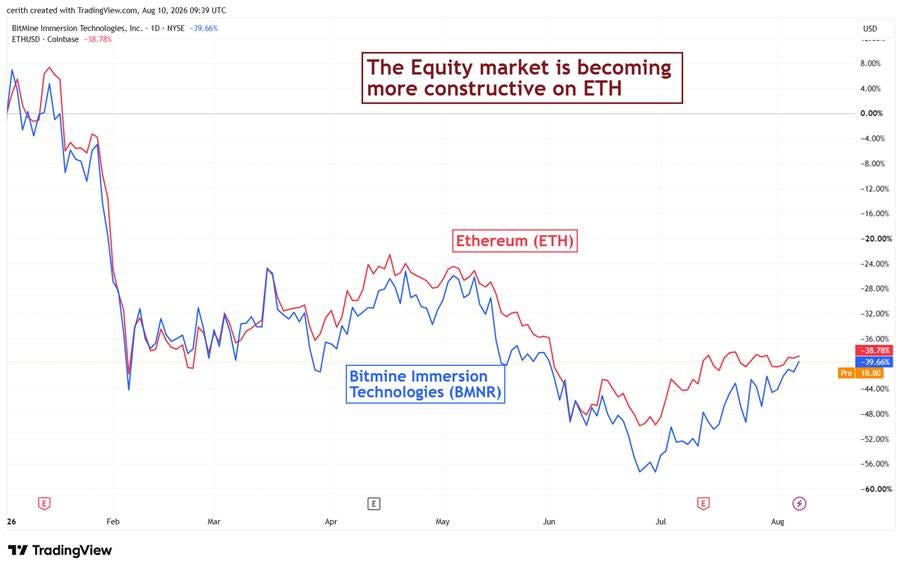
Note how ETH holding company Bitmine Immersion Technologies has outperformed ETH since the end of July.
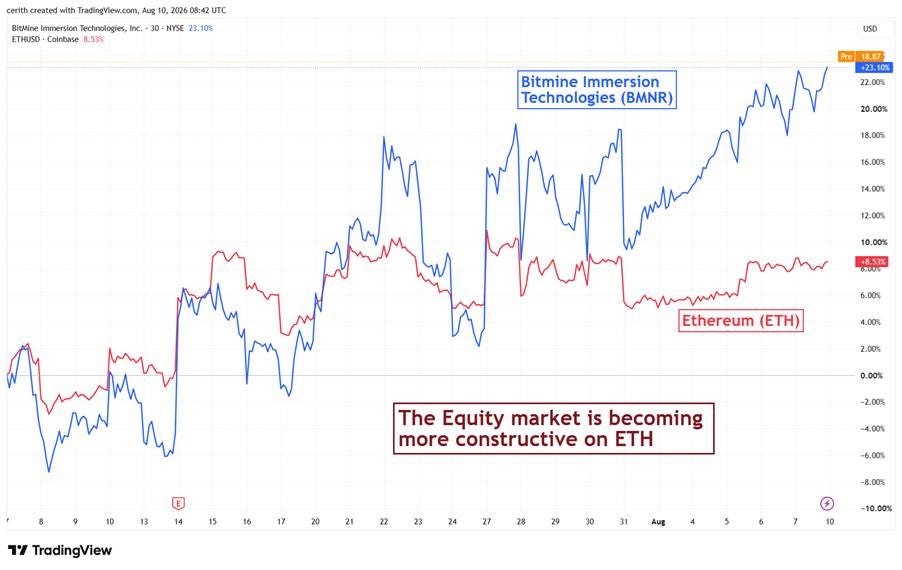
Don’t get too excited. In a broader context, this is a reversal of the underperformance seen in late June/early July, and we only have a very short price history since BMNR only became an ETH holding company in June 2025. But it’s a step in the right direction, and the point we’re making is that sentiment is improving.
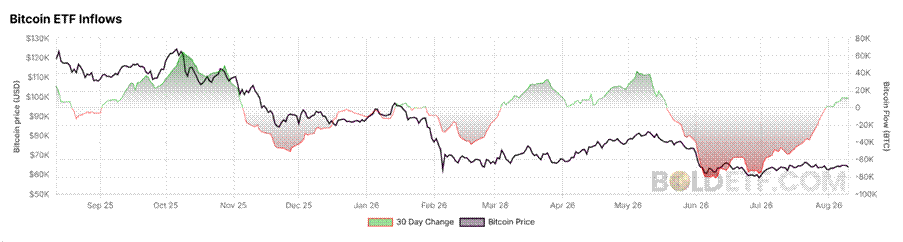
This improvement in appetite has been reflected in Bitcoin ETF flows, which have seen a pick-up over the last month or so.
I like to look at the equity market’s treatment of crypto because equities are typically populated by a longer term mindset.
Let’s see if there is any merit in this.
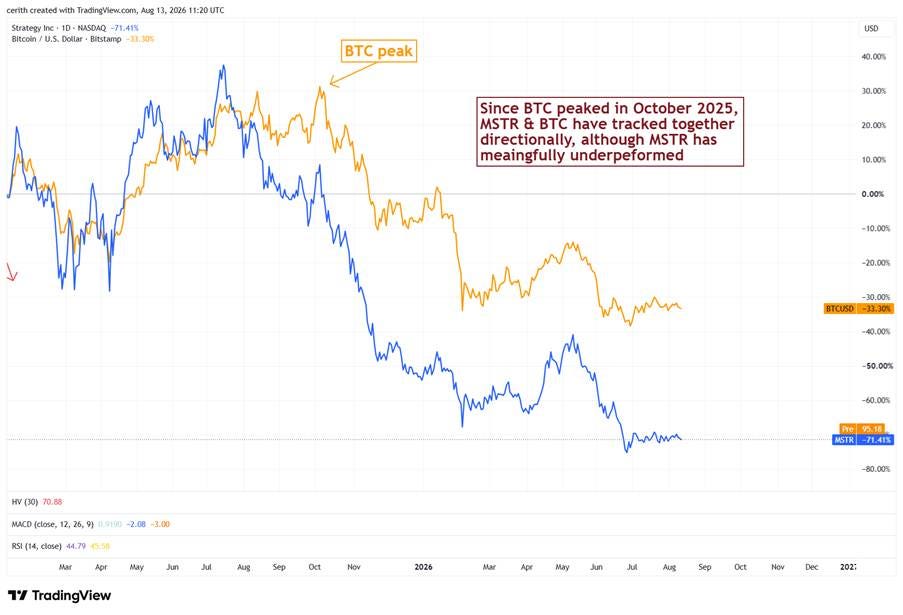
The chart below takes MSTR (Strategy) and compares it to the bitcoin price. Note these are not on the same price scale so all we are trying to do is recognise patterns.
On several occasions over the last six years, a break down (or up) in the MSTR price has been a handy lead indicator for the bitcoin price, with the lead time as much as two months.
The most interesting was the last bull run in autumn 2025. The MSTR share price posts a lower high while the bitcoin price continues to surge. The equity market was selling euphoria.
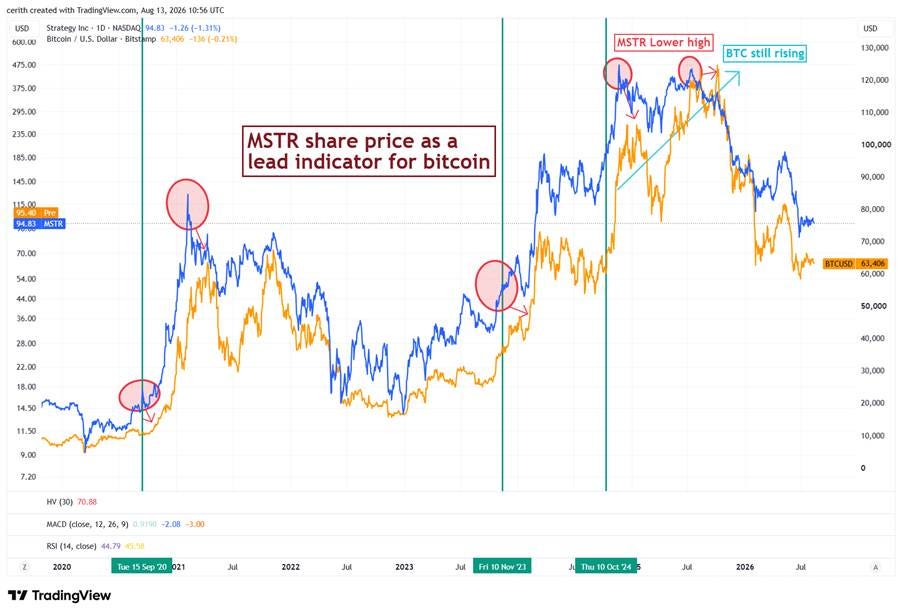
What are we seeing right now? The moves between MSTR and BTC have been largely congruent this year, so on this basis there is no signal from the equity market that we should get bullish on the underlying asset yet.
This is reflected in MSTR’s discount to NAV, which remains at cyclical lows. This could be a reflection of the changed nature of Strategy as a business. Where once it was an ungeared holding company, it now contains a number of separate vehicles with far greater complexity.
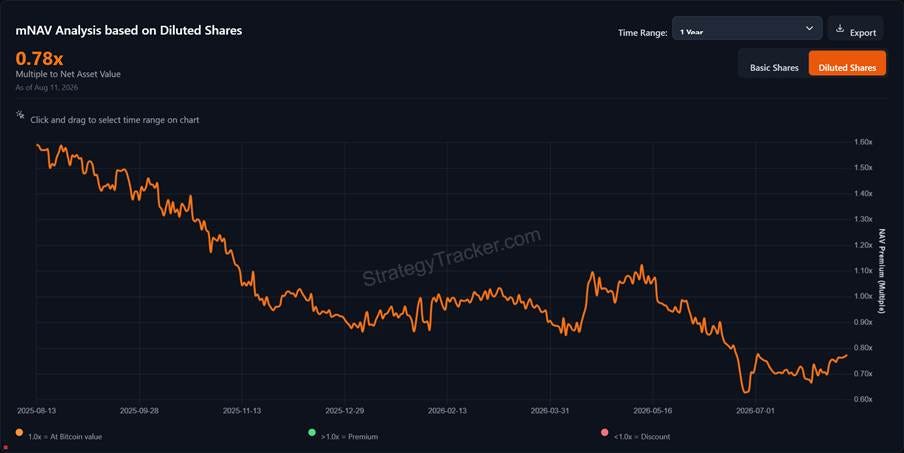
While that in itself is a contrary indicator (Can it go any lower? Is the worst in the price?), it’s a chicken and egg question. Which comes first, the discount narrowing or the BTC price rising? We would err towards the former.
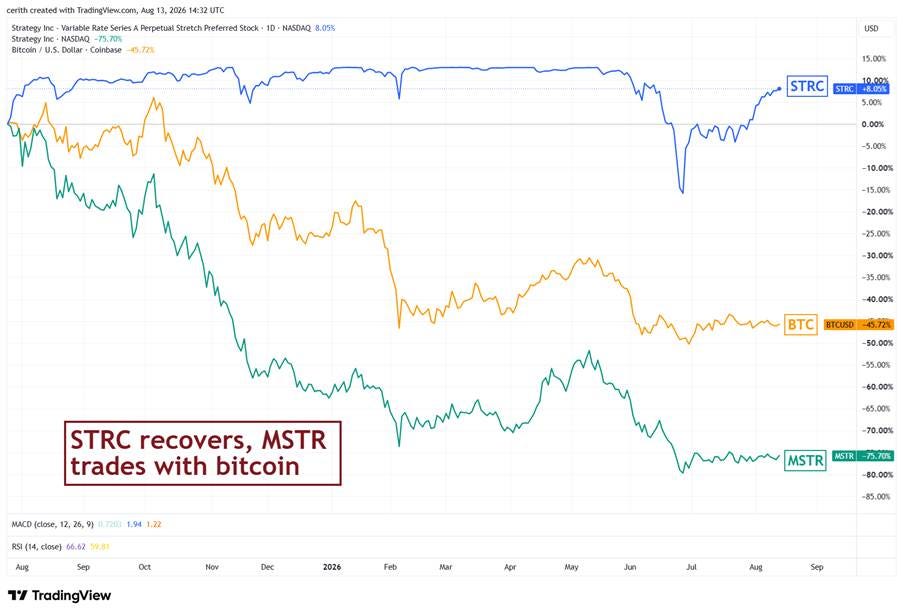
To that end it’s good to see Strategy’s STRC product continue to crawl back to par, much as we expected in our last letter. Indeed, the group has pragmatically continued to sell bitcoin and increase US$ holdings in order to repair investor sentiment.
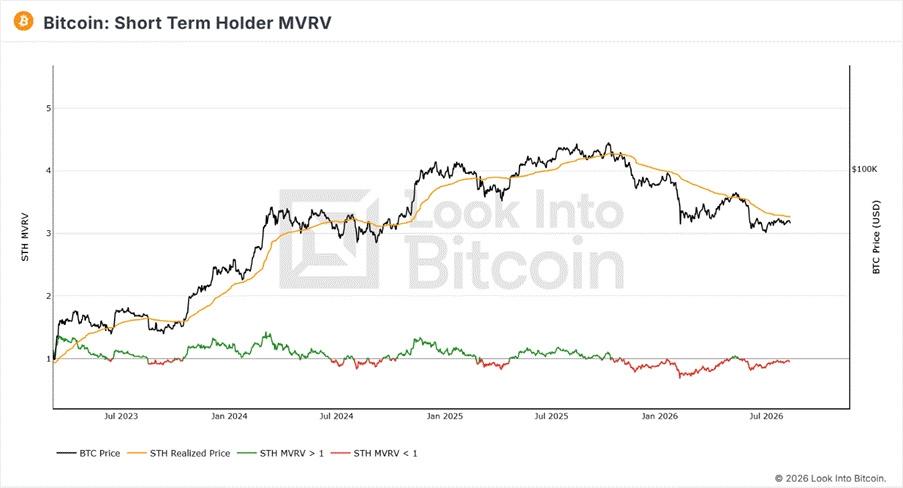
Sentiment is obviously important for a memetic asset such as bitcoin. Confidence tends to rise with underlying price confirmation, which feeds momentum. This is why bitcoin analysts focus on the average price paid by investors. If they are collectively profitable, this is deemed positive, and vice versa.
The MVRV calculations put that in to chart form. The yellow line is the average price paid by bitcoin addresses over the last 155 days (hence “short term”). It’s similar to a moving average. Recently it has formed a line of resistance, and now stands at US$67,147.
We need a meaningful break above the line to change the tide.
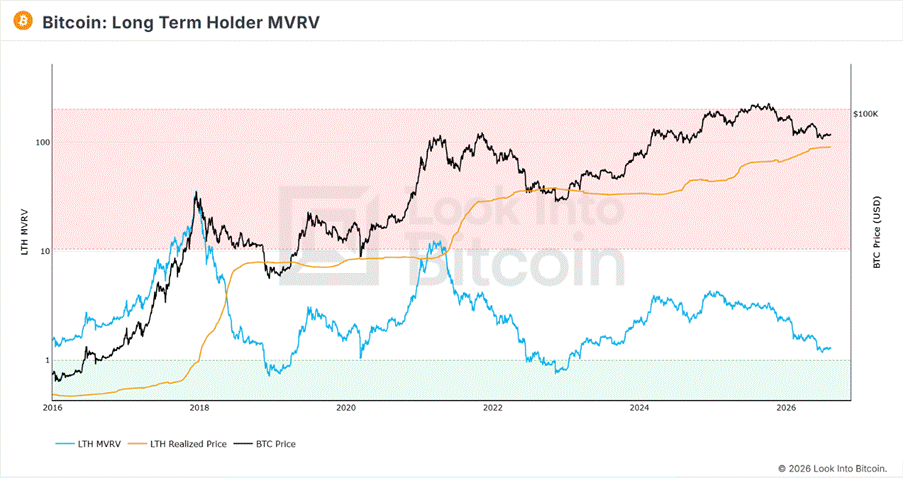
The long term equivalent (chart below) tells the average purchase price of addresses where coins haven’t moved for the last 155 days (i.e. everything else). The price here is US$49,699, which is why US$50,000 is cited in some quarters as the real cycle low.
Our belief is that is unlikely given the greater maturity and lower volatility of the asset. However, in an omnishambles market, or a GFC equivalent, it’s not impossible. As mentioned at the start, equity markets continue to feel brittle, and liquidity conditions are not supportive of high risk assets as we head into the autumn.
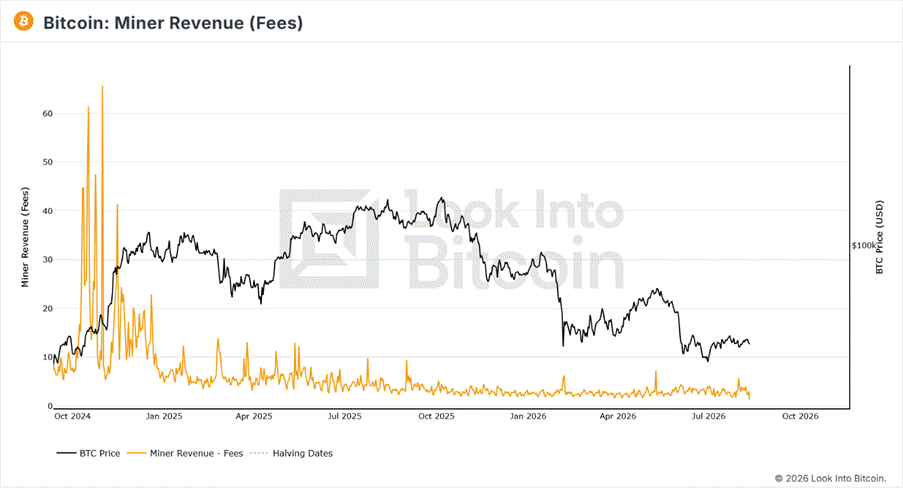
There is no improvement in news as far as fee generation on the bitcoin network is concerned. It remains desultory. On August 11th the bitcoin network generated US$63,500 in fees. This is not enough of a security budget to sustain a global monetary network into the long term, which is bitcoin’s intended destination.
How this isn’t a more prominent issue is beyond us. It’s like the mad aunt – everyone knows about her but she’s never mentioned.
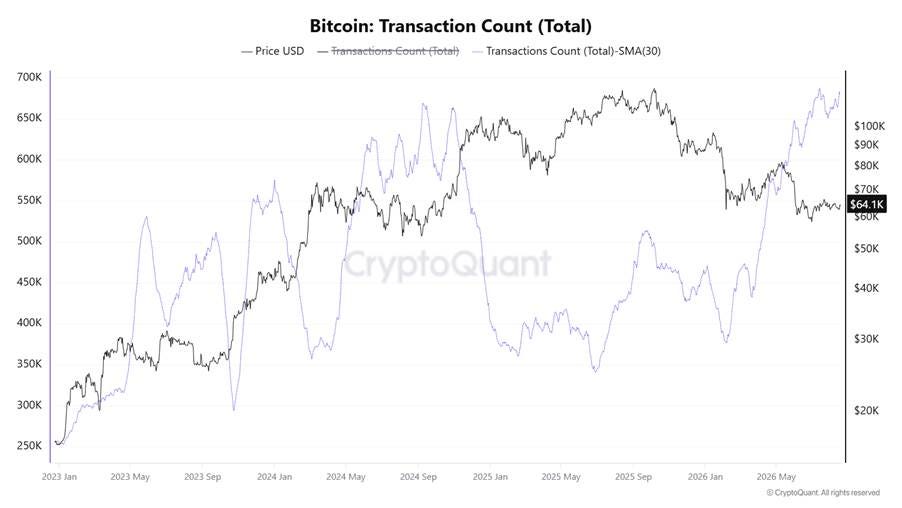
The silver lining is that on-chain activity seems to be picking up in terms of transactions.
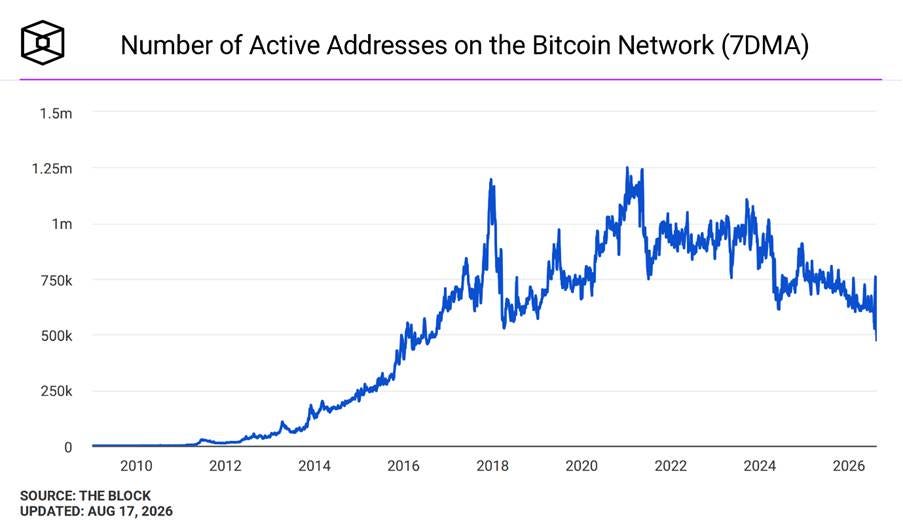
While this appears positive, the reality is that active addresses are declining. This points to more usage from fewer addresses, and much of this will be transactions in “runes” and other “dust”-like instruments. Hence the low fees generated. Maybe this is R&D for greater AI payments activity. We will find out in due course.
Ethereum network revenue is also running at low levels, but we’d caution against reading that as the same story. Bitcoin’s trouble is that so little is going on. Fees are low because the network is quiet.
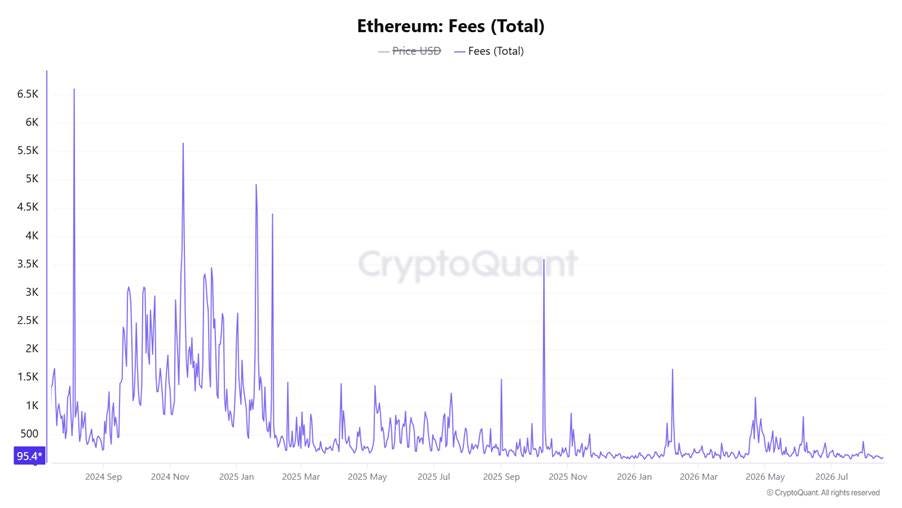
Ethereum is the opposite. Transactions are climbing as the fee declines. Revenue is down because the network has become cheaper to use, not because people have stopped using it. More going on, less paid for each piece of it.
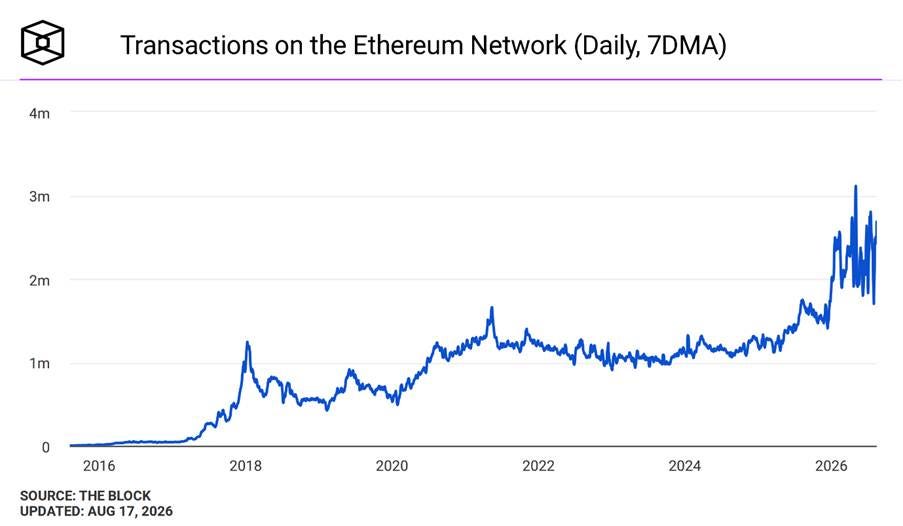
Most of this infrastructure is in a race to the bottom on fees. It’s meant to get cheaper. The roadmaps say so in plain terms, and every competitor is pushing in the same direction. So the base layers come to capture less and less of the value passing over them, however much the usage grows.
That, in a nutshell, is why we spend our time further up the stack, among the applications and networks that keep a margin on what they do, rather than on the settlement layers busily competing to give theirs away.
Falling Ethereum revenue set against rising Ethereum usage is not bearish for us. It is what we expect. It is the base layer for a huge amount of activity that ultimately settles onto it, activity that is not captured in the daily fees but would not be possible without it. Ethereum is by far the most decentralised blockchain and as a result it will dominate the value locked in the system.
It is what qualifies it as a durable monetary asset.
We have covered World Mobile’s two-layer network before. The story since has only improved.
The Philippines
World Mobile keeps following the same playbook: find places where the economy is moving faster than the infrastructure serving it, then plug the gap. The Philippines is the latest.
It is the largest tourism economy in ASEAN, contributing $91.8bn to the national GDP in 2025, with hotels and restaurants among its highest value-adding sectors, forecast to grow around 5% this year, the second-fastest pace in ASEAN behind Vietnam. It is also poorly served: Manila ranks among the worst capitals in Asia-Pacific for mobile reliability, and national speeds still trail the region despite near-universal 4G coverage. Thriving demand, poor supply. That gap is the whole thesis.
World Mobile has just moved into it. On 29 July, it opened Frontier Drop One, its first AirNodes built for a live commercial rollout in the country, and every tier sold out. The design is the point: each Frontier node is tied to a specific customer location, deployed on the ground by Community Wi-Fi Corporation, and pays its operator nothing until that customer’s service is actually running. Rewards follow real subscribers, not speculative coverage. There are already 724 active nodes in the country.
Staking
Staking has also deepened, and it now rewards commitment. Locked Staking went live on Base and Cardano, alongside the existing Core Staking. Instead of an open-ended position, you fix a term of three, six, nine or twelve months and the rate is written onchain at the moment you stake, held for the duration. Three months locks in 5.50%, rising to 6% at six months, 8% at nine, and 10% at twelve. A longer-duration sink for the token ahead of World Mobile Chain mainnet, and holders are paid more the longer they’re willing to wait.
Usage
And the chain is being used. On Token Terminal’s daily-active-users measure, World Mobile Chain now sits third among all chains in crypto. Ahead of Solana and behind only Tron and BNB. The figure counts telecom subscribers transacting on the network. That is the part worth sitting with: this is usage from people paying for connectivity, not wallets farming an airdrop.
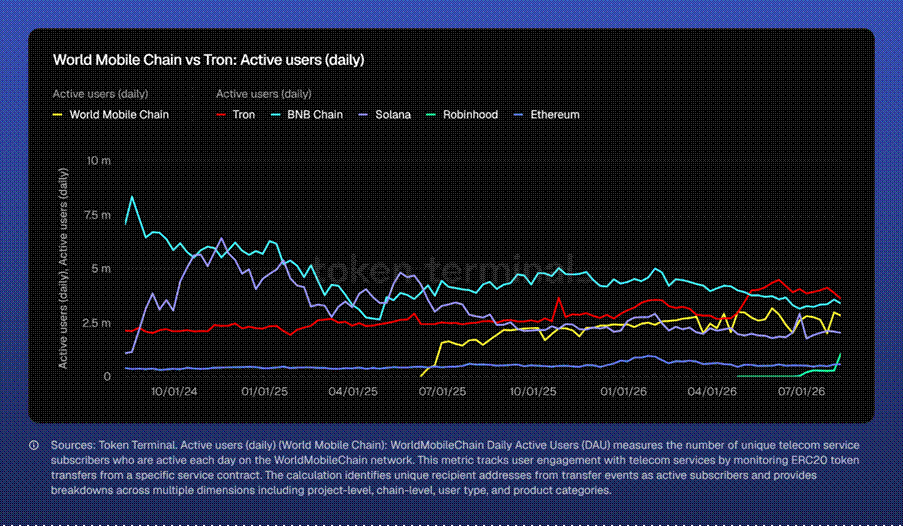
Usage is increasing, the rewards are tracking it, and the runway is lengthening.
Uniswap spent seven years not charging for a thing. That changed in December, when the UNIfication vote turned on protocol fees for v2 and v3 pools and pointed the proceeds at a UNI burn.
On 27 July, Proposal 100 passed unanimously and protocol fees are now live on v4 pools across seven chains, including Ethereum, Arbitrum, Base and Robinhood Chain. V4 is the largest version by volume. Until three weeks ago it contributed nothing to the burn.
We ran the numbers when the proposal went up, assumed it would pass, and took a position on what we found. The picture since activation looks even better than what we modelled.
The maths
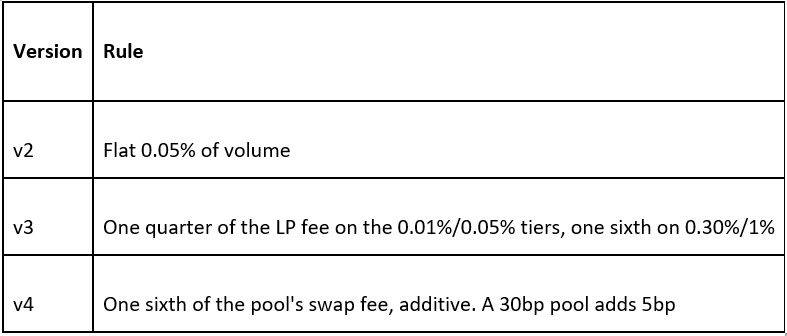
Applied to the 100 largest pools in each version, weighted by volume, that blends to v2: 5.00 bps, v3: 2.00 bps, v4: 0.45 bps. Our v4 rate is conservative if anything: the top 100 v4 pools are dominated by ultra-low-fee stablecoin pairs charging as little as 0.0005%, which move enormous size for almost no fee.
Against those rates, governance releases 20 million UNI a year from treasury as a growth budget. Burn minus budget is the new story.
Apply the blended rates to July’s actual volume split ($2.1bn v2, $24.6bn v3, $26.3bn v4) and the protocol earns $86m annualised, burning 21.7 million UNI. Against the 20 million budget, that’s already a surplus: about 1.7 million UNI, roughly 0.27% of supply, retired net every year. Before v4 activated, on v2 and v3 alone, UNI was inflating outright. It is now net deflationary, for the first time in its history, and every additional pool or chain that gets the fee switch widens the gap further.
What happens with higher volume
The burn is a direct function of trading volume. 2025 was Uniswap’s biggest year on record at $1.022 trillion. Today’s run-rate, annualising July, is already 62% of that.
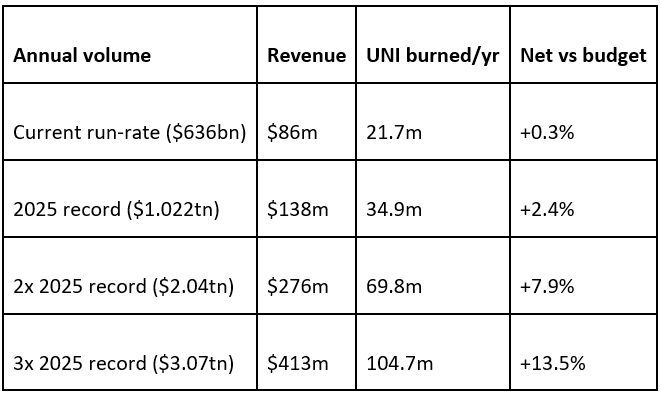
That 62% run-rate is showing up in the depths of a bear market. Usage and price have decoupled: the volume doesn’t need the token to be euphoric to show up.
Adding to this is the Robinhood Chain, which did $7bn of Uniswap volume in July, becoming the 2nd largest contributor behind Ethereum after being live for just 2 months. We expect this figure to contribute a larger share of Uniswap’s volume in the years to come. Layer in the wave of real-world assets moving on-chain that we covered in our recent webinar (which you can watch here), all of which need somewhere to trade, and two to three times an all-time year stops looking far-fetched.
At three times 2025’s volume, the burn retires 13.5% of UNI’s supply in a single year. An asset facilitating that much trading and destroying that much of its own supply is, on its own terms, an argument for a re-rate.
Having been critics of Uniswap in the past, we’re thrilled that the largest DEX in DeFi is now addressing its tokenomics issues, and hope other projects begin to follow suit.
We have made the case in these pages that AI will herald a deflationary shock. The idea being that the new technology will enable businesses and governments to materially cut costs, and boost productivity and growth. That would be a headwind for hard money assets such as gold and bitcoin.
This piece of research argues otherwise.

Whitney Baker@TotemMacro
On a one-off basis, a recent explainer. Originally published July 7th, 2026. See important disclosures & disclaimers. info@totemmacro.com https://t.co/H8JNNzzQH9
12:01 PM · Aug 6, 2026 · 163K Views
44 Replies · 54 Reposts · 370 Likes
It’s worth reading in full but the gist is that the “bonfire of cash” has a crowding out effect and takes resources from other parts of the economy (classic misallocation of capital), and will not bring down the prices of everyday goods. I’ve pulled out some chunks below.
What gets built eventually gets used, but not before tight capacity stokes inflation, erodes real income, contracts liquidity, and the bubble collapses into recession.
It’s not mechanically possible for AI to scale returns as priced in, over the priced-in timeline. We’re not asserting this as mere opinion – it’s inescapable because at the end of the cycle, available (physical) resources are depleted, no matter how many dollars are printed or borrowed. Further spending simply creates inflation, keeps rates up, and squeezes real income. This explains the memory and broader commodity price moves. Every dollar of AI spending in this zero-sum situation crowds out a dollar of potential demand one-for-one. So AI will accelerate the recession before it can generate revenue, because AI-related activity is smothering its own potential customers. Normally, capex aims to increase the supply of things already in strong demand, thereby alleviating economic tightness down the road. But emerged out of a weak economy…and isn’t responding to any demand signal at all (which is why none of it is financed out of revenue). It isn’t building any physical supply of goods or commodities to increase economic runway – just compute. And most of the spending flows abroad, via imports. So it crowds out domestic income and ships it to other economies. In other words, it’s currently a net drain and a productivity drag, which is why it’s also inflationary, not deflationary. So it’s a no from us on the “deflationary productivity boom” narrative. There’s no capex on the horizon that will bring down the cost of real tangible things, so it’s hard to see how non-inflationary demand returns.
This is obviously important from the perspective of thinking about gold and bitcoin, and reinforces the argument for a portfolio allocation. Indeed it is interesting that as the AI bubble gets long in the tooth, we have seen gold and precious metals start to move higher again.
Gold Leads Bitcoin In A Bull, Lags In A Bear
It’s worth examining the historical price relationship between gold and bitcoin in this context.
It seems from the chart below that gold has recently been a leading indicator for bitcoin in a bull market, while bitcoin is a leading indicator for gold in a sell-off. Bitcoin behaves suddenly and violently, while gold tracks more steadily, as you’d expect.
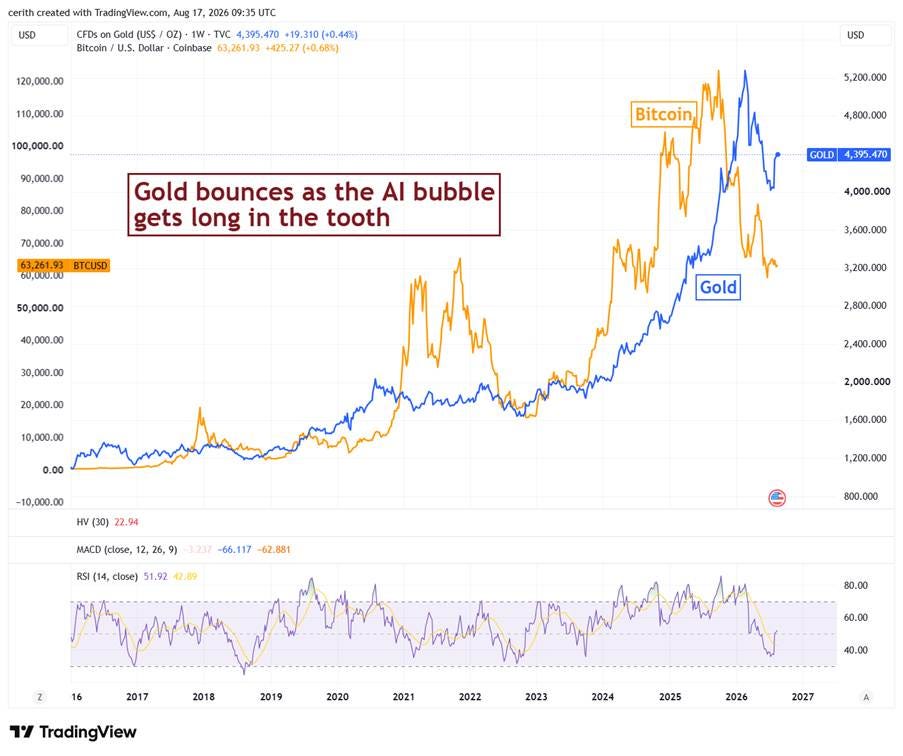
In 2020 gold peaks just as BTC starts to run hot. Meanwhile BTC’s 2021 peak runs a few months ahead of gold’s peak. Similarly gold bases a couple of months before bitcoin in 2022, while bitcoin’s correction in 2025 precedes gold’s by six months.
A sustained run in gold, therefore, bodes well for bitcoin, but it might not happen immediately.
Heading back to inflation, a quick look at the food chain. One of the things that will cause serious political and economic problems is if we see prices of basic foodstuffs start to move higher.
As a Suffolk boy, I can tell you that the harvest here has been dreadful. Poor quality, low yields. While that’s not a guide for global prices, indicators elsewhere give cause to believe that the direction is higher.
Firstly, input costs continue to rise. Second, military strikes on port infrastructure and shipping are curtailing Ukrainian exports. Elsewhere, generally speaking, price stability seems to be a function more of a drawdown in inventory than a rise in production. The August WASDE report is our source.
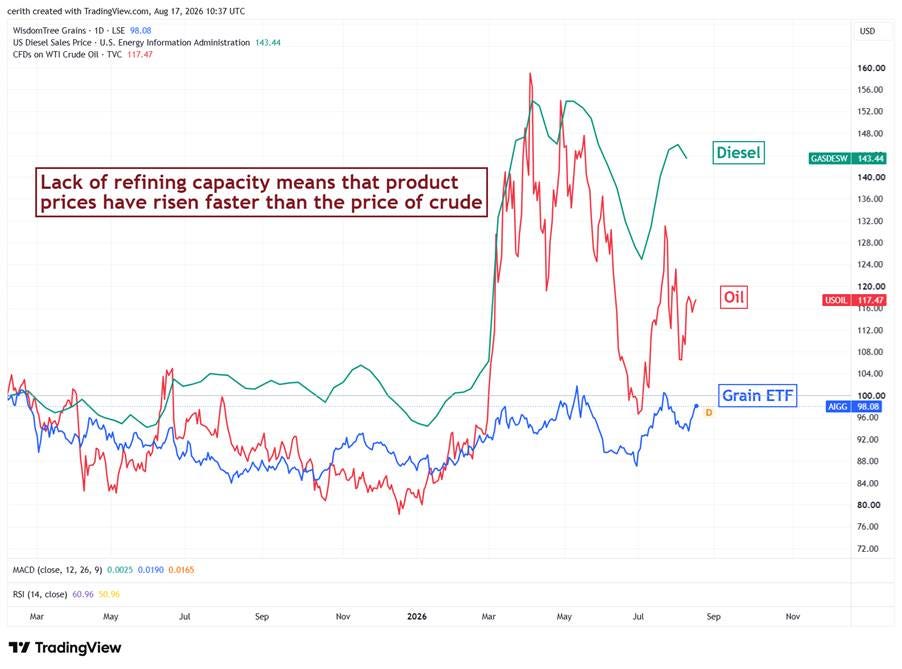
At the base of the chain is the oil price, which has stepped higher since the outbreak.
But farmers don’t use crude oil. They (typically) use diesel, which is a crude oil by-product. Furthermore, their input costs, which include chemicals and fertilisers, are also driven by the price of crude oil by-products. The price of these by-products is driven in part by the crude oil price, but more notably by the availability of refining capacity.
Over the last couple of decades there hasn’t been much in the way of new investment into refining capacity (another example of misallocation of capital). This is been driven largely by the green agenda (conversion to biofuels/renewable investments etc) and latterly by the conflict related destruction of facilities in Russia and the Middle East.
It’s interesting therefore to take a simple look at the recent price behaviour of these inputs against a grain ETF (in this case AIGG).
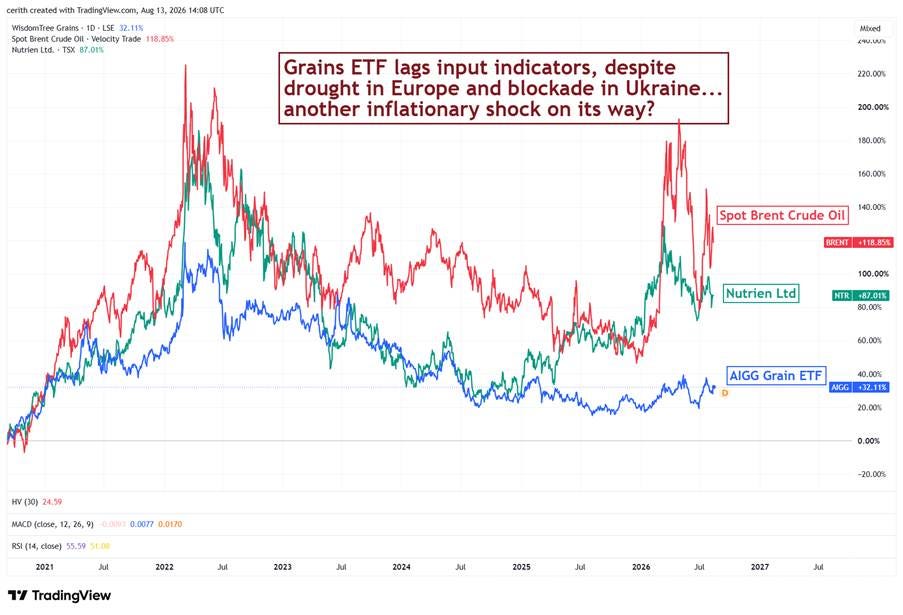
The next chat shows the grain ETF against the share price of one of the largest global fertiliser companies, Nutrien (NTR). It has been steadily rising since mid-2025, which in a cyclical industry points to continually rising prices.
At some point, one would imagine that either the input costs reverse, or food prices rise.
The main reason for worrying about the outlook for crypto prices doesn’t come from within crypto.
Developments in Japan have the look of something big about to happen.
We have shown variations of the chart below several times over the last year or so. It shows the dollar/yen cross rate compares to the differential between US and Japanese sovereign bond yields. Historically there has been a tight fit, as capital flows to where it can make a higher return.
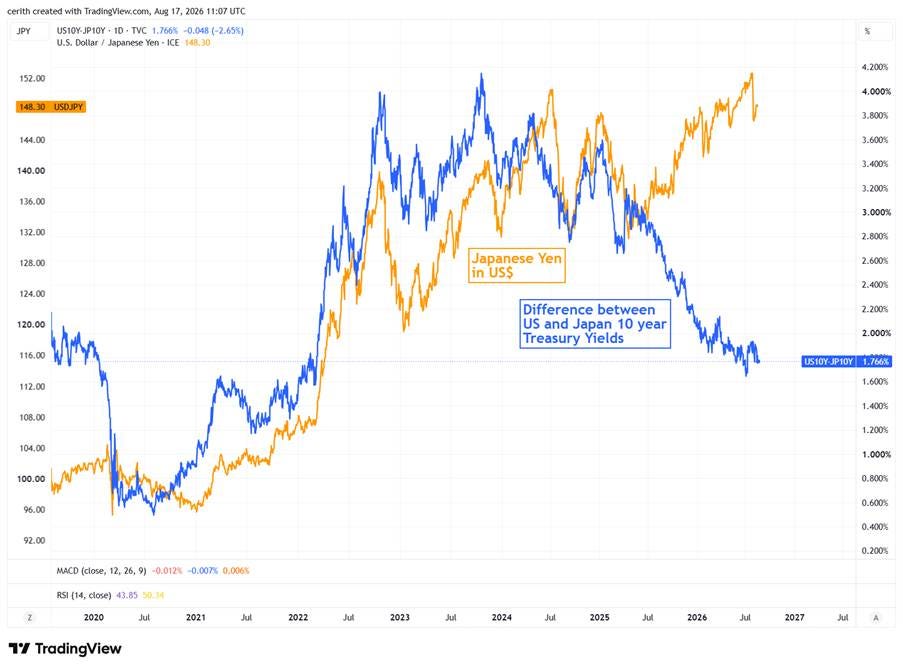
However, that relationship broke in the middle of 2025. Japan’s 10-year yields have continued to rise at a faster pace than their US equivalent.
Yet the Yen has continued to weaken. The market is indicating that the relative returns available for owning Japanese debt is still not great enough. Hence bond yields continue to rise.
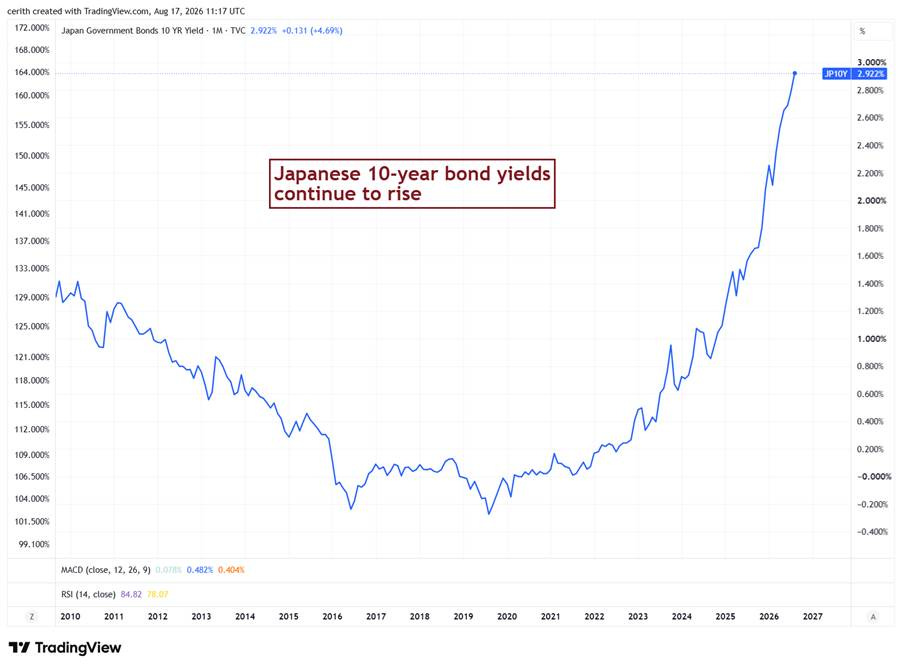
How does this resolve? We have to ask whether the relationship between the currency and rate differentials is actually broken, or whether it is a tightening spring. If it’s broken, it suggests Japan is heading for some sort of sovereign debt crisis. Not good for anyone.
That said, it’s worth pointing out that while Japan’s government debt/GDP is at 250% or so, her net debt position is around 140%. Japan is a massive holder of foreign assets. It’s still a high number (US ~95-100%, the UK ~85-90%) but looks more like Italy than Zimbabwe.
If the relationship is not broken, the resolution must be one of two things: a closing of the rate differential or a strengthening of the Yen.
The rate differential can close in one of two ways from here: US sovereign yields come down, or Japanese yields continue to rise. If AI is not going to produce a deflationary shock (as discussed earlier), then we are unlikely to see the former. So continued domestic bond yield appreciation seems the most likely outcome.
This is likely until we hit the trigger point of Japanese institutions preferring the risk/reward of generating required returns in their domestic currency. At which point they will be motivated to sell foreign assets and invest domestically.
What is that required rate? I’m not an expert here (if any readers would like to kick back on this I’d love to hear) but according to Gemini, the Government Pension fund requires a real annual return of wage growth + 1.7%, which (assuming wages grow by 1-1.5%) translates into a required nominal rate of somewhere between 2.7-3.2%.
The 10-year Japanese bond yield now generates 2.9%, as shown on the earlier graph. So we’re arriving. This must be forcing Japanese asset allocators to sharpen their pencils, and consider greater domestic bond allocation.
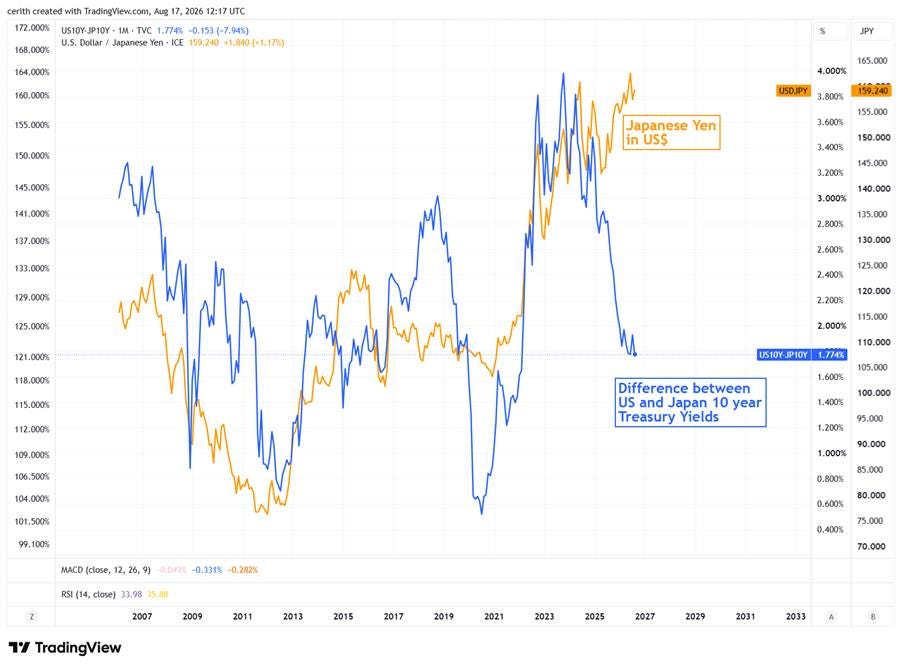
This would have a striking impact. As the graph below suggests, there is massive room for the Yen to strengthen (which would be mildly disinflationary, given she imports 85% of her energy requirements).
Simultaneously, it would put pressure on the assets that they have to sell to repatriate funds, most obviously US treasuries. Presumably, that would put upward pressure on US treasury yields as a key buyer reduces demand.
It’s a fascinating scenario playing out, albeit not one without a great deal of risk. That comes mainly in the form of financial disruption or policy missteps.
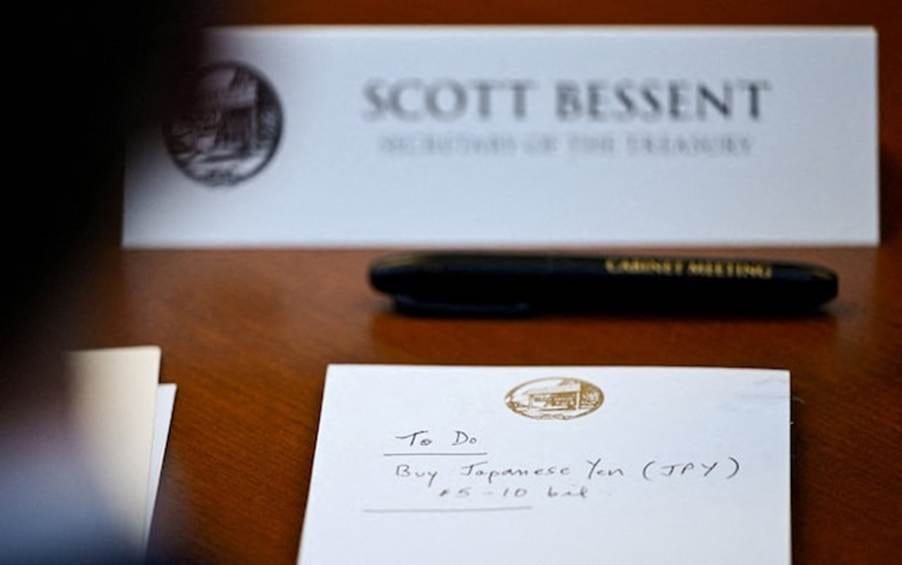
Scott Bessent’s intervention the other day to support the Yen (by selling Euros) is interesting in this context, particularly since the Yen’s weakness has been steady rather than disorderly (which is generally when you’d expect central banks to get involved). He might be working in the best interests of global financial markets, or maybe the old trader in him is simply pointing out what’s going to happen next.
If you wish to begin receiving fund materials and hear more about our process, then please complete the self-certification form by clicking the link below
Thanks for reading CHAINLETTER!
This post is public so feel free to share it.
Comments
Nothing yet. Say the first thing.
Sign in to join the conversation.