
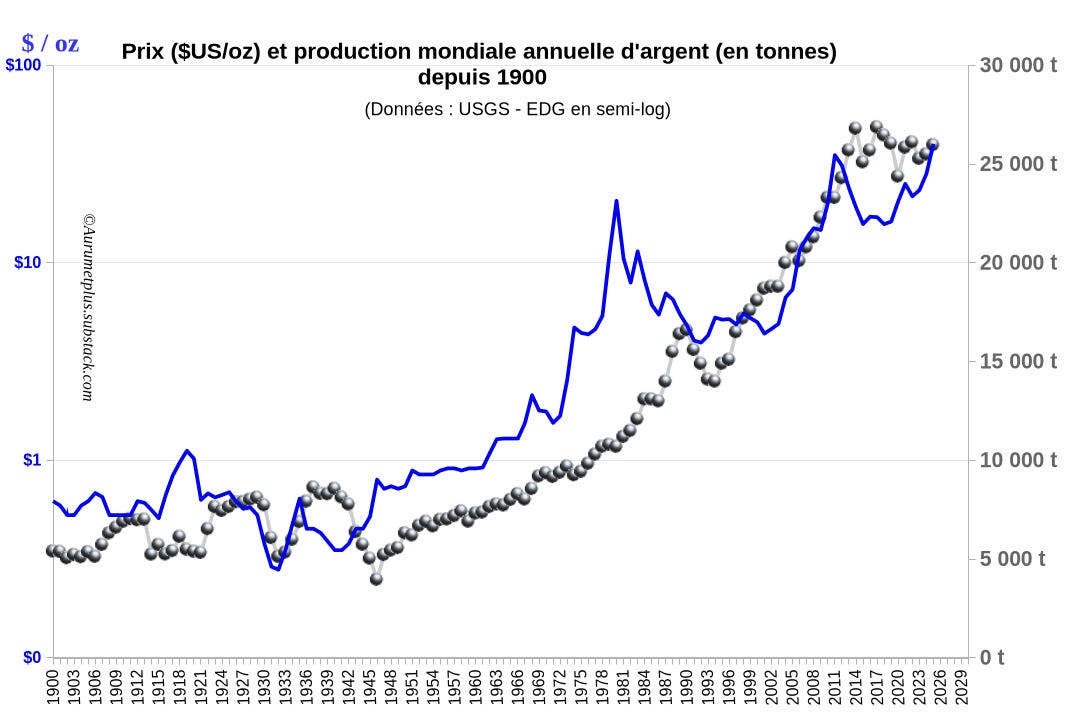
Ce première graphique met en parallèle la production minière annuelle d’argent au niveau mondial et le prix annuel moyen au marché de ce métal, depuis 1900. Les données s’arrêtent à l’année 2025 et donc le graphique ne prend pas compte de la hausse importante du prix en 2026.
Comments
Nothing yet. Say the first thing.
Sign in to join the conversation.