
A striking correlation between today’s US CPI trajectory and the 1970s inflation cycle points to a second, larger wave ahead. Gold peaked five months before CPI in 1980. If history rhymes, maximum velocity in this gold bull market is still in front of us.
We lay out the framework, the numbers, and what it means for our positioning.
A 1970s CPI Parallel Suggests Gold’s Strongest Phase May Still Lie Ahead
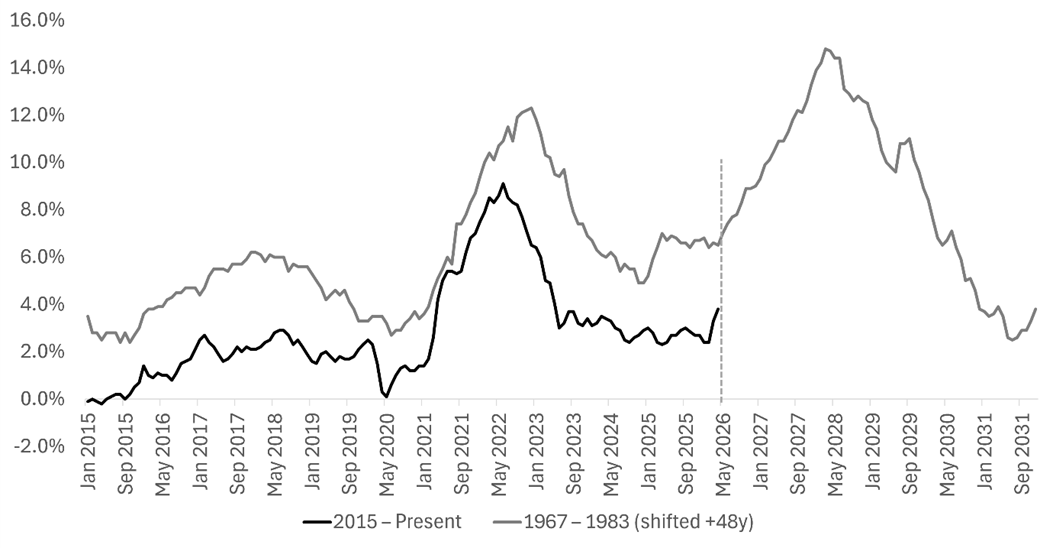
A striking chart by Kobeissi Letter shows the evolution of CPI inflation in the US from 2015 until today and overlays it against its evolution from 1967 until 1978.
US CPI YoY: 2015–Present vs 1967–1983 overlay
Source: Adapted from Kobeissi Letter, BLS
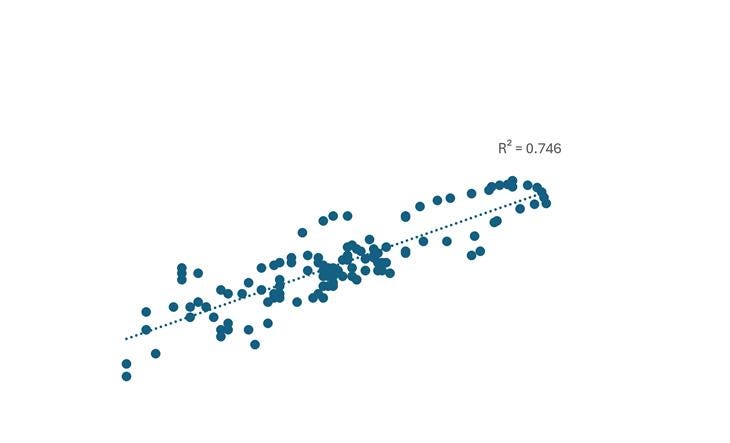
The relationship between both periods is striking, and something we had overlooked. We have estimated the R2 at 75%.
Regression 1967-1978 US CPI inflation vs CPI 2015-present, monthly (Log-log )
Source: Asymmetric Research, BLS
We had believed for some time that inflation was going to re-accelerate, and our base case was that we were likely in the early stages of a 1970s analogy, one reinforced by the Iran conflict, which struck us as a clear parallel to the 1973 oil embargo. But what if that’s the wrong starting point? What if, having already lived through the first big inflation wave four to five years ago, we are now effectively in June 1978: staring at an even larger inflation surge ahead of us.
Comments
Nothing yet. Say the first thing.
Sign in to join the conversation.