
Chasing Alpha Weekly drops every Sunday. I break down the macro signals, sector rotations, and specific trade setups I’m watching for the week ahead. If you’re new here — subscribe below so you don’t miss it.
The single greatest mistake traders make is looking at a chart and telling it what it’s going to do instead of trading what’s actually happening.
I saw a lot of that this week. $SPY broke out of a clean bull flag and people are still calling it a top. A proprietary breadth indicator I’ve used for years just fired a buy signal on semiconductors that has only triggered three times in 27 years of trading. And $SNDK got 16 firms raising price targets in a single 24-hour window.
This week I want to walk you through the framework for trading what’s in front of you — plus a full technical and fundamental teardown of $SNDK that you can apply to any name. Let’s get into it.
$SPY breaks out of a bull flag — only 2.4% off recent highs
$SNDK gets 16 firms raising price targets in a single day — range now $1,400-$3,600
Breadth broadly strong — biotech, financials, and even defensive sectors all at all-time highs
$MU closes back above its 55-day for the first time, 1222 cross confirming
Semiconductor breadth indicator fires a buy signal — only the 3rd time it’s triggered in years
13F filings show Berkshire and Third Point both added significantly to $GOOGL
USD/JPY — US intervened to stop the bleed, worth monitoring but not panicking over
30-year yield sitting at 5.26% — elevated but historically not the market killer people think
Software showing early signs of getting toppy after a strong run
Nothing structurally broken — this is rotation and consolidation, not distribution
The index is telling you a clear story. Most people are refusing to listen to it.
Let me start with the framework because I think it’s the most valuable thing in this entire post.
$SPY closed a flag and broke out of it. Not an opinion — a fact you can look at on any chart. It’s currently only 2.4% off its highs. If your thesis is that this comes back down, your actual thesis has to be that earnings cannot sustain themselves. There is zero evidence of that right now. Semiconductor earnings growth is the strongest I have seen in 27 years of trading.
Compare this to 1998-2000. The 30-year yield ran from roughly 4.85% to 6.7% during that stretch — the single greatest bond market move in modern history — and the equity market still ripped through it because the growth story was that strong. We’re sitting at 5.26% right now. Historically, that alone does not kill a rally with real earnings behind it.
You have more growth in this market and in semiconductors right now than any time in 27 years of trading. To think you can’t sustain an equity rally with a 5.26% yield is simply not looking at history.
Here’s the part that matters most: when the data disagrees with your narrative, the data wins. Michael Burry covered his semiconductor short and flipped to a NASDAQ short instead. From a technical standpoint, that’s late. It doesn’t mean he’s wrong on timing over a longer horizon — but “eventually” and “now” are two completely different trades. When is everything in this business.
I run a proprietary breadth indicator on the semiconductor sector that I built specifically to strip out noise and give me a clean 0-100 read on internal sector strength.
It just fired a buy signal.
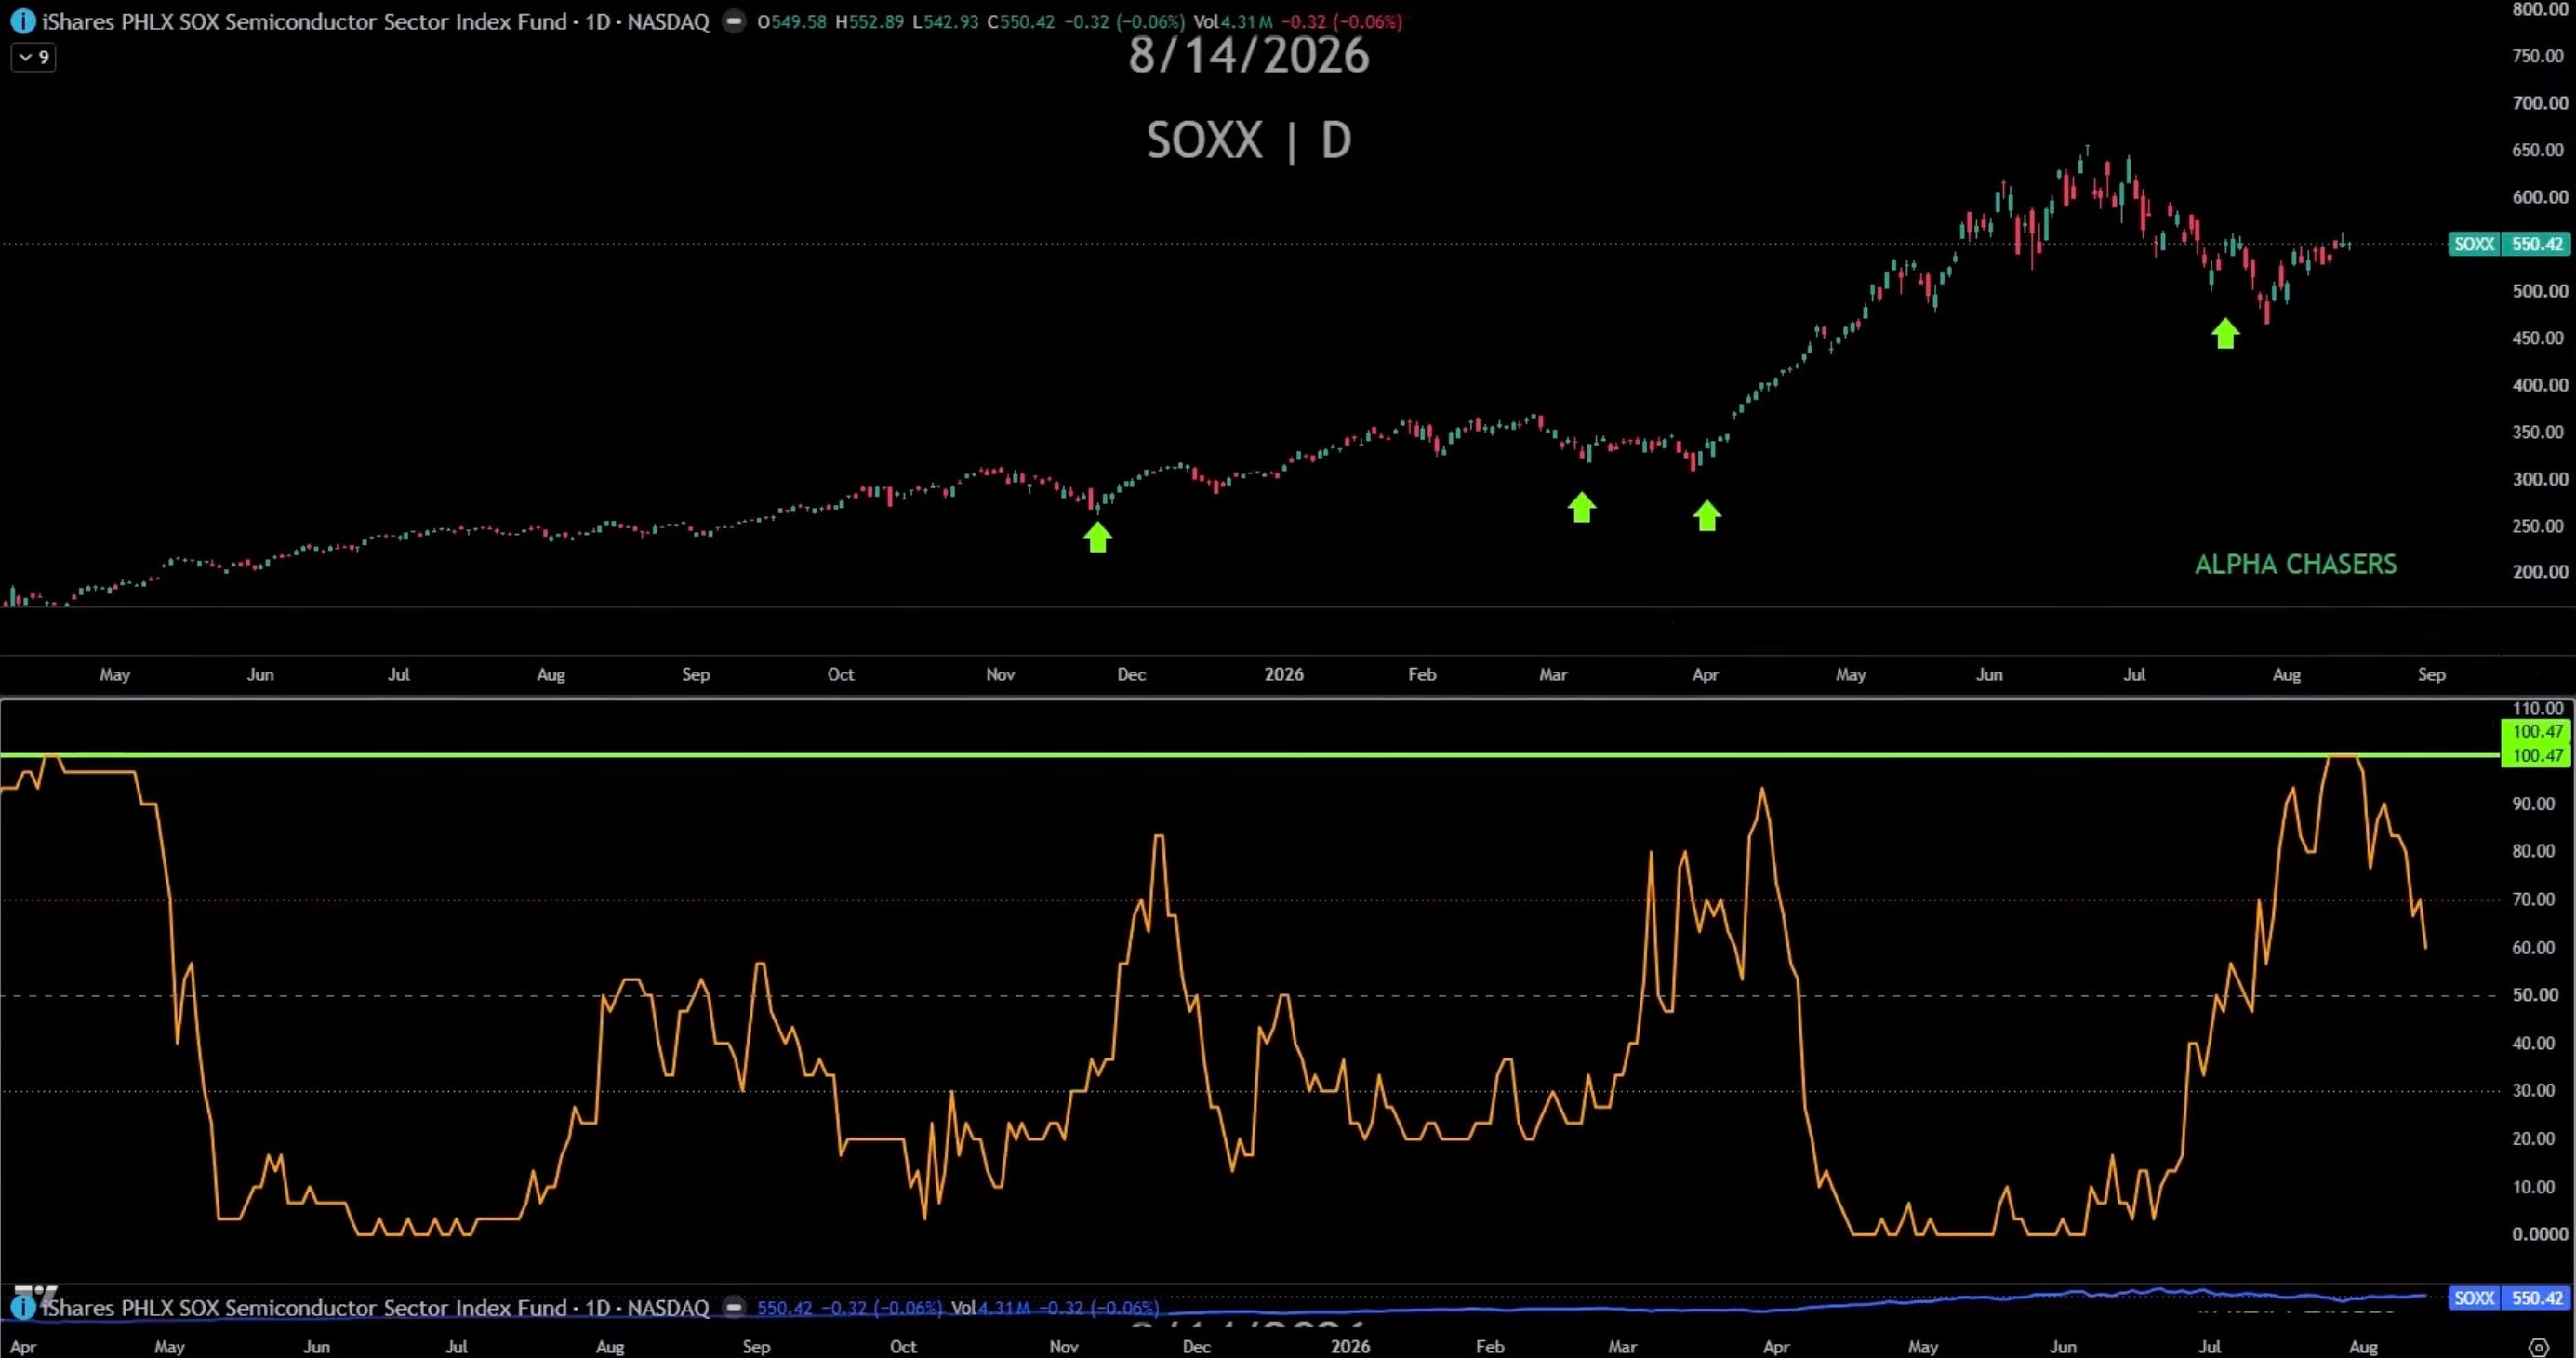
This is not a common occurrence. Going back through the data, this indicator has only triggered at genuinely extreme levels a handful of times: August 2024, right before the “winning and liberation” rally, and now. That’s it. Three times.
Extreme readings like this — where the sector has been beaten down to a level rarely seen — have historically marked the end of selling pressure, not the beginning of further declines. It doesn’t fix an existing downtrend overnight and it doesn’t tell you which individual names to buy. But it tells you where you are in the broader cycle.
And this is confirmed by broader market breadth too. $IBB is at all-time highs. Financials are at all-time highs. Even defensive sectors like $XLP and $XLV are at highs. When literally every sector is participating simultaneously, that is broad-based strength — not a market on the verge of collapse.
When you get extreme readings like this, you have to listen to them even when they conflict with the narrative everyone else is repeating on social media.
Enjoying this so far? Chasing Alpha Weekly goes out every Sunday. Subscribe below so you never miss a week.
I want to use $SNDK this week to show you exactly how I tear a stock apart, because it’s the question I get asked most often: how do you actually combine technical and fundamental analysis into one process?
The technical setup:
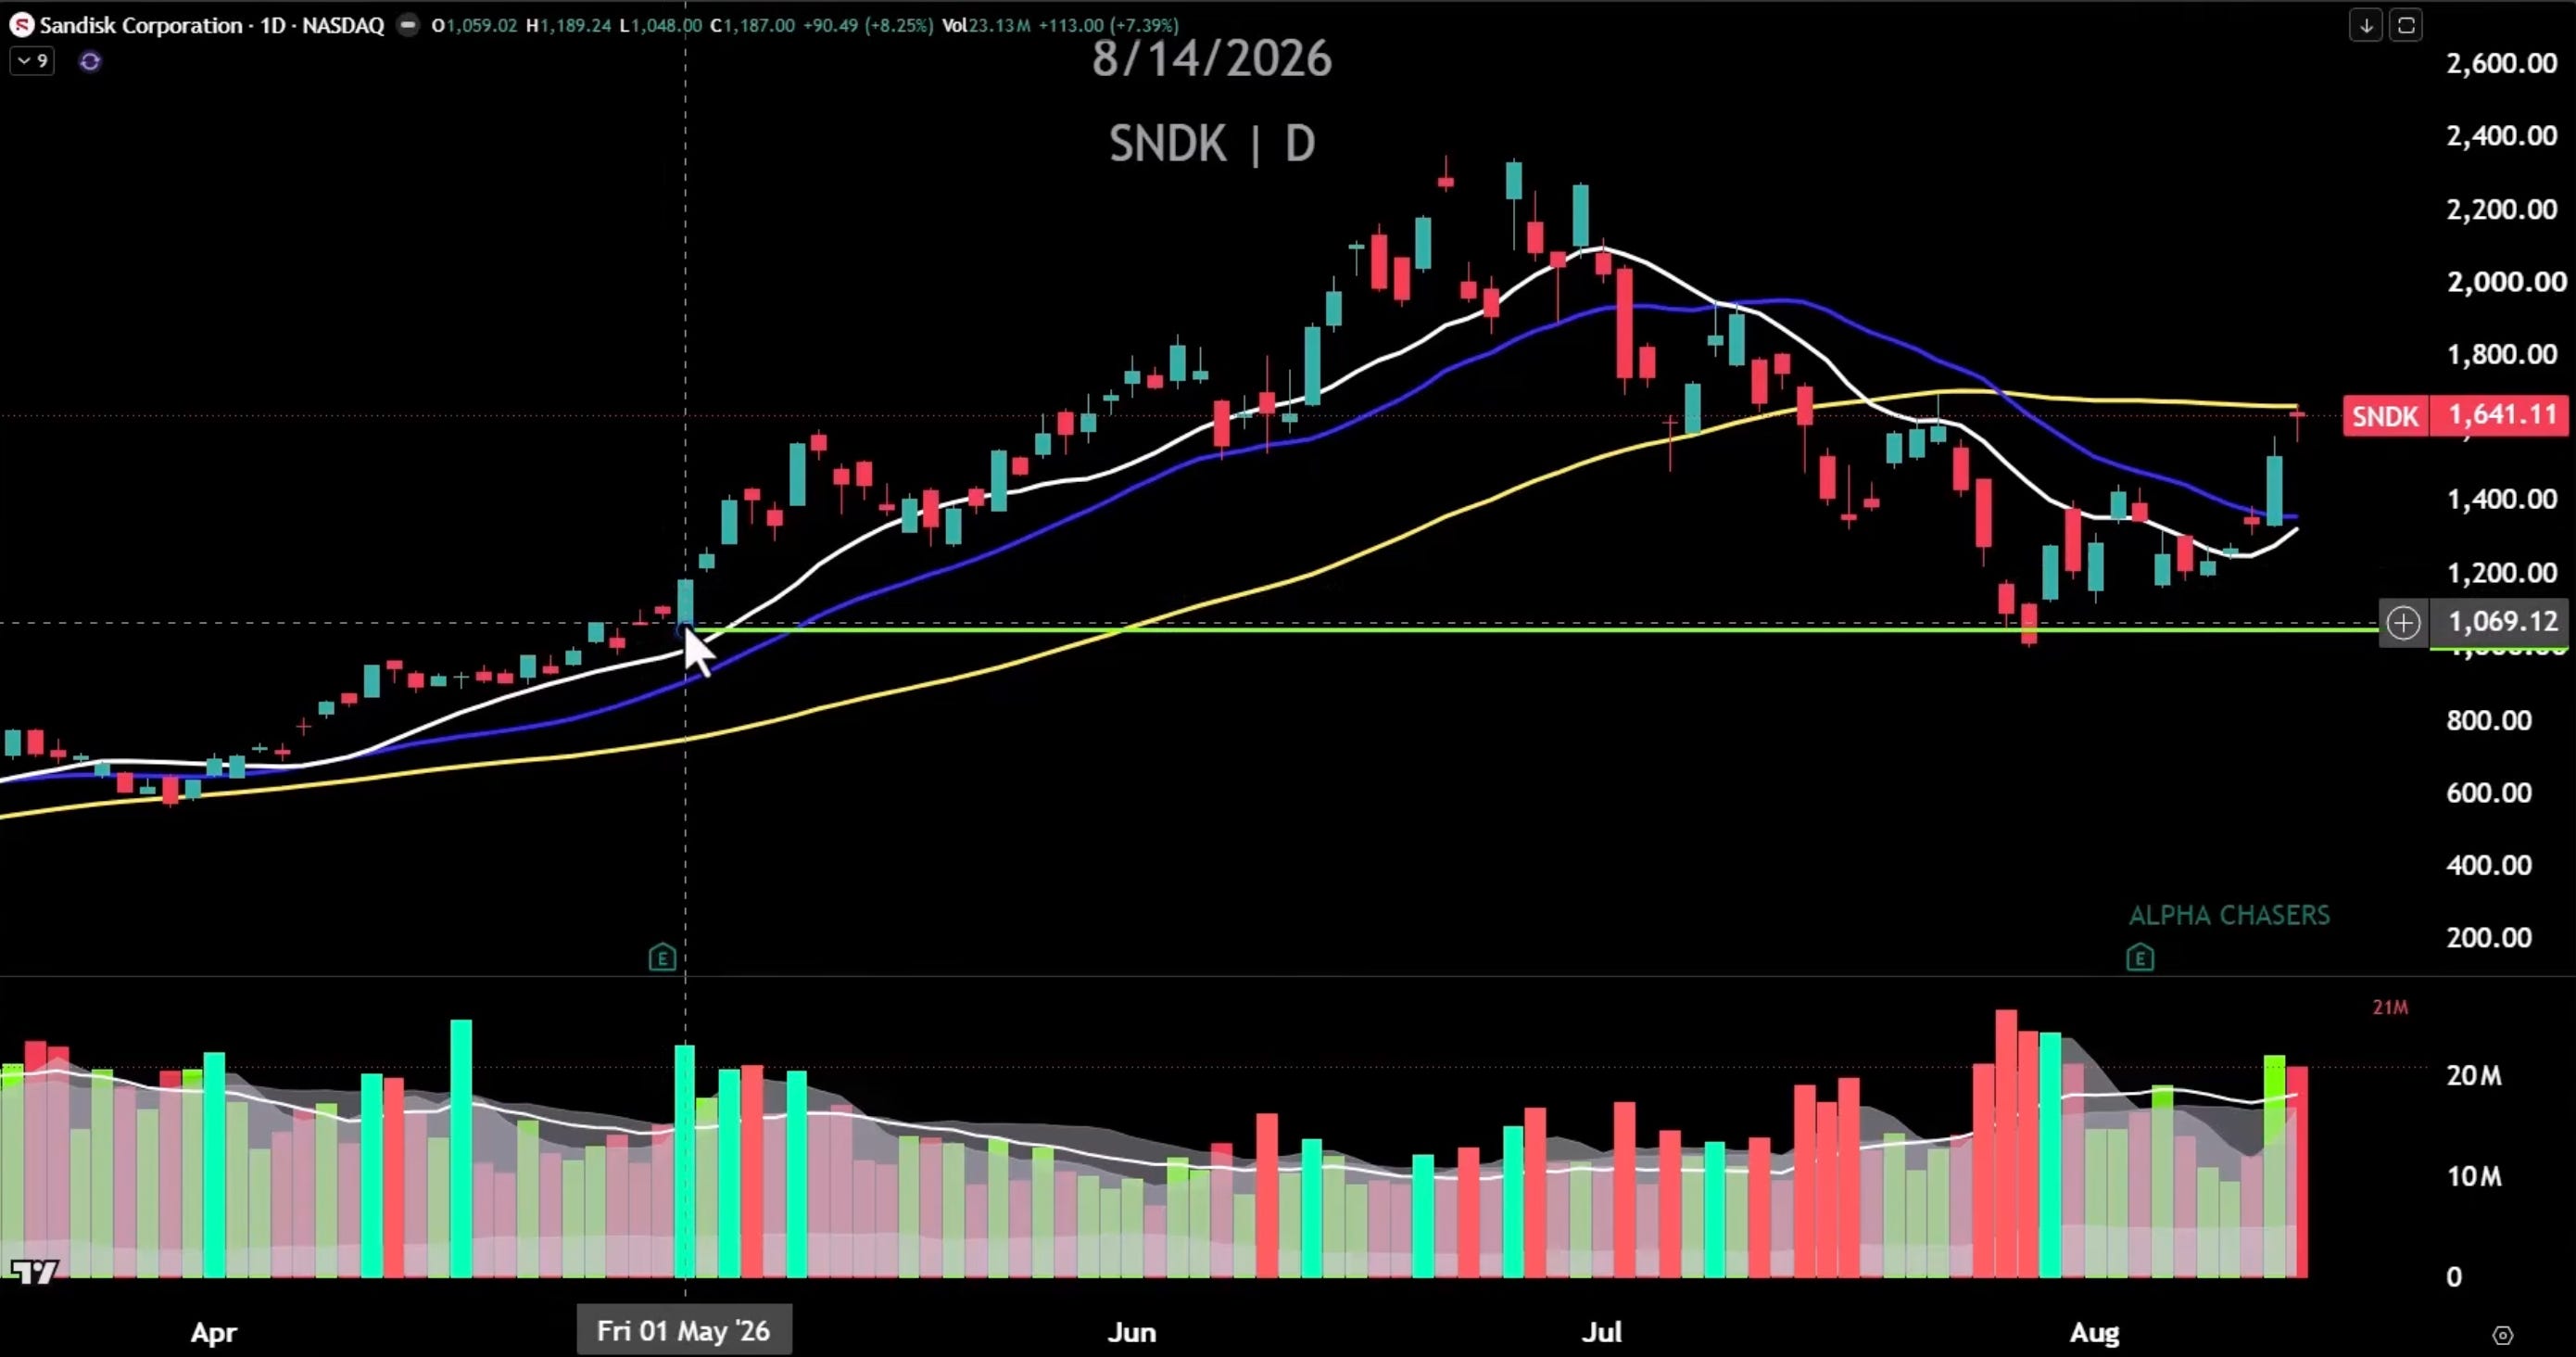
The pattern has become clear over the last several quarters — the stock gaps down on earnings, that gap becomes the low, and the stock proceeds to run significantly higher from there. People call the top every single time this happens, and every single time they’ve been wrong so far.
Right now we have a bearish 12/22 cross transitioning into a bullish one. Call and put walls both moved up roughly 30% in a matter of days — when you see market makers move their walls that aggressively, it tells you they’re no longer worried about downside protection from current levels. The stock also closed above peak VWAP on Friday, which matters because peak VWAP marks the price where the most people are sitting in pain. Once you close above that level and hold, it stops being resistance.
The fundamental case:
This is where it gets genuinely interesting. On their most recent investor day, management laid out guidance for 80% gross margins sustained through 2028-2030. For context, semiconductor gross margins typically run 50-60%. This is software-company-level margin guidance for a memory business.
They’ve signed contracts covering 50% of 2027 bit volume and two-thirds of 2028 bit volume already. That is the entire deceleration argument dismantled in one sentence — you cannot call a business cyclical when it has structured, binding contracts locked in two and three years out.
Total addressable market goes from roughly $300 billion in 2026 to $500 billion in 2027, and they are now actively building out capacity. Just two quarters ago, this same management team said they were holding off on major buildout because they didn’t have visibility into demand. That’s the tell — they are more confident now than at any point recently, not less.
On top of that: 100% of excess free cash flow is going toward buybacks, with $15 billion remaining on the current authorization. Anyone shorting this stock is competing directly against a company actively buying its own shares in the open market with a massive cash pile.
16 different firms raised price targets or issued new positive commentary within a 24-hour window. Price target range is now $1,400 to $3,600.
16 firms raised targets in 24 hours, range now $1,400-$3,600
80% gross margins guided through 2028-2030, contracts locked through 2028
100% of excess free cash flow going to buybacks with $15B remaining
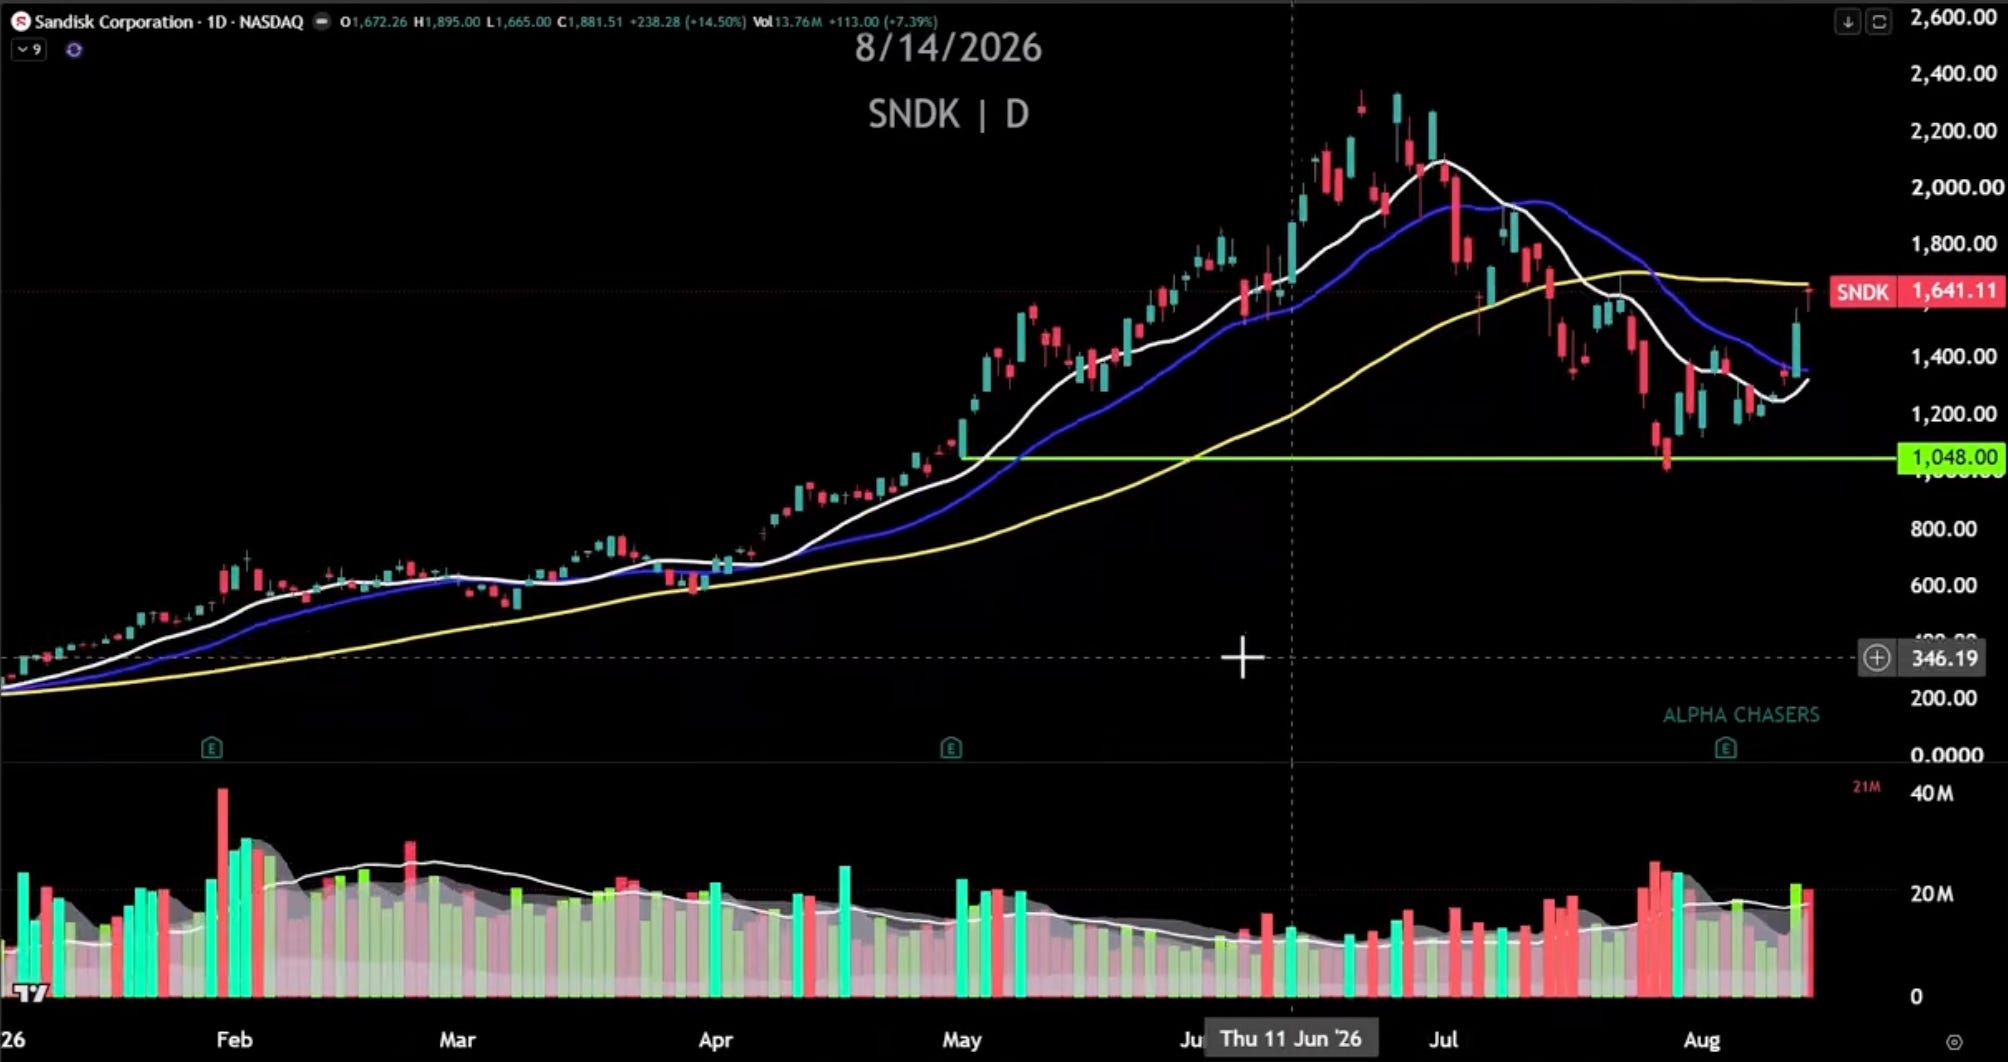
This is the cleanest combination of technical confirmation and fundamental acceleration I’ve seen in a while. I’m watching for the 12/22 cross to confirm and then watching peak VWAP resistance around $1,814 as the next level to clear.
Closed back above the 55-day for the first time
1222 cross confirming, put wall moved up significantly
Closed above peak VWAP Friday — identical setup to $SNDK
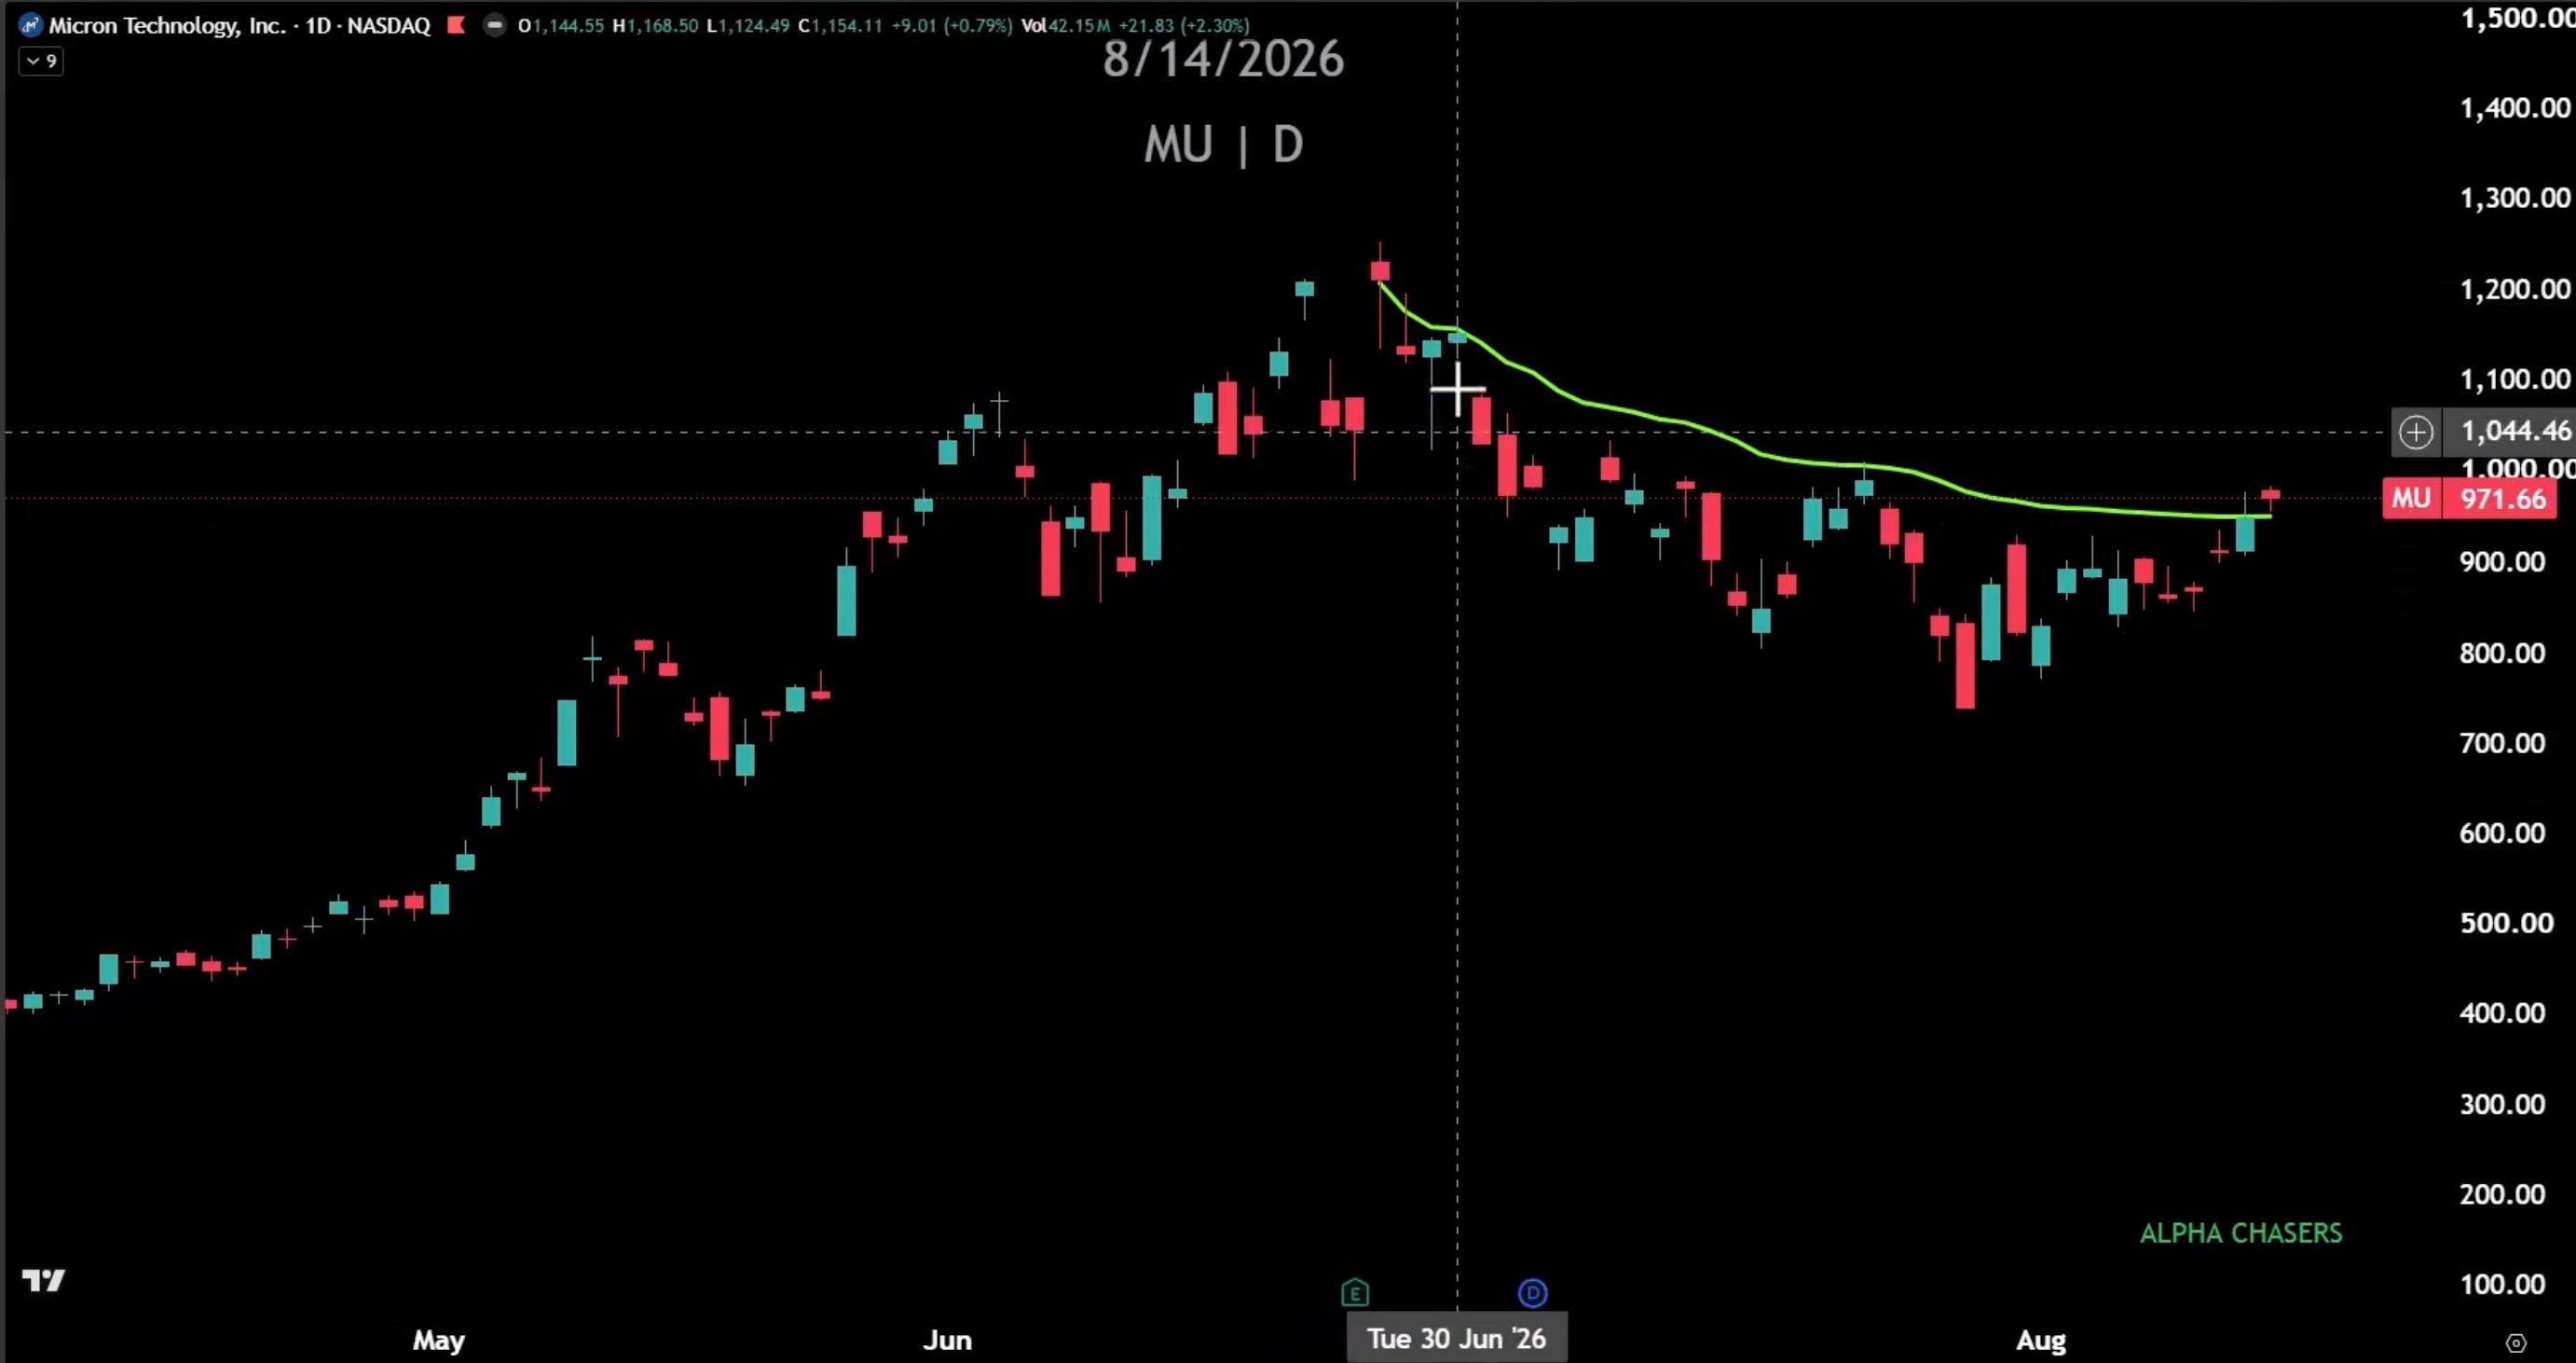
Inverse head and shoulders with a broken neckline. Same technical framework as $SNDK, same conclusion. RSI positioning suggests a gap fill target near $1,100.
Proprietary breadth indicator fired — only the 3rd time in years
Extreme oversold readings historically mark bottoms, not further declines
12/22 cross confirming on the upside index-wide
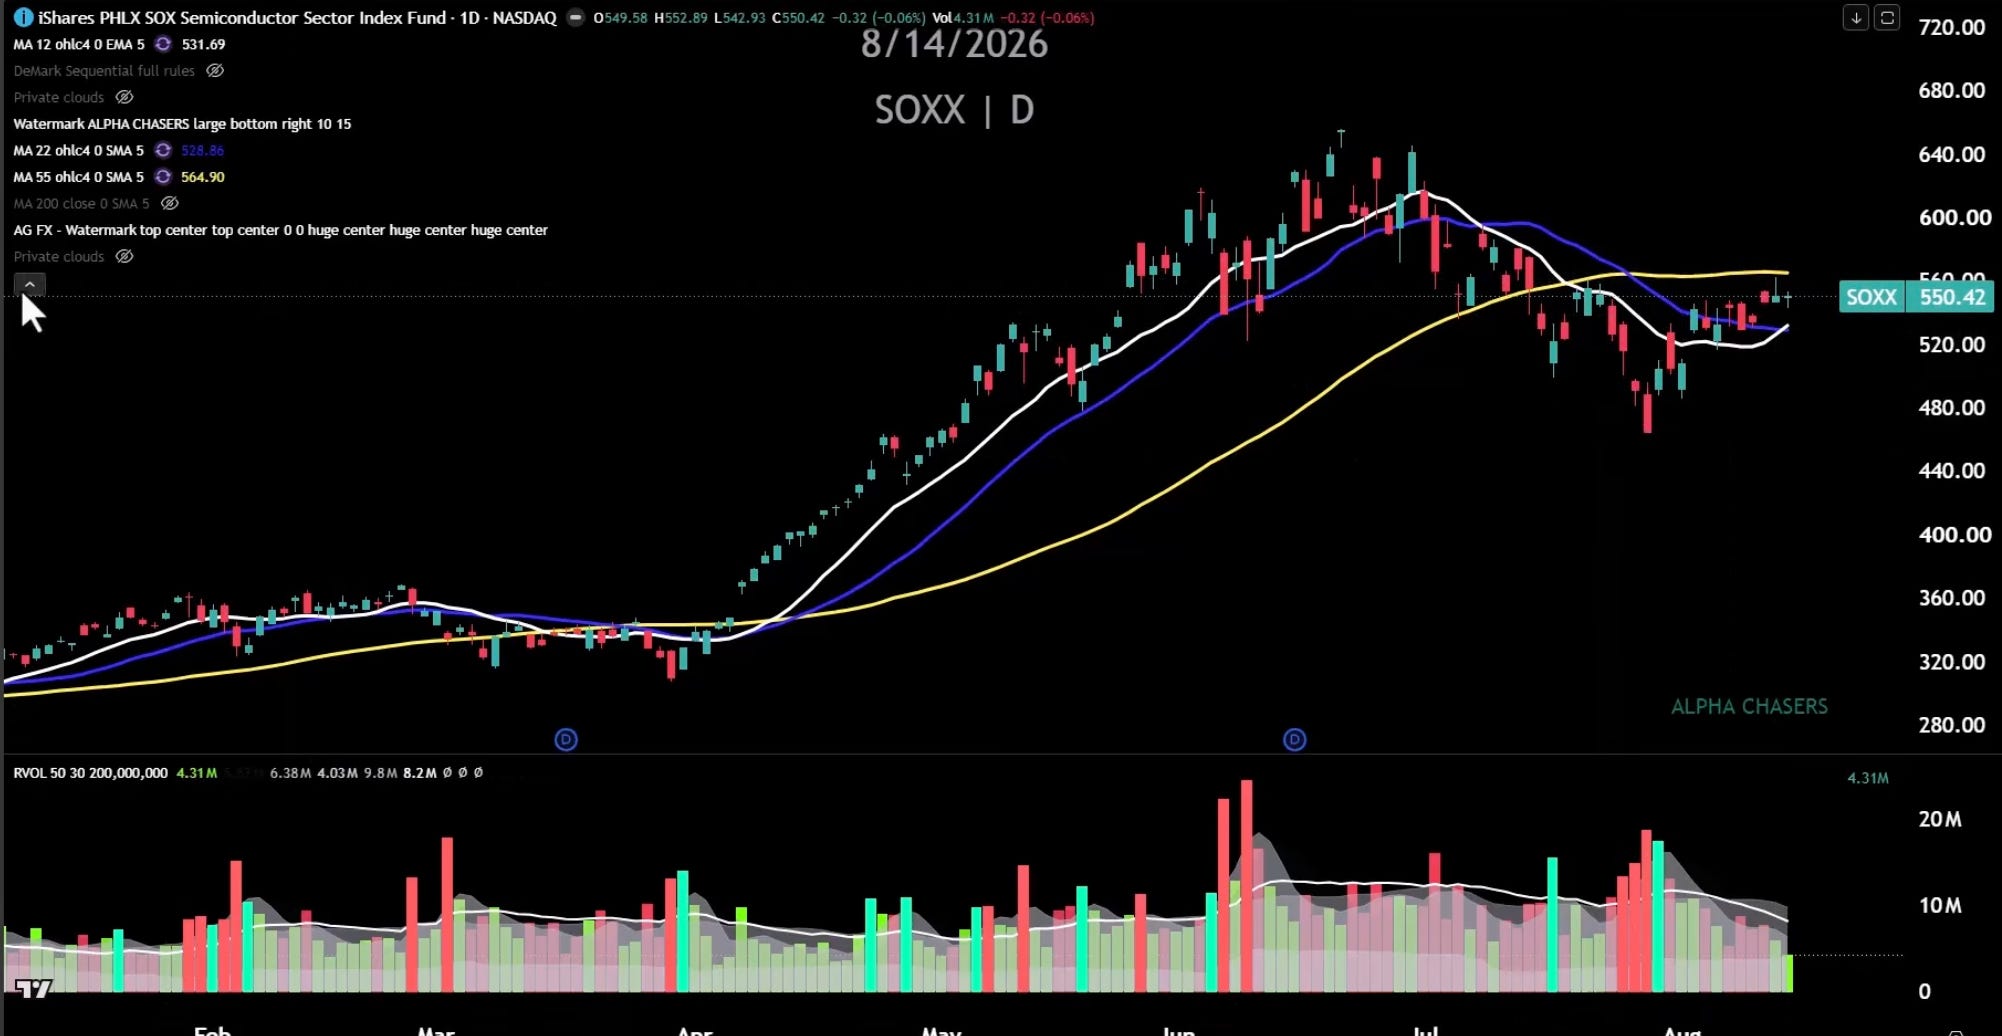
You don’t have to agree with every semiconductor name individually, but fighting a signal this rare has historically been a losing proposition. The framework says trade what’s happening, not what the narrative says should happen.
Berkshire added significantly to their position
Third Point also added meaningfully
Two very different investment styles arriving at the same conclusion
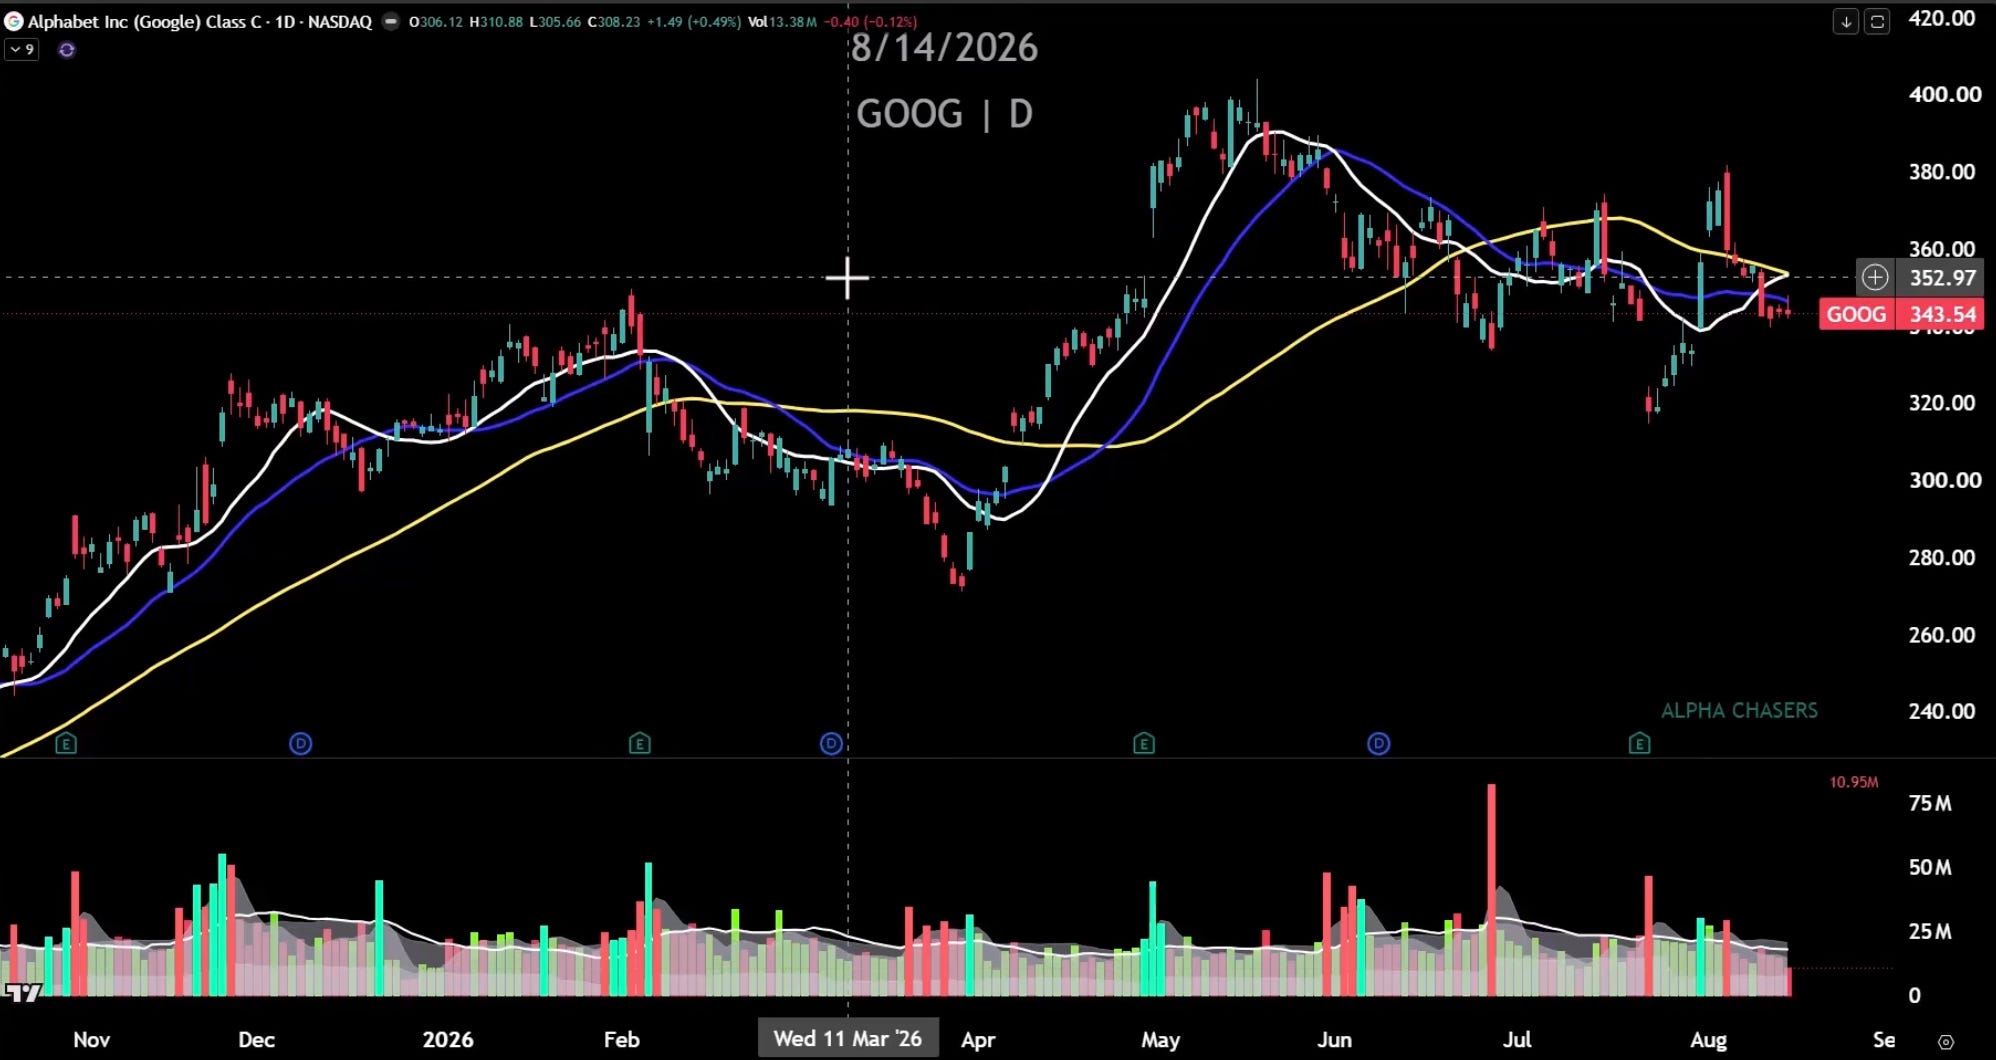
When value-oriented, long-horizon investors like Berkshire and event-driven funds like Third Point are both buying the same name, that’s worth paying attention to regardless of your own timeframe.
$IBB, financials, $XLK, $XLC all reclaiming or holding highs
Even defensive sectors participating — not a rotation story, a broad strength story
AI efficiency gains showing up in margins across multiple sectors, not just tech
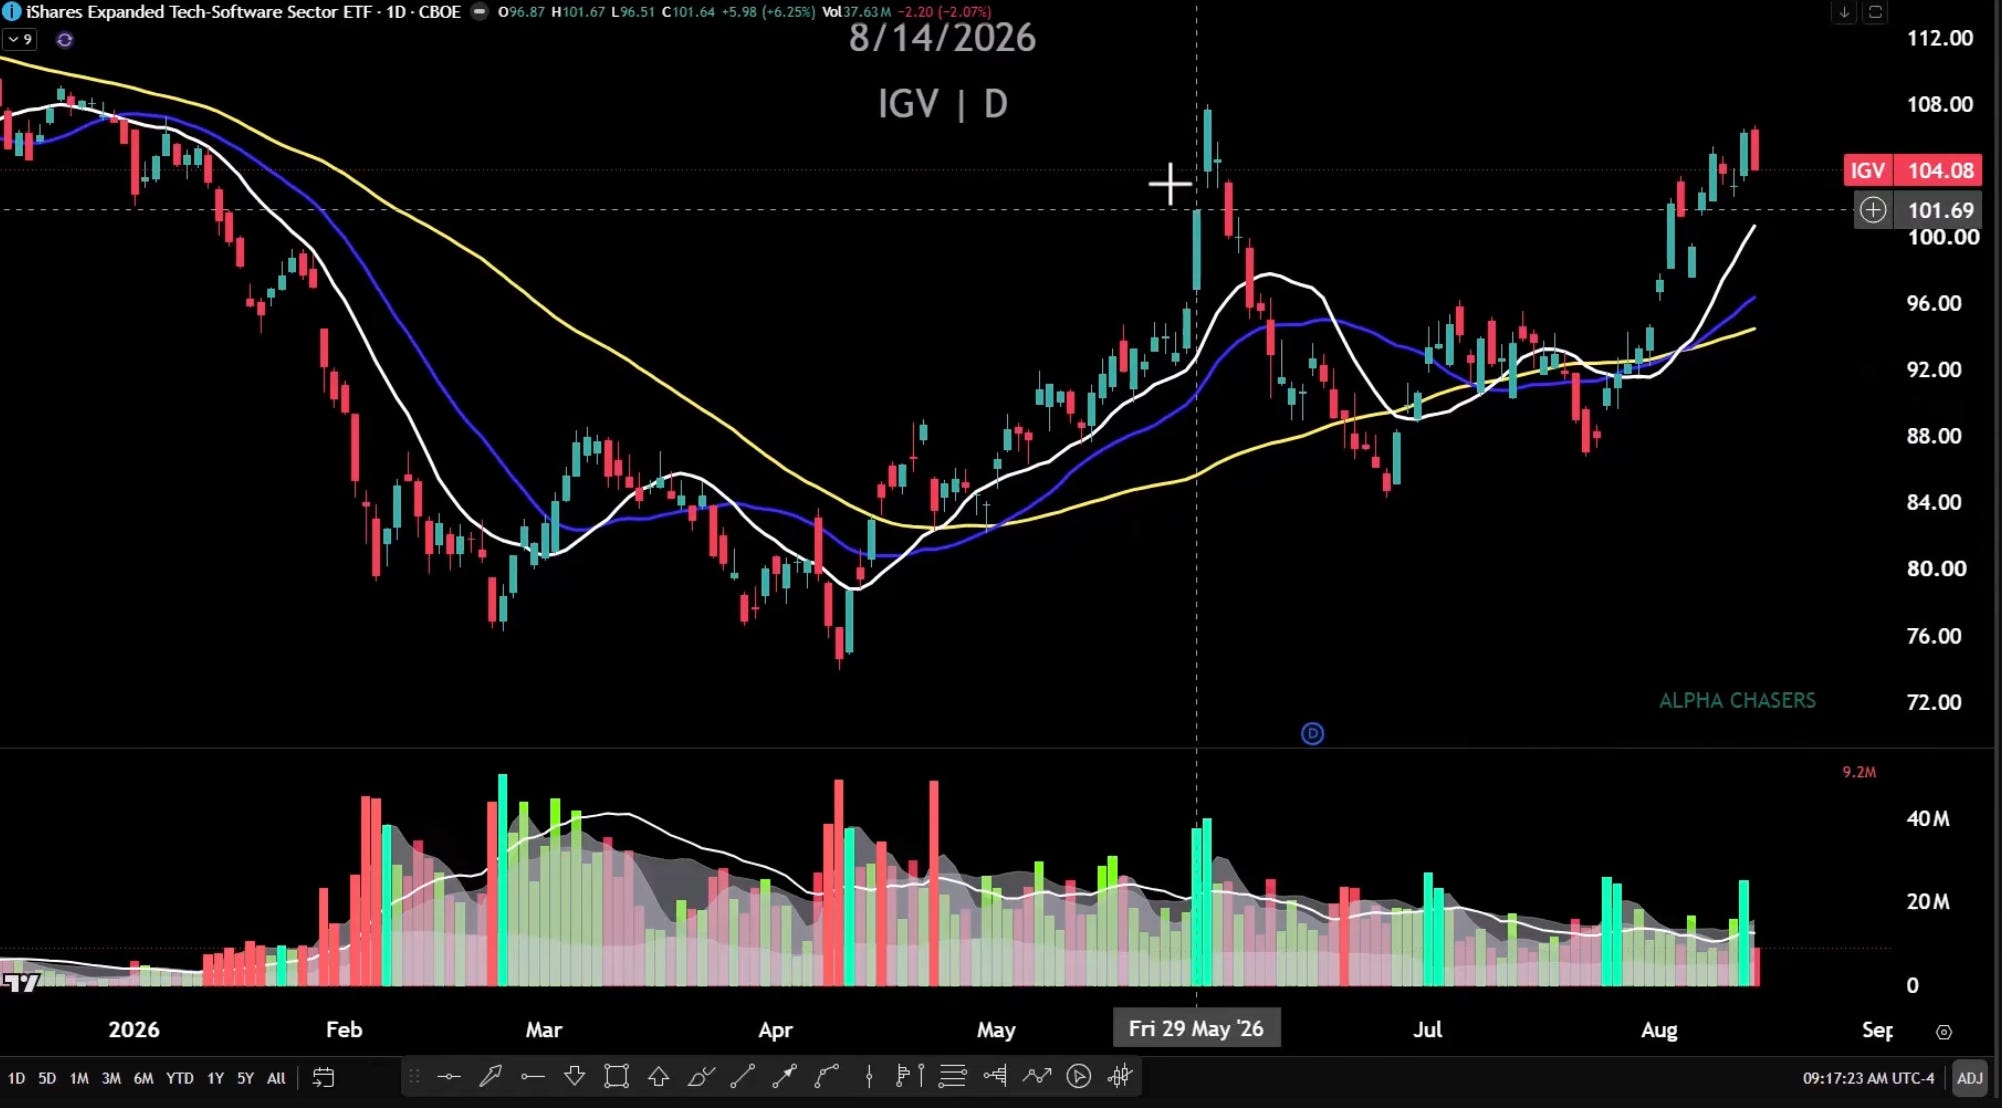
When someone asks “where’s the crash going to come from,” the honest answer right now is: there isn’t an obvious weak link. That doesn’t mean nothing can change it — it means the burden of proof is on the bear case, not the bull case.
$SNDK 12/22 Cross
Should confirm within the next few trading days based on current trajectory. Watch peak VWAP resistance near $1,814 as the next hurdle.
$MU Gap Fill
RSI positioning points to a potential move toward $1,100. Same technical framework as $SNDK — watch for confirmation.
USD/JPY
US intervention has stopped the recent bleed. Monitor, don’t panic. This isn’t behaving the same way it did during the 2024 carry trade unwind.
13F Season
Continue watching institutional positioning in $GOOG and other mega caps for clues on where smart money is actually allocating versus what the headlines suggest.
$SPY broke out of a bull flag. A rare breadth signal just fired on semiconductors. $SNDK got a wave of price target increases backed by genuinely structural fundamental improvements — not hype, actual signed contracts and margin guidance that reads like a software company’s.
The single biggest edge you can develop as a trader is learning to trade what the market is actually doing instead of what you think it should be doing. Right now, what it’s doing is telling a bullish story across nearly every sector simultaneously.
That doesn’t mean it lasts forever. It means this is the hand you’re dealt right now — and the process is to trade that hand, not the one you wish you had.
The full breakdown — including the complete $SNDK technical and fundamental deep dive, the proprietary breadth indicator walkthrough, and how to apply this exact framework to any stock you’re analyzing — is on YouTube now.
No posts
Comments
Nothing yet. Say the first thing.
Sign in to join the conversation.