Performance data
can be confusing
Where's my app spending its time?
How bad are my slowdowns?
How can I improve speeds?
Is my new deploy faster?
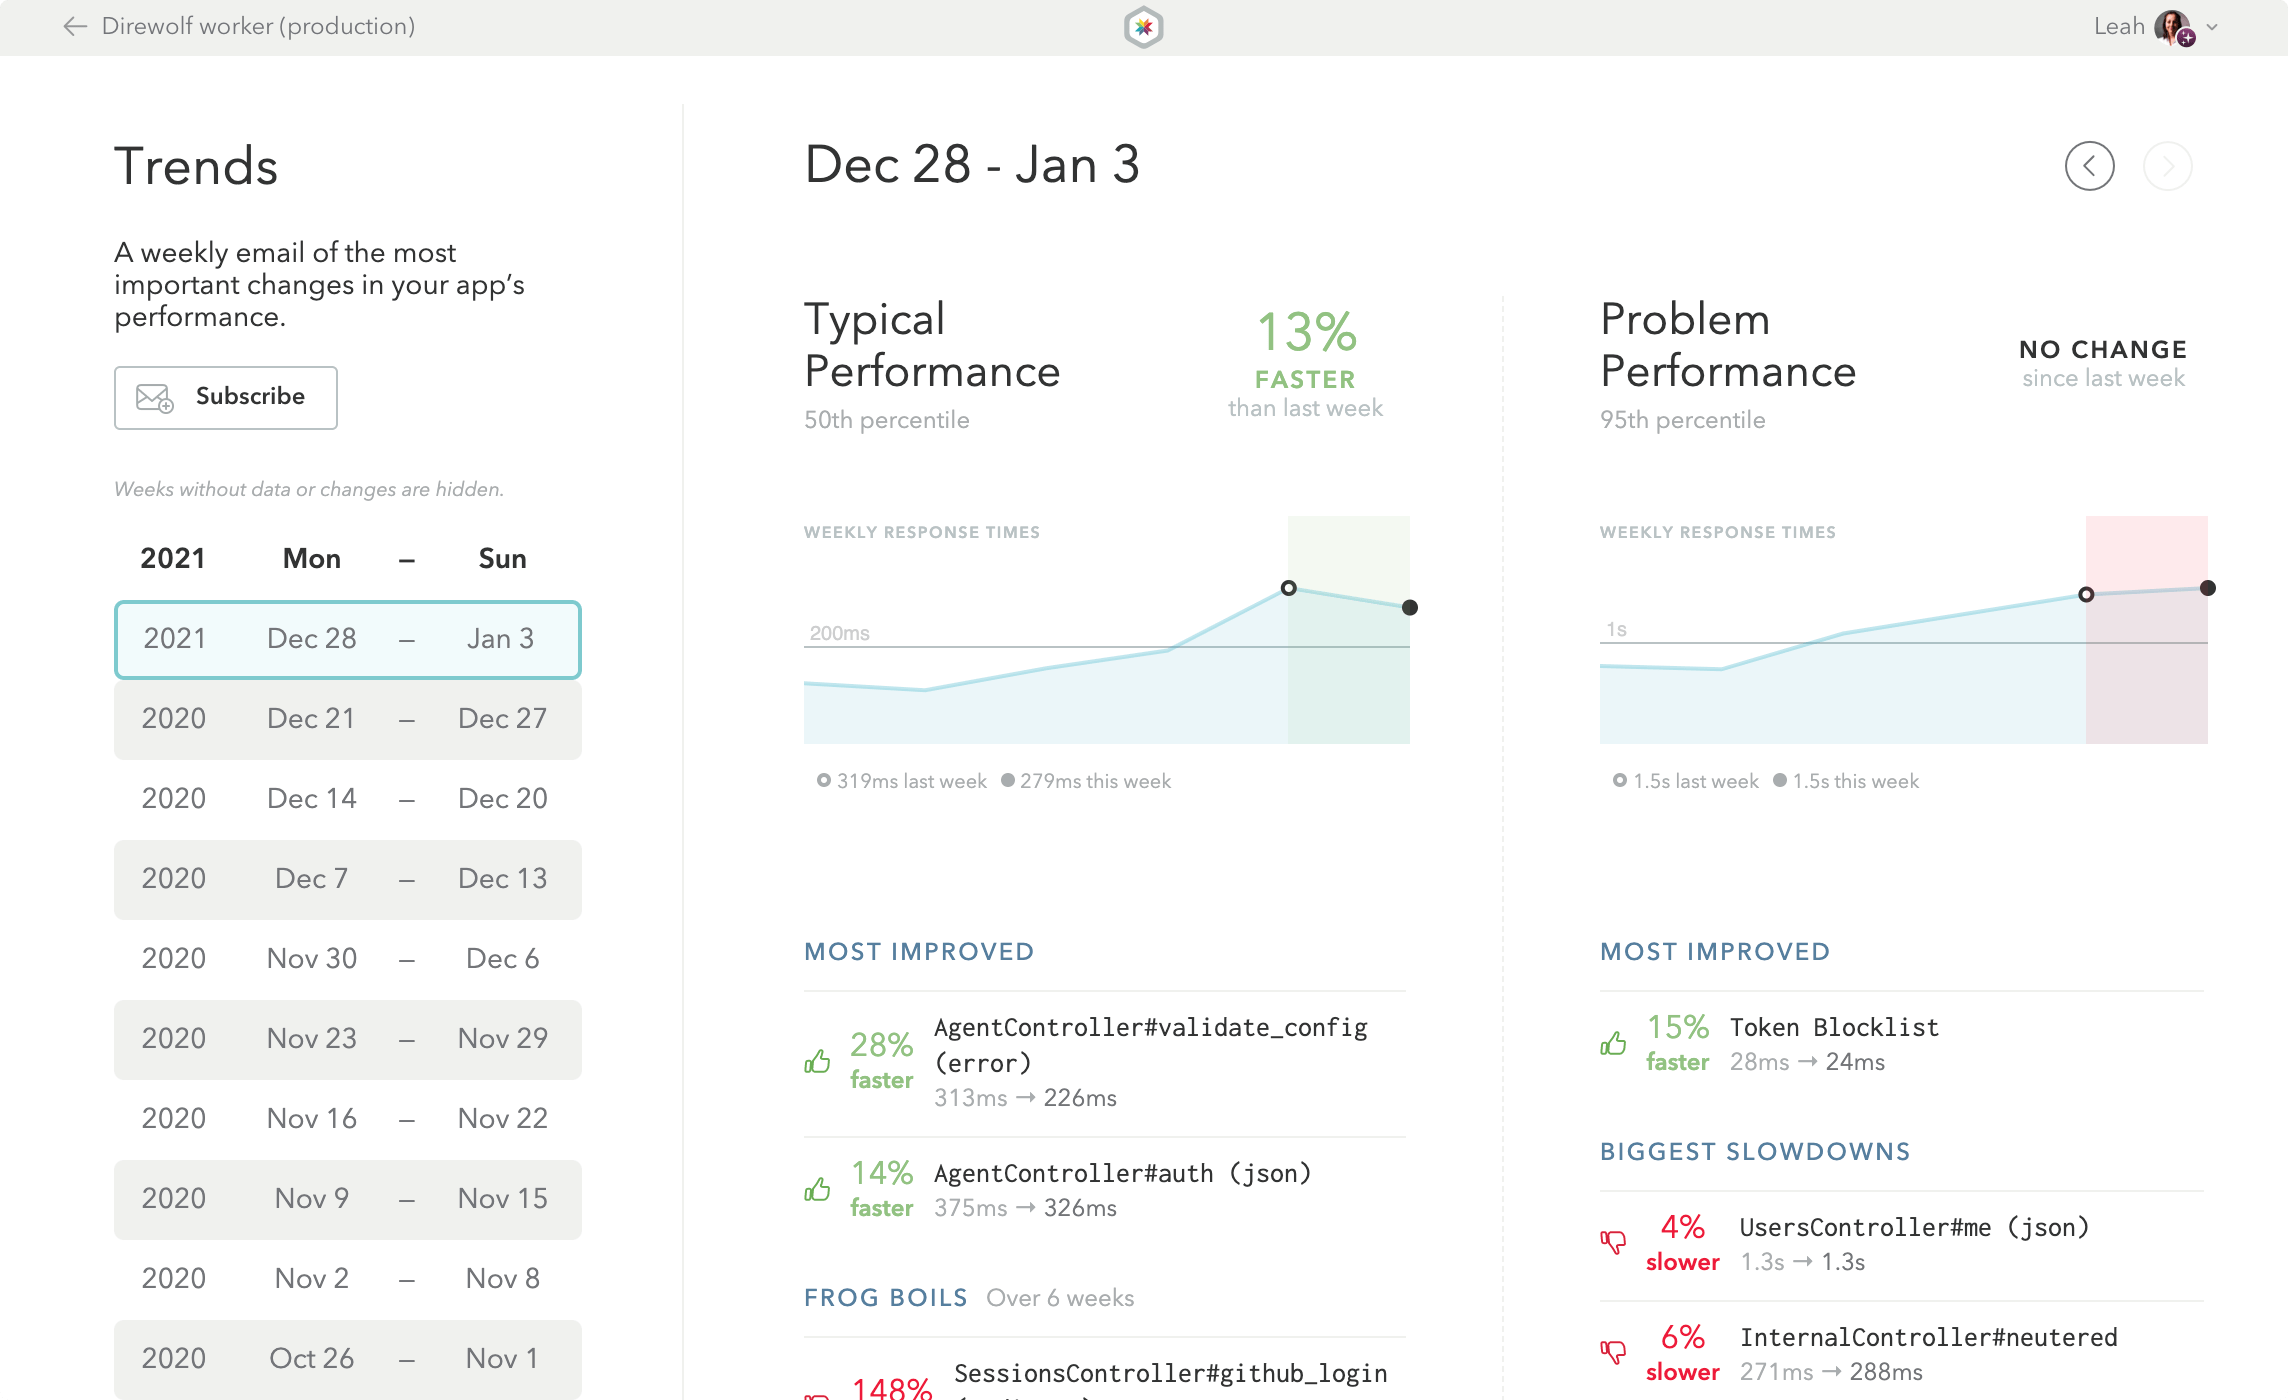
How can I detect trends?
Where are my bottlenecks?

Skylight makes it easy
Trends at a glance. Endpoints to improve.
Questions answered.
Just the essentials. Not a zillion charts you don’t need.
-

Dive into your most agonizing endpoints
We sort endpoints by "agony" — a weighted measure of slowness and popularity. Endpoints at the top of the list will you give you the biggest bang for your performance-optimization buck.
-

See which events should be improved
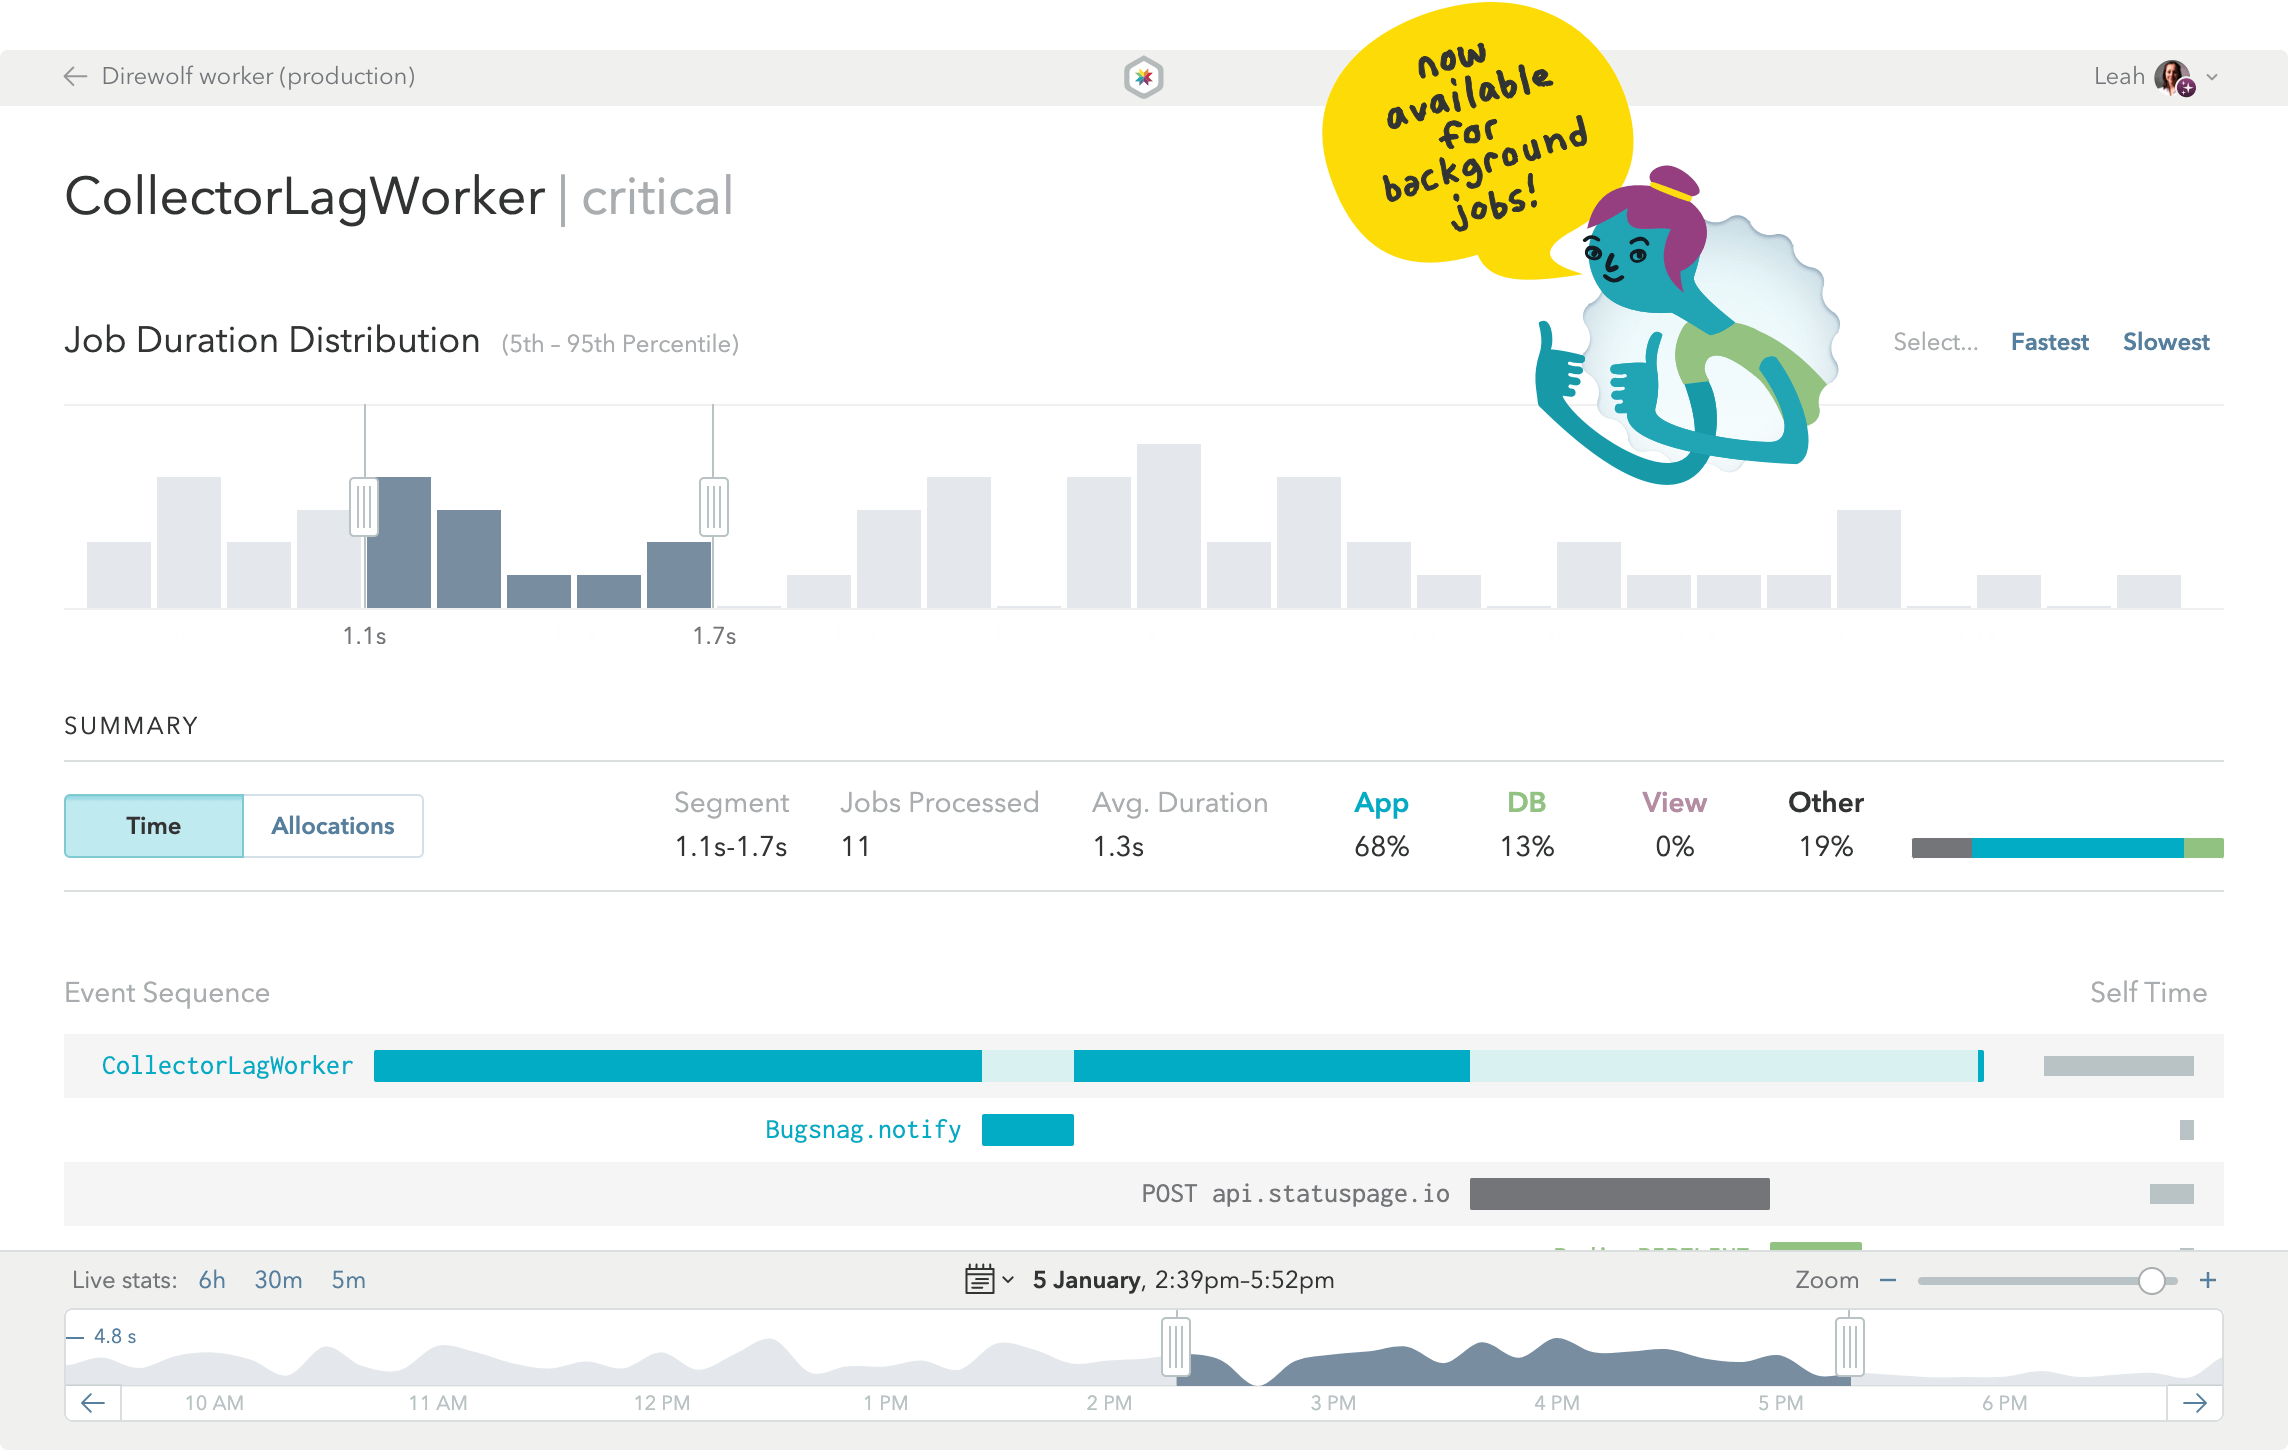
Our endpoint graphs show you precisely where slowdowns are occurring. Look for the widest bars in an endpoint sequence to see which events you should focus on.
-

Optimize, deploy and measure
Once you've improved your code, redeploy your app. Deploys are plotted on the overview graph to provide a convenient before-and-after view of your work.
And yes we have features

Featherweight Agent

Response Distribution

Frog Boils

Event Timelines

SQL Structuring

Performance Trends

Allocation Hogs

Code Mistakes