Abstract
Background
Voluntary counseling and testing (VCT) continues to play a critical role in HIV prevention, care and treatment. In recent years, different modalities of VCT have been implemented, including clinic‐, mobile‐ and home‐based testing and counseling. This review assesses the effects of all VCT types on HIV‐related risk behaviors in low‐ and middle‐income countries.
Objectives
The primary objective of this review is to systematically review the literature examining the efficacy of VCT in changing HIV‐related risk behaviors in developing countries across various populations.
Search methods
Five electronic databases – PubMed, Excerpta Medica Database (EMBASE), PsycINFO, Sociological Abstracts, and the Cumulative Index to Nursing and Allied Health Literature (CINAHL) – were searched using predetermined key words and phrases. Hand‐searching was conducted in four key journals including AIDS, AIDS and Behavior, AIDS Education and Prevention, and AIDS Care; the tables of contents of these four journals during the included time period were individually screened for relevant articles. The reference lists of all articles included in the review were screened to identify any additional studies; this process was iterated until no additional articles were found.
Selection criteria
To be included in the review, eligible studies had to meet the following inclusion criteria: 1) Take place in a low‐ or middle‐income country as defined by the World Bank, 2) Published in a peer‐reviewed journal between January 1, 1990 and July 6, 2010, 3) Involve client‐initiated VCT, including pre‐test counseling, HIV‐testing, and post‐test counseling, and 4) Use a pre/post or multi‐arm design that compares individuals before and after receiving VCT or individuals who received VCT to those who did not, and 5) Report results pertaining to behavioral, psychological, biological, or social HIV‐related outcomes.
Data collection and analysis
All citations were initially screened and all relevant citations were independently screened by two reviewers to assess eligibility. For all included studies data were extracted by two team members working independently using a standardized form. Differences were resolved through consensus or discussion with the study coordinator when necessary. Study rigor was assessed using an eight point quality score and through the Cochrane Collaboration's Risk of Bias Assessment Tool. Outcomes comparable across studies, including condom use and number of sex partners, were meta‐analyzed using random effects models. With respect to both meta‐analyses, data were included from multi‐arm studies and from pre/post studies if adequate data were provided. Other outcomes, including HIV‐incidence, STI incidence/prevalence, and positive and negative life events were synthesized qualitatively. For meta‐analysis, all outcomes were converted to the standard metric of the odds ratio. If an outcome could not be converted to an odds ratio, the study was excluded from analysis.
Main results
An initial search yielded 2808 citations. After excluding studies failing to meet the inclusion criteria, 19 were deemed eligible for inclusion. Of these studies, two presented duplicate data and were removed. The remaining 17 studies were included in the qualitative synthesis and 8 studies were meta‐analyzed. Twelve studies offered clinic‐based VCT, 3 were employment‐based, 1 involved mobile VCT, and 1 provided home‐based VCT. In meta‐analysis, the odds of reporting increased number of sexual partners were reduced when comparing participants who received VCT to those who did not, unadjusted random effects pooled OR= 0.69 (95% CI: 0.53‐0.90, p=0.007). When stratified by serostatus, these results only remained significant for those who tested HIV‐positive. There was an insignificant increase in the odds of condom use/protected sex among participants who received VCT compared to those who did not, unadjusted random effects pooled OR=1.39 (95% CI: 0.97‐1.99, p=0.076). When stratified by HIV status, this effect became significant among HIV‐positive participants, random effects pooled OR= 3.24 (95% CI: 2.29‐4.58, p<0.001).
Authors' conclusions
These findings add to growing evidence that VCT can change HIV‐related sexual risk behaviors thereby reducing HIV‐related risk, and confirming its importance as an HIV prevention strategy. To maximize the effectiveness of VCT, more studies should be conducted to understand which modalities and counseling strategies produce significant reductions in risky behaviors and lead to the greatest uptake of VCT.
Keywords: Humans, Developing Countries, Risk Reduction Behavior, Condoms, Condoms/statistics & numerical data, Counseling, Counseling/methods, HIV Infections, HIV Infections/diagnosis, HIV Infections/prevention & control, HIV Infections/psychology, HIV Seropositivity, HIV Seropositivity/diagnosis, HIV Seropositivity/psychology, Randomized Controlled Trials as Topic, Sexual Partners
Plain language summary
The role of voluntary counseling and testing (VCT) in changing risk behaviors related to HIV
Learning one's HIV status and receiving counseling is an important step to receiving HIV‐related care and treatment, but also an important intervention for potentially changing risk behaviors related to HIV. A systematic review of the literature and a quantitative assessment found that VCT is an effective strategy for reducing some HIV‐related risk behaviors, including decreasing the number of sexual partners of participants. Condom use was also significantly increased among participants who tested HIV‐positive during VCT. Future research is needed to understand how VCT can be delivered more effectively to maximize its potential as an HIV prevention strategy.
Background
HIV voluntary counseling and testing (VCT) is an important component of HIV prevention programs and a critical entry point into HIV care and treatment. As a prevention strategy, it is believed that VCT can influence behavior change through a process involving individualized counseling, acquisition of HIV/AIDS knowledge and awareness, and learning one’s HIV status. Previous reviews have found that VCT can reduce risky sexual behaviors, thus reducing the likelihood of virus transmission, especially among serodiscordant couples (Higgins 1991; Wolitski 1997). In addition, results from a meta‐analysis conducted by Weinhardt et al., 1999 substantiated evidence that VCT can be an effective behavior change strategy for people infected with HIV (Weinhardt 1999). The majority of studies included in these earlier reviews, however, were from developed countries. Given that implementing VCT programs in resource‐limited settings can pose significantly different challenges from those presented in developed countries (De Zoysa 1995), Denison 2008 conducted a systematic review and meta‐analysis of VCT evaluations from low and middle‐income countries that were published between 1990 and April 2005 (Denison 2008). Results of this meta‐analysis from seven studies provide evidence in support of VCT as a moderately effective strategy for reducing sexual risk behavior in developing country contexts. The Denison 2008 review found that participants who received VCT were significantly less likely to engage in unprotected sex as compared to participants prior to receiving VCT or to participants who did not receive VCT, OR=1.69, 95% CI 1.25‐2.31. The review also found that receiving VCT had no effect on changing the number of sexual partners of participants (Denison 2008).
Since the publication of the Denison et al. (2008) review, the field of VCT has continued to expand with the number of facilities globally offering VCT services increasing 35% from 2007 to 2008 alone. Despite this expansion, the majority of individuals worldwide remain unaware of their HIV status (WHO 2009). In order to increase access and promote awareness of one’s HIV status, different models of VCT delivery have been developed to reach individuals, couples and families not only through different clinic settings and provider‐initiated testing (UNAIDS/WHO), but also by bringing VCT closer to people in their communities and homes through mobile and home‐based testing approaches. More recently it has been debated whether HIV testing should become a routine part of medical care while still remaining voluntary and confidential. In 2007 the World Health Organization (WHO) and the Joint United Nations Programme on HIV/AIDS (UNAIDS) created guidelines for provider‐initiated testing and counseling (PITC) which, as opposed to client‐initiated testing and counseling, is performed in health facility as a standard service for all patients in a generalized epidemic and for high‐risk patients in a concentrated epidemic setting (WHO 2007).
This expansion and diversification reflects progress made towards achieving the Sixth Millennium Development Goal of providing HIV treatment to all who need it by 2015, as knowledge of one’s HIV infection status is necessary for accessing life saving antiretroviral therapy. The importance of VCT as an HIV prevention strategy, however, was reiterated in a resolution passed by the UN General Assembly in 2006 (United Nations 2006) and the rapidly expanding field of HIV testing and counseling has provided new opportunities for evaluation of the service as an HIV prevention tool. This review seeks to examine the effectiveness of VCT, including these newer VCT delivery models such as mobile and home‐based testing, on reducing sexual risk behaviors in low‐ and middle‐income countries as a means of preventing future HIV infections.
This review updates the results originally published by Denison et al. in 2008; however, in the current review only VCT interventions were evaluated whereas the Denison review assessed both VCT and PITC interventions. In this review we used updated inclusion criteria that differentiated between provider‐initiated (PITC) and VCT (WHO 2007). Interventions originally included in the Denison et al. review that took place as a routine part of health services, such as receiving HIV testing and counseling at an antenatal care visit, have been excluded from this review and analyzed separately in a review of PITC (Kennedy 2012).
Objectives
The primary objective of this review is to systematically review the literature examining the efficacy of VCT in changing HIV‐related risk behaviors in developing countries across various populations. This review will also compare the efficacy of the different approaches of VCT, as many new methodologies have been developed in recent years. The three specific aims are as follows:
To systematically identify and review all available literature examining the efficacy of VCT interventions in developing countries.
To describe studies evaluating the effects of VCT on behavioral, biomedical, and psychological outcomes relating to HIV prevention in developing countries, and if warranted, stratify studies based on the type of VCT provided (e.g. home‐based, mobile, etc.) and/or the type of population under study.
To conduct a meta‐analysis that synthesizes comparable outcomes across eligible studies in order to evaluate the overall effectiveness of VCT in reducing HIV‐related risk behaviors.
Methods
Criteria for considering studies for this review
Types of studies
We included studies conducted in low‐ and middle‐income countries as defined by the World Bank (World Bank 2010). The period of inclusion for studies was January 1, 1990 through July 6, 2010. Articles published in any language were included if they met the inclusion criteria. Only peer reviewed articles were eligible; conference abstracts and unpublished reports were excluded from the review. We strove to include studies that maintained a high level of methodological rigor, such as randomized controlled trials, but also included interventions with weaker study designs. Specifically, the following study designs were eligible for inclusion: (1) Randomized trial (individual): Minimum two study arms; random assignment of individuals to study arm; (2) Randomized trial (group): Minimum two study arms; random assignment of groups (couples, classrooms, towns, etc.) to study arm; (3) Non‐randomized “trial” (individual): Minimum two study arms; assignment of individuals to study arm, but not done randomly; (4) Non‐randomized “trial” (group): Minimum two study arms; assignment of groups to study arm, but not done randomly; (5) Before‐after study: Pre‐ and post‐intervention assessment among the same individuals. One study arm and one follow‐up assessment period; (6) Time series study: Pre‐intervention and several post‐intervention assessments among the same individuals. One study arm and multiple follow‐up assessment periods; (7) Case‐control study: Two groups defined by outcome measures, one consisting of cases and one consisting of controls. To be included, the study must compare outcomes between those who got the intervention and those who did not; (8) Prospective cohort: Two or more groups defined by exposure measures and followed over time; (9) Retrospective cohort: Two or more groups defined by exposure measures, but uses previously collected or historical data; (10) Cross‐sectional: Exposure and outcome determined in the same population at the same time. To be included, the study must compare outcomes between those who got the intervention and those who did not; (11) Serial cross‐sectional: When a cross‐sectional survey is conducted in a population at multiple points in time with different people in that population.
Among the eligible study designs, we only included studies that presented the results of comparisons made between participants who received VCT to those who did not receive VCT or ones that made a pre‐post test comparison before and after VCT was provided. We also included studies that compared more and less intensive versions of a VCT intervention. Studies that did not meet the inclusion criteria but presented relevant qualitative data, cost‐effectiveness data, or other review articles/meta‐analyses were collected and included in the review as background articles; a brief data abstraction was conducted for these studies.
Types of participants
This review included studies conducted with a variety of different populations; therefore, we had no restrictions on the types of participants. We only required that participants reside in the low‐ or middle‐income country where the study took place and voluntarily consented to receive HIV testing and counseling, and participate in the study. We included both individual and couples‐ based VCT interventions. However, we did not include studies that compared individual to couples‐based VCT as this comparison addresses a separate research question not posed in our current review. For this reason,Farquhar 2004 was included in the Denison 2008 review but was excluded from the current review because it compared individuals' to couples' counseling. Since both groups in this study received a form of VCT, there was no relevant multi‐arm or pre/post comparison on which to draw conclusions about the efficacy of VCT on changing risk behaviors.
Types of interventions
Studies were included in the review if they evaluated a VCT intervention adhering to the international standards for VCT as initially presented by the US Centers for Disease Control and Prevention (CDC) and UNAIDS (CDC 2001;UNAIDS 2000). For the purposes of this review, we operationalized these guidelines into a concise, three‐criterion definition of VCT: (1) receiving pre‐test counseling, (2) being tested for HIV, and (3) receiving post‐test counseling and test results. In addition, this review included interventions where the client, as opposed to the provider, initiated the HIV test either directly or as a result of outreach services. Studies which are conducted in a healthcare setting where the provider initiates the HIV test for clients seeking other services were not included in this review as this is considered provider initiated testing and counseling (PITC) and was analyzed in a separate review (Kennedy 2012). Based on this criteria, three studies included in the original Denison 2008 review were excluded from the current review. Allen 1992 was excluded because women were recruited from prenatal and pediatric outpatient clinics while receiving other routine health services. Similarly, Xu 2002 was excluded because participants were recruited from postpartum wards and family planning clinics where they were receiving routine care. Both studies have been included in the Kennedy et al., 2012 review on the effects of PITC on HIV‐related risk behaviors. As mentioned above, Farquhar 2004 was also excluded because it compared individual to couples' counseling and testing, and therefore did not address the primary research question.
Types of outcome measures
This review focused on primary outcomes measured post‐intervention where results are presented for either a pre/post test comparison or a comparison between at least two study arms. Therefore, two main comparisons were assessed: 1) comparing outcomes among participants who received VCT to those who did not and 2) comparing outcomes measured prior to receiving VCT and after VCT. All other outcomes were considered secondary endpoints and were not emphasized in the analysis.
This review included studies reporting at least one outcome measure directly related to HIV prevention, including behavioral, biological, and psychosocial outcomes. Behavioral outcomes included indicators that measure participants’ risk reduction knowledge, attitudes, beliefs, and behaviors regarding HIV. Examples of behavioral outcomes include use of male/female condoms, frequency of having unprotected sex and number of sex partners. Biological outcomes included indictors, such as HIV/STI prevalence and pregnancy incidence, that relate to the biological manifestations of practicing or not practicing protective behaviors related to HIV transmission. Psychosocial outcomes included aspects of behavior or mental health influenced by social factors and includes examples such as self‐efficacy, stigma, and support from family and friends. If additional behavioral, biological, or psychosocial outcomes were presented within the studies, we recorded these outcomes as well.
Search methods for identification of studies
Three different approaches were used to identify eligible articles for inclusion. Five electronic databases – PubMed, Excerpta Medica Database (EMBASE), PsycINFO, Sociological Abstracts, and the Cumulative Index to Nursing and Allied Health Literature (CINAHL) – were searched using predetermined key words and phrases. These search terms were identical to those used for the Denison 2008 review and were as follows: “HIV counseling and testing” OR “HIV VCT” OR “HIV voluntary counseling and testing” OR “HIV anonymous counseling and testing” OR “HIV ACT” OR “HIV testing and counseling and evaluation” OR “HIV testing and counseling and interventions” OR “HIV counseling and efficacy” (Denison 2008). Hand‐searching was conducted in four key journals including AIDS, AIDS and Behavior, AIDS Education and Prevention, and AIDS Care; the tables of contents of these four journals during the included time period were individually screened for relevant articles. The reference lists of all articles included in the review were screened to identify any additional studies; this process was iterated until no additional articles were found.
Since the search methods were identical to those used in the Denison 2008 review, a new search was conducted from April 2005 through July 2010. These search results were combined with the original search conducted by Denison 2008 that covered dates from January 1990 through April 2005.
Data collection and analysis
Screening and Data Abstraction
Search results from each database were merged and duplicate citations were removed. Trained staff (who received 15 hours of training on systematic review methods and training and practice with the specific methods for this review) screened the titles and abstracts of all search results to eliminate clearly unrelated citations. After preliminary screening, two senior study staff independently screened the remaining records for eligibility. These assessments were merged and discrepancies discussed until consensus was reached. Following this process, citations appearing to fit the inclusion criteria were retrieved and read thoroughly. Once a complete list of eligible articles was compiled, two trained staff independently abstracted the relevant data from the studies using a highly‐detailed standardized form with fifteen content sections: (1) citation information, (2) inclusion criteria, (3) study methods, (4) study population characteristics, (5) setting, (6) sampling strategies, (7) study design, (8) unit of analysis, (9) attrition rates, (10) study group (arms or comparison populations), (12) intervention specific questions, (13) outcome measures, (14) outcome results, (15) additional information (e.g. costs and limitations).
All behavioral, biological, or psychosocial outcome variables reported in each study were recorded; however, only outcomes for which there is a pre/post test or multi‐arm comparison were extracted in detail. Eligible outcome results were reported in a league table format and included the following: (1) the statistical analysis used, (2) the effect size and base rate, (3) the independent variables analyzed, (4) follow‐up times (if applicable), (5) the confidence interval and/or P value, (6) the page number where the results are located, and (7) any additional information deemed of importance. After the two staff members independently coded a study, they compared their coding forms and discussed any discrepancies in data abstraction. If no resolution could be reached, they discussed the issue with a member of the senior project staff until all differences were resolved. We contacted authors if certain aspects of studies needed further clarification. Once resolution was completed, the two data abstractors created a final coding form, and all data were entered into a statistical database (SPSSTM, Chicago, IL) for analysis.
Assessing Study Rigor
To standardize comparisons of rigor across studies, we used a rigor table previously developed for the synthesis project. This table recorded the following aspects related to study rigor: (1) Prospective Cohort analyses presented data from the same subjects followed over time; (2) Control or comparison groups compared those who received VCT to those who did not (including a more‐versus‐less intensive intervention); (3) Pre/post intervention data assessed participants before and after receiving VCT; (4) Random assignment of treatment groups of study subjects; (5) Random selection of subjects for assessment; (6) Attrition determined if the follow‐up rate was 80% or more; (7) Comparison groups matching assesses if there were statistically significant differences in socio‐demographic variables across study arms; and (8) Comparison group matching on outcome measures assesses whether studies had a statistically significant baseline difference in study outcomes. For articles reporting the results of randomized controlled trials, risk of bias was assessed using the Cochrane Collaboration’s tool for assessing risk of bias (Cochrane Handbook, chapter 8.5 – Higgins & Green, 2009).
Meta‐analytic Methods
Standard meta‐analytic methods (Copper 1994) were used to standardize effect sizes of study outcomes that were comparable across studies using the software package Comprehensive Meta‐Analysis (CMA) V.2.2 (CMA 2005). We assessed a study’s eligibility for inclusion in the meta‐analysis based on a set of meta‐analytic guidelines for social and behavioral interventions developed for the project. Effect estimates from included studies were converted to the common metric of an odds ratio for studies that compared two groups (either intervention/control groups or before/after groups) using dichotomous outcome variables. If outcomes were presented as continuous variables, the effect size was entered into CMA and standardized as an odds ratio. If studies presented categorical data for an outcome of interest, the outcome was dichotomized when possible to utilize the common metric of the odds ratio. For example, if a study reported the number of sexual partners in the last year as 0‐1, 2‐3, or >3, the categories were collapsed into 0‐1 or >1. When studies reported an outcome of interest in multiple ways, such as providing information on consistent condom use with primary partners and non‐primary partners, the two outcomes were combined so that a singular effect size for consistent condom use reported among all partners could be utilized in meta‐analysis. When studies presented results from more than one follow‐up time period, data from one time point was selected for inclusion in meta‐analysis based on its similarity to the follow‐up times utilized in other included studies. For all analyses, random‐effects models were used because they allows for uncertainty introduced by combining studies with non‐identical interventions by incorporating between study variability into the computations (Hedges 1998). When using random‐effects models, studies are weighted by the inverse of their total variance, which accounts for within study variance as well as an estimation of between‐study variance (Hedges 1998). Sensitivity analyses were also conducted using CMA V.2.2. to assess the impact of removing one study on the overall effect.
Because this review built on the findings of the Denison 2008 review, we employed similar meta‐analytic methods and included the same outcome measures in meta‐analysis: number of sex partners and condom use, which is the inverse of the unprotected sex variable used in the Denison 2008 review. However, since slightly different inclusion criteria and meta‐analytic methods were used, not all studies meta‐analyzed in the Denison review were included in this update. Specifically, studies that presented correlated data, such as in pre/post study designs, had to present statistics accounting for this correlation that could be converted to the standard metric of the odds ratio; otherwise, these studies were excluded from meta‐analysis. Only one study originally included in the Denison 2008 review, Kawichai 2004, was excluded from meta‐analysis for this reason. Several other outcomes were considered for meta‐analysis, including HIV incidence, STI incidence/prevalence, and positive and negative life events. However, there were few studies that reported on these outcomes, and the outcome measures were deemed too heterogeneous to be synthesized. For example, outcomes for STI prevalence ranged from reporting genital ulcers or discharge (Matambo 2006) to reporting symptoms of any STI in the previous 6 months (Arthur 2007) to the STI incidence rate ratio (Machekano 1998). Therefore, the outcomes of HIV incidence, STI prevalence/incidence, and positive and negative life events were assessed qualitatively. Sub‐group analyses by modality of VCT were not feasible given that the majority of included studies took place in a clinic setting. Sub‐group analyses based on gender and HIV status were possible and the results of these meta‐analyses are presented below.
Results
Description of studies
After searching the literature, 2808 records were identified, 2668 were eliminated during initial screening, and 85 additional records were eliminated after a second round of screening. The full texts of the remaining 55 articles were obtained to ascertain their eligibility. In total 19 articles met all inclusion criteria for the review. Among these 19 articles, two articles (Sherr, 2007; Cremin, 2010) analyzed data from the same cohort study in eastern Zimbabwe. To avoid double‐counting data from the same population, we only included the later article, Cremin, 2010, because this article provided data from a longer period of follow‐up (from 3 time points instead of 2). Additionally, the later article recalculated the statistical analyses to take into account the degree of change between behavioral outcomes over time and the analyses were stratified by HIV infection status to provide a more accurate comparison group (Cremin, 2010). Importantly, the earlier article (Sherr, 2007) found that VCT was associated with increased risk behavior among individuals who tested HIV‐negative in terms of numbers of partnerships in the last month, the last year, and in concurrent partnerships. However, in the revised analyses, no increase in risk behavior was found for individuals who tested HIV‐negative.
Two additional articles (Matovu, 2005; Matovu, 2007) analyzed data from the same cohort of participants in Rakai, Uganda; however, the 2007 article included a comparison of participants who had repeatedly gone through VCT as compared to first‐time acceptors and those who refused. Since our research question does not address repeat testing and counseling, we choose to only include the Matovu et al., 2005 study as it was most comparable to the other studies included in the review.
VCT 2000 and Grinstead, 2001 utilized data from the same randomized trial, but since the two articles assessed different behavioral outcomes, results from both articles were included in the review. Each article presents outcomes separately for those who were randomized to individual VCT and those who were randomized to couples VCT; therefore, we considered individual VCT and couples VCT to represent two separate study populations and each was considered a separate study. Additionally, these studies took place in three locations: Trinidad, Tanzania, and Kenya. Although Trinidad is currently considered a high‐income country (World Bank 2010), it was considered a middle‐income country when the studies took place in 1995‐1998; therefore, we included these two studies in the review.
After these decisions were made, 17 studies from 17 articles were included in the review (Figure 1). Nine of these studies were originally identified in the Denison 2008 review; the remaining eight studies were found during the updated search.
1.

Study flow diagram.
Of the 17 articles included in the review, 10 took place in Sub‐Saharan Africa, including four in Zimbabwe (Cremin, 2010; Machekano, 1998; Corbett, 2007;Matambo, 2006), two in Uganda (Matovu, 2005;Roth, 2001), two in Zambia (Allen, 2003, Bakari, 2000), one in Mozambique (Mola, 2006), and one in Kenya (Arthur, 2007). Two studies, one among individuals and one among couples, were multi‐site, with locations in Trinidad, Kenya, and Tanzania (VCT 2000; Grinstead, 2001). The remaining five studies took place in the following locations: two in China (Chen, 2007; Wu, 2005), two in Thailand (Kawichai, 2004), and one in Guatemala (Samayoa, 2010). Most studies (N=12) took place in an urban location, while three took place in rural settings (Cremin, 2010;Wu, 2005;Matovu, 2005), one took place in a peri‐urban setting (Kawichai), and one took place in a mixed setting involving both urban and rural locations (Arthur). Combined, the 17 studies included a total baseline population of 40,309 participants. Study designs included one individual‐randomized trial (VCT 2000; Grinstead, 2001), two group‐randomized trials (VCT 2000; Grinstead, 2001; Corbett, 2007;), three prospective cohort studies (Matovu, 2005; Cremin, 2010;Mola, 2006), eight before/after studies with no comparison group (Allen, 2003; Roth, 2001; Kawichai, 2004; Arthur, 2007;Chen, 2007; Matambo, 2006;Samayoa, 2010; Wu, 2005), one time‐series study (Machekano, 1998), and two cross‐sectional studies (Bakari, 2000;Muller, 1995).
Nine included studies targeted sexually active adult men and women in the general population (VCT 2000; Grinstead, 2001; Muller, 1995; Kawichai, 2004; Matovu, 2005; Arthur, 2007; Cremin, 2010; Mola, 2006;Samayoa, 2010). Five studies focused on couples (VCT 2000; Grinstead, 2001;Bakari, 2000; Wu, 2005; Allen, 2003), and three studies focused on employees (Machekano, 1998; Matambo, 2006; Corbett, 2007). One workplace‐based intervention in Zimbabwe included only male employees (Machekano, 1998), whereas the other workplace‐based interventions included both male and female employees (Corbett, 2007; Matambo, 2006). Only one study focused on injection drug users (Chen, 2007). One study (Muller, 1995) focused solely on behavior among individuals who tested HIV‐positive, whereas the remaining studies included both HIV‐positive and HIV‐negative participants. Table 1 presents study locations, target populations, participant demographics, and intervention descriptions for the included studies.
1. Study Description Table.
| Study | Setting | Population Characteristics | Intervention Description | Study Design | Outcomes Used in Meta‐Analysis |
| Allen et al., 2003 | Zambia Lusaka Clinic‐based VCT |
HIV serodiscordant couples Gender: 50% female; 50% male Age: |
Couples recruited from a same‐day VCT center. The same‐day couples’ VCT services included free treatment for syphilis, condom skills training, and free condoms. |
Cohort study with before‐after data presented on extramarital sex among male and female participants. Individual unit of analysis. Non‐random selection of participants. | none |
| Arthur et al., 2007 | Kenya Thika & Nairobi Districts Clinic‐based VCT |
At least 18 years old or married, never tested for HIV and regular partner never tested. Gender: % male: 52% % female: 48% Age: |
The new free counselling and simple rapid on‐site testing service used existing infrastructure to mirror future government services. Each had one project‐salaried counsellor, with testing performed by nurses and counsellors. Condom demonstrations and free condoms were provided. Counselling sessions used a client‐centred approach involving personalized, interactive counselling, and included risk assesment and coping strategies. | Single‐arm prospective cohort study with before‐after design. Assessments took place at baseline (N=540) and at follow up (6‐months; mean=7.5 months; N=401) post‐intervention. Participants were selected based on the three health clinics which were selected systematically. |
Condom use: Unprotected sex with any partner type (in the analysis, this outcome was flipped to reflect protected sex). These results were calculated using general estimating equations adjusted for baseline explanatory factors including clinic site, gener, age, socioeconomic status, education, and HIV status. |
| Bakari et al., 2000 | Zambia Lusaka Clinic‐based VCT |
Couples and individuals invited and/or attending VCT clinics Gender: not reported Age Range 16‐56 |
Zambia‐UAB HIV research project (ZUHRP) invited couples for same‐day HIV counseling and testing. Participants were also recruited from Kara Counseling without same‐day test results. | Cross‐sectional data analyzed using cross‐tabulations stratified by four categories: a) couples invited for same‐day VCT at ZUHRP but did not attend; b) couples who attended ZUHRP but chose not to test; c) couples who attended ZUHRP and were tested; and d) individuals tested at Kara counseling (results were not same‐day results). Random selection of participants. Individual unit of analysis. | none |
| Chen et al., 2007 | China Guangxi Province Clinic‐based VCT |
Adult IDUs in southern China Gender: 89.8% male 10.2% female Age: |
Participants received HIV pre‐test counseling, HIV testing, post‐test counseling and referral. Pre‐test counseling was conducted one‐on‐one and covered fundamentals of AIDS knowledge, risk reduction and demonstration of effective use of bleach and condoms. Post‐test counseling was conducted after participant finished the HIV testing and was informed of his/her HIV antibody status. Post‐test counseling was tailored to serostatus and consissted of a risk reduction “booster” and information about referral services. HIV positive participants received more intensive information regarding referral services. | Before‐After study design with no control group. Assessments took place at baseline (N=226) and at 3 months (N=217) post‐intervention. Participants were non‐randomly selected. |
none |
| Corbett et al., 2007 | Zimbabwe Harare Employment‐based VCT |
Employed HIV‐negative adults in Africa. Gender: I: 90.5% male; 9.5% female C: 88.4% male; 11.6% female Age: |
Participants received either Intensive VCT or standard VCT. Intensive VCT included pre‐test counseling, risk asssessment, testing, results and pre‐test counseling with risk reduction planning all on the same day. Follow‐up counseling and repeat VCT were available. Standard VCT participants received pre‐test counseling and risk assessment and were then given a pre‐paid voucher to a chain of free‐standing VCT providers. All participants had access to free condoms. | Randomized group trial study design. Assessments took place at baseline (N=4316) and at approx. 2 years (N =2966) post‐intervention. Participants were non‐randomly selected. |
none |
| Cremin et al., 2010 | Zimbabwe Manicaland province of Eastern Zimbabwe Mobile VCT |
Zimbabweans in rural areas and small towns. Gender: 42% male 58% female Age: |
Participants were offered free HIV counseling and testing at each survey. This service was available at a mobile clinic which was present within the study site at the time the survey was being conducted. Participants receiving VCT from the research program did so after completing the survey questionnaire. During the baseline and second surveys, VCT clients were asked to return 2 weeks after testing, to receive their results and post‐test counseling. Counseling was provided by trained male and female nurse counselors. | Prospective cohort study. Assessments taken place at baseline (N= 8,273) and at 3 years (N= 6,559) and 5 years (N=12,553) post‐intervention. Participants were non‐randomly selected. |
Condom use: Consistent condom use in past 2 weeks with regular and non‐regular partners. Results obtained through generalized estimating equations adjusting for age, calendar year, and marital status. Number of partners: Sexual partner in the past month |
| Grinstead et al., 2001 |
Nairobi, Kenya; Dar es salaam, Tanzania; and Port of Spain, Trinidad. Clinic‐based VCT |
Individual and couples seeking VCT at a free‐standing VCT center | VCT based on the CDC client‐centered model. Counseling included personalized risk assessment, development of a personalized risk‐reduction plan, role plays and condom demonstrations. Test results available 2 weeks after the blood draw. The participants in the health information (HI) arm watched a 15 minute video and participated in a group discussion about HIV transmission and condom use led by a health information officer. At the first follow‐up HI participants were offered VCT. | Randomized controlled pre‐/post trial comparing amount of sex and amount of unprotected sex at the 1st follow‐up among adults who received VCT to adults who attended the HI session. Individual unit of analysis. Non‐random selection of participants. | none |
| Kawichai et al., 2004 | Thailand Chiang Mai City Clinic‐based VCT |
Thai citizens living in Chiang Mai between the ages of 19‐35 years. Gender: 41% male 59% female Age: |
Group pre‐test counseling provided by trained counselors at community sites. Topics covered include HIV/STDs, routes of infection, risk assessment, risk reduction and the meaning of an HIV test. After blood draw the questionnaire was administered. Participants received confidential post‐test counseling individually 2 to 3 weeks later at health clinics or hospitals. | Cross sectional analysis comparing risk behaviors among I=previously tested participants vs. C=untested participants, measured at baseline. Individual unit of analysis. Non‐random selection of participants. |
none |
| Machekano et al., 1998 |
Zimbabwe Employment‐ based VCT |
Male factory workers 100% Male |
Pre‐test counseling, provided at the factories during the study recruitment, consisted of individual risk assessment, meaning of the test results and availability of treatment and support. Subjects encouraged to obtain their test result from a project clinic located off factory premises 2 weeks after the blood draw. STD treatment and condoms provided free of charge. Post‐test counseling covered topics such as the meaning of test results and disclosure. | Time series study design comparing HIV and STI incidence between: a) men who returned for their test results at the project clinic and men who did not come in for their test results; and b) before and after data among men who received their HIV test result. Analysis conducted on subjects who were HIV‐negative at the time of enrollment. Factories were visited every six months to repeat serological tests and interviews. Individual unit of analyses. Non‐random selection of participants. | none |
| Matambo et al.,2006 | Zimbabwe Harare Employment‐based VCT |
Employed individuals in Harare Gender: 87% male 13% female Age: |
Participants received pretest counseling, including risk assessment and a risk reduction plan. Same‐day results and posttest counseling were provided. For those with negative test results, posttest counseling routinely included discussion of the window period phenomenon, advice on how to tell sex partner(s) and ask them to consider voluntary counseling and testing as well, and advice on reducing their risk of acquiring HIV in the future. At the 3‐month follow‐up, a questionnaire, including a repeat risk assessment, was administered by the clinic nurse. | This was a before and after study. Assessments took place at baseline (N=388) and at 3 months (N=388) post‐intervention. Participants were non‐randomly selected. |
none |
| Matovu et al., 2005 | Uganda Rakai Home‐based VCT |
HIV negative adults in rural Uganda Gender: 57% female Ag range 15‐49 |
Participants were interviewed and had a blood draw, followed by pre‐test counseling. Participants could request free VCT as individuals or couples, either at the time of the interview or during the inter‐survey period. Participants who choose to learn their HIV status received post‐test counseling and verbally told their HIV test result. | Prospective cohort of initially HIV‐negative respondents who completed the baseline interview in 1999 and the follow‐up interview in 2000. All participants received pre‐test counseling and had their blood drawn. Authors compared respondents who I=accepted VCT (received their VCT test result) vs. C= did not accept VCT (respondents who did not receive their VCT test result) in terms of number of sexual partners and condom use behaviors at baseline and follow‐up. Census sampling. |
Condom use: Condom use comparing consistent use to anything less than consistent use Number of partners: Dichotomized at 0‐1 partner vs. ≥2 partners |
| Mola et al., 2006 |
Mozambique Beira, Chimoio Clinic‐based VCT |
Individuals seeking VCT in central Mozambique Gender: I: 52% male C: 48% male Age: C: 31% < 21 years, |
Voluntary counseling and testing for HIV (no detailed description of the intervention provided) |
Prospective cohort study. Assessments took place at baseline (N=1220), 4 months (N=1052), and 6 months (N=954 post‐intervention. Participants were not randomly selected to participate. | Condom ue: Sometimes/always condom use |
| Muller et al., 1995 | Thailand Bangkok Clinic‐based VCT |
Adults seeking VCT Gender: 17% female 83% male Age: 15 to 66 years |
HIV positive patients, who received their test result at the anonymous clinic (AC), were referred to the immune clinic (IC) for care and treatment after the post‐test counseling. This outpatient clinic has cared for patients with HIV/AIDS since 1985 and newly attending patients receive counseling by specially trained Red Cross health workers. | Cross‐sectional study comparing condom use and number of sex partners among HIV infected men and women who had previously sought VCT on average 23 months earlier and were attending an immune clinic to HIV infected age and gender‐ matched controls receiving VCT for the first time. Individual unit of analysis. Non‐random selection of participants. |
Condom use: Condom use during last 3 sexual encounters (comparing always use to less than always use) Number of partners: Number of sex partners in past 12 months (dichotomized at 0‐1 partners vs. ≥2 partners) |
| Roth et al., 2001 |
Rwanda Kigali Clinic‐based VCT |
Male cohabiting partners of women Gender: 100% male Age (mean): |
Male counseling for the partners of previously tested women. Each man watched a video on HIV risk/safer sexual practices and participated in small group discussions led by trained social workers. Trained counselors gave individuals their HIV test results during a return visit. | Pre‐/post intervention trial comparing condom use among men before and after having received the male counseling intervention. Individual and couple unit of analyses. Non‐random selection of participants. | None |
| Samayoa et al., 2010 | Guatemala Guatemala City Clinic‐based VCT |
Adults seeking HIV test in Guatemala Gender: 43.1% male 56.9% female Age range: 18‐83 years |
Voluntary pre‐test and post‐test counseling regarding HIV infection, transmission, prevention, and interpretation of HIV test results. Those who tested positive received psychological support; those who tested negative received further behavioral recommendations to reduce likelihood of infection. | Before‐After (stratified by HIV status) study. Assessments took place at baseline (N=144) and at 3 months (N=90). Non‐random selection of participants |
Number of partners: Number of sexual partners in past 3 months (reported mean and standard deviation) |
| VCT Efficacy Study Group, 2000 |
Nairobi, Kenya; Dar es salaam, Tanzania; and Port of Spain, Trinidad. Clinic‐based VCT |
Individual and couples seeking VCT at a free‐standing VCT center Gender‐Individuals 51% female 49% male Gender‐ Couples |
VCT based on the CDC client‐centered model. Counseling included personalized risk assessment, development of a personalized risk‐reduction plan, role plays and condom demonstrations. Test results available 2 weeks after the blood draw. The participants in the health information (HI) arm watched a 15 minute video and participated in a group discussion about HIV transmission and condom use led by a health information officer. At the first follow‐up HI participants were offered VCT. | Randomized controlled pre‐/post trial. Participants were randomly assigned to the study arms as individuals or couples. HI participants were offered VCT during the 1st follow‐up visit (2nd follow‐up data not shown). Because there was no effect of study site on intervention‐group outcome, data were pooled for all analyses. Individual unit of analysis. Non‐random selection of participants. |
Condom use: Unprotected sex with primary and non‐primary partners (outcome flipped to reflect protected sex) |
| Wu et al, 2005 |
China Townships in three counties in Fuyang city of Anhui province: Yingzhou, Lingquan, and Jieshou. Clinic‐based VCT |
Couples in mandatory premarital counseling Gender: 50% males; 50% females Age: not reported |
The intervention included the provision of information about HIV/AIDS, including methods of transmission and strategies to protect oneself and one’s partner from being infected. The program included a demonstration of condom use with a model. Each participant was given a risk–profile questionnaire to complete, which included a list of possible HIV exposures. The counseling sessions and questionnaires were administered to each person separately to ensure confidentiality. All participants were informed their test results would be made available to their partners only if they so desired. Local health professionals were trained to conduct all parts of the study program, including providing information about HIV/AIDS, obtaining blood samples for HIV testing, carrying out the rapid test, and providing pretest and posttest counseling for both HIV–negative and –positive individuals. | Before and after study with no control group. Assessments at baseline (N=319), and one year (N=319). Random selection of 25% of participants for one year follow up. |
none |
Risk of bias in included studies
Risk of Bias of Included Studies
Risk of bias was assessed for the three articles (3 studies in total) that utilized a randomized study design (VCT 2000; Grinstead, 2001; Corbett, 2007). In all studies, participants and personnel were not blinded as the intervention arms included activities, such as VCT or health information, that were impossible to conceal. Due to the nature of the interventions, we do not believe the lack of blinding greatly influenced the study outcomes. In all five studies, it is unclear whether interviewers collecting behavioral information from participants were blinded; however, Corbett, 2007 states that lab staff members were blinded during specimen analysis. The VCT Efficacy studies (VCT 2000; Grinstead, 2001) showed low risk of attrition bias and selective reporting bias, whereas Corbett, 2007 demonstrated a risk of attrition bias as attrition rates differed between intervention and comparison groups. Additionally, Corbett, 2007 was not powered to detect differences in HIV incidence, which was the main outcome presented in the study. Risk of bias assessments are presented under the Characteristics of Included Studies.
Quality of Evidence
For the remaining 15 studies that utilized non‐random study designs, the quality of the evidence varied. All but three studies (Kawichai, 2004; Bakari, 2000; Muller, 1995) studied a cohort of participants over time. Seven studies included some type of a control or comparison group (Muller, 1995; Kawichai, 2004; Bakari, 2000; Matovu, 2005; Mola, 2006; Cremin, 2010; Machekano, 1998) and 12 studies included data from pre‐ and post‐intervention (Allen, 2003; Matovu, 2005; Mola, 2006, Cremin, 2010; Corbett, 2007; Machekano, 1998; Arthur, 2007; Samayoa, 2010; Chen, 2007; Wu, 2005; Roth, 2001). Only two studies randomly selected individuals for assessment (Bakari, 2000; Matovu, 2005). Among studies that followed one group of people through time, three studies (Wu, 2005; Machekano, 1998; Chen, 2007) reported an overall follow‐up rate of 80% or greater. Quality assessment results are presented in Table 2.
2. Quality Assessment (All Studies).
| Study | Cohort | Control or comparison group | Pre/post intervention data | Random assignment of participants to intervention | Random selection of participants for assessment | Follow‐up rate of 80% or more | Comparison groups equivalent on socio‐demographics | Comparison groups equivalent at baseline on outcome measure |
| VCT Efficacy Group, 2000‐indviduals | yes | yes | yes | yes | no | yes | yes | no |
| VCT Efficacy Group, 2000‐couples | yes | yes | yes | yes | no | yes | yes | no |
| Grinstead et al., 2001‐individuals |
NA | yes | no | yes | no | NA | yes | NR |
| Grinstead et al., 2001‐couples | NA | yes | no | yes | no | NA | yes | NR |
| Muller et al., 1995 | no | yes | no | no | no | NA | yes | NA |
| Kawichai et al., 2004 Analysis 1 |
no | yes | no | no | no | NA | NR | NA |
| Allen et al., 2003 | yes | no | yes | no | no | NR | NA | NA |
| Bakari et al., 2000 | no | yes | no | no | yes | NA | NA | NA |
| Matuvo et al., 2005 | yes | yes | yes | no | yes a | no | NR | yes |
| Mola et al. (2006) | yes | yes | yes | no | no | no | no | no |
| Arthur et al., 2007 | yes | no | yes | no | no | no | NA | NA |
| Samayoa et al., 2010 | yes | no | yes | NA | no | no | NA | NA |
| Cremin et al., 2010 | yes | yes | yes | no | no | NR | NR | NR |
| Corbett et al., 2007 | yes | yes | yes | yes c | no | no | yes | yes |
| Machekano et al., 1998 | yes | yes | yes | no | no | yes | NR | NR |
| Matambo et al.,2006 | yes | no | yes | NA | no | NR | NA | NA |
| Chen et al., 2007 | yes | no | yes | no | no | yes | NA | NA |
| Wu et al, 2005 | yes | no | yes | no | yes d | yes | NA | NA |
| Roth et al., 2001 | yes | no | yes | no | no | NR | NA | NA |
|
a Census sampling was used b Pre/post intervention data is available for only one of the primary outcomes measured c Random assignment was by group, not individual participants d The intervention was mandatory for all couples seeking a marriage license, but the participants who were followed‐up were randomly selected | ||||||||
Publication Bias
Funnel plots were constructed for the two outcomes meta‐analyzed: condom use and number of sex partners (Figure 2 and Figure 3). Based on the symmetry present in both funnel plots, there appears to be no evidence of substantial publication bias.
2.

Funnel Plot for Condom Use:A plot of effect estimates (log odds ratios) against their standard errors
3.

Funnel Plot for Number of Sex Partners: A plot of effect estimates (log odds ratios) against their standard errors
Effects of interventions
Descriptions of Interventions
Despite the various implementation modalities for VCT, including clinic‐based, mobile, and home‐based approaches, the vast majority of included studies were clinic‐based (VCT 2000; Grinstead, 2001; Muller, 1995; Kawichai, 2004; Allen, 2003; Bakari, 2000; Mola, 2006; Arthur, 2007; Wu, 2005; Samayoa, 2010). One study in China was specifically geared toward couples obtaining a marriage license (Wu, 2005). Although HIV testing and counseling is currently not required in China, this program sought to test the feasibility of integrating VCT into the existing required premarital counseling and health exams (Wu, 2005). One study, Matovu et al., 2005, offered VCT in the participants’ homes or in a venue of their choosing; however, the article did not report how many participants received VCT in their home versus at a clinic or other setting (Matovu 2005). Cremin et al., 2010 provided mobile VCT services; however, participants who reported having had VCT through other means (e.g. at government clinics or non‐governmental organizations) were categorized as having “received VCT.” The article does not specify the percentage of participants who received VCT through mobile services and the percentage of those that received VCT through other modalities (Cremin 2010). Three studies (Machekano, 1998; Matambo, 2006; Corbett, 2007) offered VCT in worksites. The remaining 12 studies offered clinic‐based VCT.
The length of time between being tested for HIV and receiving test results varied across studies. Only seven studies reported that participants received same‐day HIV test results (Allen, 2003; Bakari, 2000; Arthur, 2007; Chen, 2007; Corbett, 2007; Matambo, 2006; Wu, 2005). However, many studies took place prior to the availability of rapid HIV testing.
Effects of Interventions‐qualitative synthesis
HIV incidence
Three studies measured HIV incidence as a primary outcome (Corbett, 2007; Machekano, 1998; Matovu 2005). Corbett, 2007 utilized data from a cluster‐randomized trial among 22 businesses in Harare, Zimbabwe to assess HIV incidence among employees in businesses randomized to receive rapid on‐site VCT as compared to employees in businesses randomized to receive paid vouchers for VCT with an external provider. The results showed no statistical difference between unadjusted HIV incidence in the intervention group (1.37/100 person‐years) as compared to the control group (0.95/100 person‐years) after the completion of follow‐up (average 1.7 years between HIV tests). The adjusted incidence rate ratio was 1.49 (95% CI 0.79‐2.80). However, uptake of VCT was quite different across sites; in the rapid, on‐site group, VCT uptake was 70.7% compared to only 5.2% in the group receiving off‐site vouchers. Machekano, 1998 (N=1683) examined HIV incidence among a cohort of male factory workers in Harare, Zimbabwe and observed that participants who completed VCT and decided to receive their test results had a higher HIV incidence, IR= 3.29 (2.31‐4.56) per 100 person‐years, as compared to those who chose not to receive their test results, IR= 1.76 (1.01‐2.86) per 100 person‐years, IRR= 1.87 (1.01‐3.61, p=0.030). However, this study also found that among those who received their results, HIV incidence was lower following the period after obtaining the results, IR=3.04 (1.86‐4.70) per 100 person‐years as compared to the period prior to obtaining results, IR=4.82 (2.75‐7.81) per 100 person years, IRR= 0.63 (0.31‐1.30, p=0.180). Matovu, 2005 followed a cohort of participants (n=10,694) to assess their willingness to participate in VCT and compared HIV incidence among participants who accepted VCT to those who refused. This study observed no significant difference between those who accepted VCT (IR= 1.6/100 person‐years) and those who refused (IR= 1.4/100 person‐years), p=0.60.
STI incidence/prevalence
Five studies measured STI prevalence or STI incidence (VCT 2000—2 studies; Arthur, 2007; Machekano, 1998; Matambo, 2006). Arthur, 2007 (N=401) found that the proportion of participants reporting any STI symptom decreased 6 months after receiving VCT (15.3%) as compared to baseline (39.7%), p<0.02. Matambo, 2006 (N=366) observed no significant pre‐to post‐intervention difference in participants reporting a genital ulcer or discharge (1.3% and 1.6%, respectively, p=0.73). Machekano, 1998 (N= 2060) detected no pre/post difference in STI incidence among participants who completed VCT and received their test results (IRR=1.30, 95% CI 0.95‐1.80, p =0.100); however, the authors did find that subjects who went through VCT and received their test results had a significantly higher incidence of STIs than those who went through VCT but chose not to receive their test results (IRR=4.37, 95% CI=3.47, 2.51‐4.89, p=0.001).
Positive and negative life events
Only three studies (Grinstead, 2001—2 studies; Arthur, 2007) presented outcomes related to positive and negative life events associated with VCT. Grinstead, 2001 (n= 3120 enrolled as individuals, 1173 enrolled as couples) found that among participants receiving individual and couples VCT, positive life events were relatively common, such as strengthening a sexual relationship (42% overall) and negative life events, such as physical abuse (4.5% overall), were relatively rare. The most common negative life event was the break‐up of a sexual relationship (27% overall). Arthur et al., 2007 (n=401) found no significant changes in the rates of life events following VCT, regardless of HIV status. Both studies (Grinstead, 2001; Arthur, 2007) found that rates of HIV serostatus disclosure were significantly higher among those who tested HIV‐negative as compared to those who tested HIV‐positive.
Effects of Interventions‐ Meta‐Analysis
Description of study outcomes used in meta‐analysis
Meta‐analysis was conducted on two primary outcomes: number of sexual partners and condom use. The VCT Efficacy Study (VCT 2000) measured unprotected sex with primary and non‐primary partners among individuals and unprotected sex with enrollment partner and with non‐enrollment partners among couples. To include this outcome in meta‐analysis, the two effects were combined using CMA to obtain one overall effect. Muller, 1995 and Matovu, 2005 differentiated between consistent, inconsistent, and no condom use. To dichotomize this outcome for meta‐analysis, we compared consistent condom use to inconsistent or no condom use. Mola et al., 2006 contained several different condom use outcomes including: condom use at last sex, condom use at last sex among those reporting having had sex with friends/prostitutes in the last month and always/sometimes condom use. We chose to include the effect size for always/sometimes condom use as we felt this was the most comparable outcome to the other included studies. Additionally, the VCT Efficacy Study (VCT 2000) measured unprotected sex at two time‐points—the first follow‐up visit oc2curring on average 7.3 months after baseline and the second follow‐up visit occurring on average 13.9 months after baseline. Mola, 2006 also included two follow‐up times: 4 and 6 months after receiving the intervention. To have the most accurate comparison, we chose to use the first follow‐up time for the VCT Efficacy study (VCT 2000) (avg. 7.3 months after baseline) and the second follow‐up time for Mola, 2006 (6 months after baseline).
Condom use/protected sex
Thirteen studies reported condom use or unprotected sex as a primary outcome (Allen, 2003, Arthur, 2007; Chen, 2007; Cremin, 2010; Kawichai, 2004; Matambo, 2006; Matovu 2005; Mola, 2006; Muller, 1995; Roth, 2001; Samayoa, 2010; VCT 2000—2 studies). For studies that reported unprotected sexual activity (VCT 2000; Arthur, 2007), we took the inverse of this outcome to make it comparable to condom use outcomes presented in other studies. Of studies reporting either condom use or protected sex, seven were considered eligible for meta‐analysis: VCT Efficacy 2000 (2 studies), Muller 1995; Matovu 2005; Mola 2006; Arthur 2007; Cremin 2010. Chen 2007, Kawichai 2004, Matambo 2006, Roth 2001, and Samayoa 2010 were excluded from meta‐analysis because these studies presented pre/post analyses that did not account for correlation within the data, and we were unable to convert results into the standard metric of the odds ratio. Allen 2003 was excluded from meta‐analysis because not enough data were reported (e.g. study size and exact percentages) to be able to convert results into an odds ratio. After disaggregation by sex and HIV status within the results of these seven studies, a total of 14 discrete effects were used to calculate an overall effect size estimate (N= 23923). The random‐effects pooled odds ratio across all studies showed a positive but not statistically significant effect of VCT on condom use (OR: 1.39, 95% CI: 0.97‐1.99, p=0.076). There was significant heterogeneity, Q=94.10, p<0.001, which indicates the findings across studies were inconsistent. When stratified by gender, the random‐effects pooled odds ratio for condom use was not statistically significant for either men (OR: 1.31, 95% CI: 0.64‐2.67, p=0.46) or for women (OR: 1.17, 95% CI: 0.76‐1.80, p=0.49). However, when stratified by HIV status, the random‐effects pooled odds ratio for HIV‐positive participants, combining males and females, was statistically significant (OR=3.24, 95% CI: 2.29‐4.58, p<0.001). These results suggest that participants who received VCT and were given positive results had greater odds of using condoms than HIV‐positive participants who did not receive VCT. However, these results should be interpreted with caution as this analysis contained only two studies (N=8873) (Muller 1995; Cremin 2010). Since there was only one study (Cremin 2010) that provided results separately for HIV‐negative participants, this outcome could not be meta‐analyzed.
Only one study, Matovu, 2005, found that participants who received VCT had reduced odds of condom use as compared to participants who did not receive VCT. Self‐selection bias was an issue in this study as participants either agreed to receive VCT or refused; there was no randomization. The authors suggest that condom users may exhibit more risky behaviors, leading to increased fear they are HIV infected and discouraging them from accepting VCT (Matovu 2005). Cremin, 2010 also showed that the odds of condom use were reduced among HIV‐negative female participants who received VCT compared to those who did not, especially with non‐regular partners; however, the confidence interval for this outcome is extremely large, suggesting a high degree of imprecision and a non‐significant effect. Results from all analyses related to the condom use/protected sex outcome are detailed in Figure 4 and Table 3.
4.
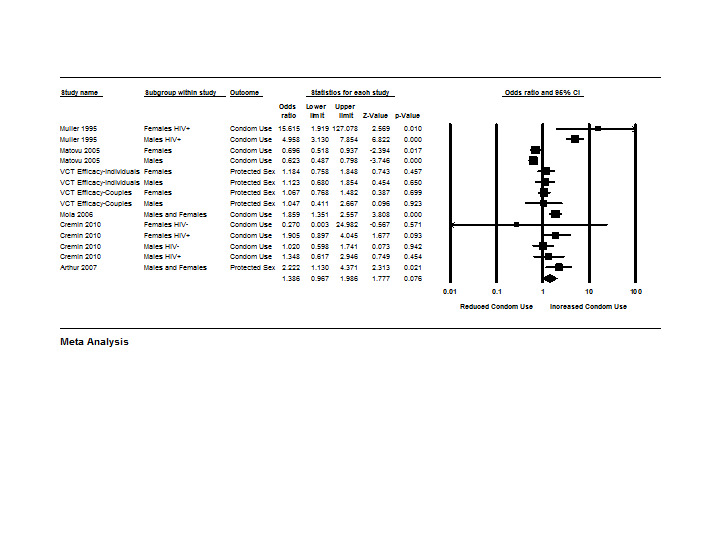
Meta‐analysis: Random effects model—Condom use/protected sex
3. Summary of meta‐analysis results stratified by gender and HIV status.
| Number of studies | Odds ratio | 95% confidence interval | Q‐statistic | p‐value for Q‐ statistic | I‐squared | |
| Condom use/protected sex | ||||||
| Overall condom use/protected sex (all studies) | 7 |
1.39 |
(0.97‐1.99) |
94.10 |
<0.001 |
86.19 |
| Males | 5 | 1.31 | (0.64‐2.66) | 61.24 | <0.001 | 91.84 |
| Females | 5 | 1.17 | (0.76‐1.80) | 16.04 | 0.007 | 68.82 |
| HIV‐positive participants (males and females) | 2 |
3.24 |
(2.29‐4.59)* |
12.19 |
0.007 |
75.39 |
| HIV‐positive males | 2 | 2.69 | (0.75‐9.62) | 7.92 | 0.005 | 87.37 |
| HIV‐positive females | 2 | 4.30 | (0.58‐32.08) | 3.426 | 0.064 | 70.81 |
| Number of sex partners | ||||||
| Overall number of sex partners (all studies) | 5 |
0.69 |
(0.53‐0.90)* |
61.84 |
<0.001 |
83.83 |
| Males | 3 | 0.86 | (0.57‐1.29) | 22.10 | <0.001 | 86.42 |
| Females | 3 | 0.70 | (0.47‐1.04) | 10.11 | 0.018 | 70.33 |
|
HIV‐positive participants (males and females) |
3 |
0.61 |
(0.37‐1.00)* |
16.36 |
0.003 |
75.54 |
| HIV‐negative participants | 2 | 0.90 | (0.77‐1.06) | 0.025 | 0.987 | 0.00 |
*Significant at p<0.05
The VCT Efficacy Study (VCT 2000) was the only randomized controlled trial that reported results on protected sex. For both individual and couples‐based VCT, the results from this trial show that receiving VCT did not have a significant effect on protected sex comparing those who received the intervention to those who did not (VCT Efficacy 2000).
To assess the robustness of these findings, a series of analyses were conducted to determine the impact of removing one study at a time from the meta‐analysis. The overall effect size remained relatively constant except with the removal of the Matovu 2005 study, which was the only that found VCT participants had reduced odds of condom use as compared to those who did not receive VCT. When this study was removed, the random‐effects pooled odds ratio became significant (OR= 1.63, 95% CI 1.16‐2.29, p<0.005).
Number of sex partners
Six studies reported on the number of sexual partners, either comparing the same individuals before‐ and after‐ receiving VCT (Arthur, 2007; Kawichai, 2004; Samayoa, 2010) or comparing intervention groups who received VCT to comparison groups who did not receive VCT (Cremin, 2010; Matovu 2005; Muller, 1995). Of these, five studies were included in the meta‐analysis: Arthur 2007; Matovu 2005; Muller 1995; Samayoa, 2010; Cremin 2010 (N=18573). Kawichai 2004 was excluded from meta‐analysis because results were presented pre‐ and post‐ intervention and could not be converted into the standard metric of an odds ratio. Among the five remaining studies, the overall pooled random‐effects odds ratio was 0.69 (95% CI: 0.53‐0.90, p=0.007), demonstrating that participants who did not receive VCT had significantly higher odds of reporting greater numbers of sexual partners as compared to participants who did receive VCT. The Q statistic, 61.84, was significant (p<0.001), which suggests substantial amounts of heterogeneity between study results. When stratified by gender, the effect of VCT on the number of sexual partnerships became statistically insignificant; the random‐effects pooled odds ratio was 0.86 (95% CI 0.57‐1.29, p=0.46) for males and 0.70 (95% CI: 0.47‐1.04, p=0.08) for females. When stratified by HIV status, the random‐effects pooled odds ratio was 0.61 (0.37‐0.997, p=0.048) for HIV‐positive individuals and 0.90 (95% CI: 0.77‐1.10, p=0.195) for HV‐negative individuals. All individual studies, including all sub‐populations, showed a positive trend toward reduced number of partners for those participants receiving VCT compared to those not receiving VCT; no results suggested that receiving VCT increased the number of sexual partners of participants. Additionally, results from the sensitivity analyses (not shown) found that removing one study at a time from the meta‐analysis resulted in a similar effect size and did affect the significance of the original overall effect. Results for number of partners are presented in Figure 5 and Table 3.
5.

Meta‐analysis: Random effects model—Number of sexual partners
Discussion
This systematic review and meta‐analysis synthesized results across 17 studies and 5 HIV‐related biological, behavioral, and psychological outcomes, including HIV incidence, STI prevalence/incidence, positive and negative life events, condom use/protected sex, and number of sex partners. Overall, there were no significant differences in HIV incidence and STI incidence/prevalence comparing participants who received VCT and those who did not. The two studies reporting on positive and negative life events suggest that individuals who receive VCT do not experience a significant increase in negative life events as compared to those not receiving VCT. However, these studies also found that reported disclosure of HIV status was more common among participants who received VCT and tested negative as compared to those who tested positive. As disclosure of one’s HIV status remains an important strategy for HIV prevention (Medley 2004), VCT counselors should work with clients, especially those who test HIV positive, to discuss ways of disclosing their HIV status to sexual partners, and should refer clients to further counseling if necessary. Mutual disclosure of HIV status is one potential benefit of receiving couples‐based HIV testing and counseling, which is a strategy recommended by the World Health Organization ( WHO 2012) .
For outcomes relating to HIV‐related risk behavior, results from our meta‐analysis demonstrate that people who received VCT were more likely to report reducing their number of sexual partners than those who did not receive VCT. This result stands in contrast to the random‐effects pooled odds ratio in the Denison 2008 review, which found no significant difference in odds of reported number of sex partners comparing those who received VCT to those who did not. However, the current meta‐analysis incorporated only two studies originally included in the Denison 2008 review for this outcome (Muller, 1995; Matovu, 2005) and added three new studies (Arthur, 2007; Samayoa, 2010; Cremin, 2010). Therefore, it is possible that the inclusion of additional studies enhanced the statistical power necessary to detect a significant difference in the reported number of sex partners comparing participants and non‐participants of VCT interventions. This result is encouraging in that it shows VCT can reduce HIV related risk behaviors for all participants, although some behaviors, such as condom use, changed significantly only among those who tested HIV positive.
For the condom use/protected sex outcome, results from the meta‐analysis show that VCT had no significant overall effect. Although VCT was not statistically effective in increasing condom use across all VCT participants, those who received a positive test result were significantly more likely to report condom use than HIV positive participants who did not receive VCT. The significant effect of VCT on condom use for HIV‐positive individuals has been demonstrated in previous findings (Weinhardt 1999) and also among serodiscordant couples (Higgins 1991; Wolitski 1997). The Denison 2008 review also found a significant effect of VCT on increased condom use, including both HIV positive and negative participants. In contrast, this meta‐analysis found an insignificant effect of VCT on condom use when combining both HIV‐positive and HIV‐negative participants. As a potential explanation for this discrepancy, the Denison 2008 review included studies that took place in antenatal settings. In the current review, these studies were moved into a separate category comprising provider‐initiated testing and counseling (PITC), which is being analyzed in another review (Kennedy 2012). Additionally, the current review comprised 4 studies originally analyzed in the Denison 2008 review (VCT Efficacy 2000—2 studies; Matovu 2005; Muller 1995) in addition to including three new studies: Cremin 2010, Arthur 2007, and Mola 2006. Estimated effects from the current review and the previous review (Denison 2008) show similar results, as the odds of condom use/protected sex were increased for VCT participants as compared to non‐participants; however, significant heterogeneity was found in both analyses, suggesting inconsistent results across studies.
Originally this study aimed to assess the behavioral effects of different VCT modalities, including clinic‐, mobile‐, and home‐based testing and counseling. However, since the vast majority of studies took place in clinic‐based settings, differences in effects by modality could not be meta‐analyzed. Although our review contained mostly clinic‐based VCT, some studies demonstrated a much higher uptake of VCT when different modalities were offered. For example, one included study demonstrated that VCT uptake was 70.1% for onsite employment‐based testing as compared to only 5.2% for offering vouchers for an off‐site provider (Corbett 2007). Given the increasing importance of testing and counseling in accessing HIV care and treatment, more research should be conducted to assess which modalities are most successful at both increasing uptake of VCT and influencing behavior.
There are several limitations to this systematic review and meta‐analysis that should be considered. Firstly, it is possible that our extensive search methods failed to identify eligible studies. We sought to minimize this limitation by searching not only electronic databases but also the reference lists of included articles as well as hand‐searching the table of contents of four relevant journals. Additionally, since this review only included published studies, it is possible that unpublished studies exist that show negative findings, thus resulting in publication bias, although results from the funnel plots show significant publication bias is unlikely. Additionally, since many observational studies were included, it is possible that participants learned through the counseling they received to report fewer sexual partners and increased condom use, thus resulting in reporting bias. This review synthesized results from studies that are heterogeneous on several levels. The interventions themselves differed in counseling methods and content, many different study populations were included, and outcome measures were not uniform across studies. It is possible that this heterogeneity introduced bias and lead to exposure misclassification. Also, although results were stratified by potential confounders including HIV status and gender, there could be other unmeasured confounders that affected results. Although meta‐analysis presents a precise estimate of efficacy, the reported uncertainty levels surrounding these estimates are important and should be taken into consideration in interpreting the final results. This review spans two decades of HIV interventions related to testing and counseling. During this time, there have been numerous advances in the field of HIV, including increased availability of anti‐retroviral therapy (ART) and increased availability of rapid, same‐day VCT services. Therefore, it is possible that participants who volunteered for VCT prior to the wide availability of ART and rapid‐testing are different in some aspects from those that volunteered in more recent years. Additionally, VCT interventions must be understood in the context of the larger HIV prevention efforts that have been underway since the early 1990s. The majority of studies in this review have relatively short follow‐up time periods of one year or less. Therefore, we were not able to assess any larger time trends surrounding HIV prevention or any long‐term effects of VCT. Finally, outcomes presented in the included studies often varied. For example, some studies reported consistent condom use in the past two weeks while others reported the amount of unprotected sex in the past month. In the future, developing standardized HIV‐related behavioral outcomes would make comparisons between studies more valid.
Authors' conclusions
Implications for practice.
In conclusion, results from this review and meta‐analysis bolster the growing evidence (Denison 2008; Higgins 1991; Wolitski 1997; Weinhardt 1999) that VCT reduces risky behaviors related to HIV by significantly reducing the number of sex partners of participants. Additionally, people living with HIV who received VCT exhibited increased odds of using condoms and engaging in protected sex than people living with HIV who did not receive VCT.
Implications for research.
In the past two years, innovative, effective interventions for HIV prevention have been discovered, including treatment as prevention (Cohen 2011) and pre‐exposure prophylaxis (PrEP) (Grant 2010). However, these interventions will only succeed if more people become aware of their HIV status, highlighting the continued importance of VCT in preventing HIV and accessing care and treatment. Although this review adds to the evidence that VCT reduces risky behaviors, relatively few details are known about which modalities of VCT are most effective. Additionally, the included studies revealed little information about how intervention components were implemented, such as which counseling strategies were employed during pre‐ and post‐test counseling. These details are precisely what must be understood in order to maximize the effectiveness of VCT in regards to changing sexual risk behavior, thus maximizing this intervention’s ability to prevent HIV, and for those who test positive, increasing the uptake of HIV care and treatment.
History
Protocol first published: Issue 3, 1998 Review first published: Issue 9, 2012
| Date | Event | Description |
|---|---|---|
| 8 August 2012 | Amended | Submitted for editorial review with reviewers' feedback incorporated |
| 12 May 2012 | Amended | Submitted for editorial review |
| 29 November 2010 | Amended | Protocol amended to address reviewer comments |
| 11 November 2008 | Amended | Converted to RevMan 5, and re‐published without new citation. |
Acknowledgements
This research was supported by the World Health Organization, Department of HIV/AIDS; The US National Institute of Mental Health, grant number 1R01MH090173; and The Horizons Program. The Horizons Program was funded by The US Agency for International Development under the terms ofHRN‐A‐00‐97‐00012‐00. We wish to thank Amy Medley and Elena Tuerk who worked as study coordinators for the project and Alexandria Smith who helped create the risk of bias tables. We also thank the following staff who conducted searches and extracted data for the analysis: Krissy Brinsley, Carolyn Daher, Janean Martin, Jennifer Gonyea, Andrea Ippel, Amanda Rosecrans, Elizabeth McCarthy, Devaki Nambiar, Amolo Okero, Sarah Finocchario, Stephanie Mullins‐Sweat, Marta Mulawa, Samantha Dovey, Jewel Gausman, Alexandria Smith, Jeremy Lapedis, Aisha Yansaneh, Eugenia Pyntikova, Hieu Pham, Lorraine Beraho, Tina Dickenson, and Erica Layer.
Characteristics of studies
Characteristics of included studies [ordered by study ID]
Allen 2003.
| Methods | Cohort study with before‐after data presented on sexual behavior among serodiscordant couples . Individual unit of analysis. Non‐random selection of participants. | |
| Participants | Location: Lusaka, Zambia Clinic‐based VCT HIV serodiscordant couples Gender: 50% female; 50% male Age (mean): Males: 35 years Females: 29 years |
|
| Interventions | Couples recruited from a same‐day VCT center. The same‐day couples’ VCT services included free treatment for syphilis, condom skills training, and free condoms. | |
| Outcomes | Percentage of sex acts that occurred outside of marriage; sexual intercourse with and without condoms | |
| Notes | Excluded from meta‐analysis because sexual intercourse with and without condoms is compared between "regular attendees" and "irregular attendees." Since both groups received the intervention, there is no comparison of condom use between those who received VCT and those who did not. A brief mention is made regarding condom use rates among couples' before receiving VCT and after receiving VCT, but not enough information is given to include the study in meta‐analysis. Results Percentage of sex acts that occurred outside of the marriage: Male: 3 months Before to 12 months after (7% vs. 3%) NR Female: Before to After (0.3% vs. 0.2%) NR Condom use among couples: Before to After (<3% vs. >80%), NR |
|
| Risk of bias | ||
| Bias | Authors' judgement | Support for judgement |
| Random sequence generation (selection bias) | High risk | Non‐random selection of participants |
| Allocation concealment (selection bias) | High risk | Observational study |
| Blinding of participants and personnel (performance bias) All outcomes | High risk | Observational study |
| Blinding of outcome assessment (detection bias) All outcomes | High risk | Observational study |
| Incomplete outcome data (attrition bias) All outcomes | Unclear risk | Follow‐up rates not reported |
| Selective reporting (reporting bias) | Unclear risk | Study protocol is not available |
| Other bias | Low risk | No other biases detected |
Arthur 2007.
| Methods | Single‐arm prospective cohort study with before‐after design. Assessments took place at baseline (N=540) and at follow up (6‐months; mean=7.5 months; N=401) post‐intervention. Participants were selected based on the three health clinics which were selected systematically. | |
| Participants | Location: Thika & Nairobi Districts, Kenya Clinic‐based VCT At least 18 years old or married, never tested for HIV and regular partner never tested. Gender: % male: 52% % female: 48% Age (mean): Males: 29 years Females: 28 years |
|
| Interventions | The new free counselling and simple rapid on‐site testing service used existing infrastructure to mirror future government services. Each had one project‐salaried counsellor, with testing performed by nurses and counsellors. Condom demonstrations and free condoms were provided. Counselling sessions used a client‐centred approach involving personalized, interactive counselling, and included risk assesment and coping strategies. | |
| Outcomes | Unprotected sex with any partner type (in the analysis, this outcome was flipped to reflect protected sex); positive/negative life events; proportion reporting any STI symptoms | |
| Notes | Used in meta‐analysis. Results Table 3Page 544 Behavior Change at Follow‐up N=401 (%) Pre Post Number of sexual partners >2 in the past 6 months 66/401 (16.4) 23/401 (5.8) SIG p<0.001 >2 in the past 2 months 23/401 (5.7) 15/401 (3.7) SIG p<0.02 Unprotected Sexual Intercourse Episodes of sexual intercourse by partner type Average rate of unprotected episodes (%) 100 92 Non‐primary partners (N=44) (N=30) Average rate of unprotected episodes (%) 93 49 Proportion reporting any STI symptoms 159/401 (39.7) 61/401 (15.3) SIG<0.02 Table 4‐Page 544‐ Personal Plans and Actions for HIV Prevention, disclosure after life events (%) Disclosure Plans to disclose if HIV+ Actual Disclosure HIV‐ Actual Disclosure HIV+ Negative Life Events Of those followed‐up, there was a 78% response rate for the disclosure section. Page 545 Relationship Changed, % Attitudes toward condom use (%) – pg. 544 |
|
| Risk of bias | ||
| Bias | Authors' judgement | Support for judgement |
| Random sequence generation (selection bias) | High risk | Non‐random selection of participants |
| Allocation concealment (selection bias) | High risk | Observational study |
| Blinding of participants and personnel (performance bias) All outcomes | High risk | Observational study |
| Blinding of outcome assessment (detection bias) All outcomes | High risk | Observational study |
| Incomplete outcome data (attrition bias) All outcomes | High risk | Follow‐up rate was less than 80% |
| Selective reporting (reporting bias) | Unclear risk | Study protocol not available |
| Other bias | Low risk | No other biases detected |
Bakari 2000.
| Methods | Cross‐sectional data analyzed using cross‐tabulations stratified by four categories: a) couples invited for same‐day VCT at ZUHRP but did not attend; b) couples who attended ZUHRP but chose not to test; c) couples who attended ZUHRP and were tested; and d) individuals tested at Kara counseling (results were not same‐day results). Random selection of participants. Individual unit of analysis. | |
| Participants | Location: Lusaka, Zambia Clinic‐based VCT Couples and individuals invited and/or attending VCT clinics Gender: not reported Age Range: 16‐56 years |
|
| Interventions | Zambia‐UAB HIV research project (ZUHRP) invited couples for same‐day HIV counseling and testing. Participants were also recruited from Kara Counseling without same‐day test results. | |
| Outcomes | Knowledge, disclosure, preceived stigma | |
| Notes | Not used in meta‐analysis because relevant outcomes were not presented. Results (1) Reports “a lot” of knowledge about HIV Did not come to VCT center (4%); Came but not tested (18%); Tested at ZUHRP VCT center (9%);Tested at Kara VCT (16%) [Sig (2) Feels others would treat them different if they were thought to be HIV positive Did not come to VCT center (86%); Came but not tested (41%); Tested at ZUHRP VCT center (32%); Tested at Kara VCT (60%) [Sig] (3) Discussed getting HIV tested with their Partner Did not come to VCT center (55%); Came but not tested (73%); Tested at ZUHRP VCT center (96%) [Sig] |
|
| Risk of bias | ||
| Bias | Authors' judgement | Support for judgement |
| Random sequence generation (selection bias) | High risk | Non‐random selection of participants |
| Allocation concealment (selection bias) | High risk | Observational study |
| Blinding of participants and personnel (performance bias) All outcomes | High risk | Observational study |
| Blinding of outcome assessment (detection bias) All outcomes | High risk | Observational study |
| Incomplete outcome data (attrition bias) All outcomes | Unclear risk | Not applicable: cross‐sectional data |
| Selective reporting (reporting bias) | Unclear risk | Study protocol not available |
| Other bias | Low risk | No other biases detected |
Chen 2007.
| Methods | Before‐After study design with no control group. Assessments took place at baseline (N=226) and at 3 months (N=217) post‐intervention. Participants were non‐randomly selected. | |
| Participants | Location: Guangxi Province, China Clinic‐based VCT Adult IDUs in southern China Gender: 89.8% male 10.2% female Age Range: 20 – 50+ years |
|
| Interventions | Participants received HIV pre‐test counseling, HIV testing, post‐test counseling and referral. Pre‐test counseling was conducted one‐on‐one and covered fundamentals of AIDS knowledge, risk reduction and demonstration of effective use of bleach and condoms. Post‐test counseling was conducted after participant finished the HIV testing and was informed of his/her HIV antibody status. Post‐test counseling was tailored to serostatus and consissted of a risk reduction “booster” and information about referral services. HIV positive participants received more intensive information regarding referral services. | |
| Outcomes | HIV knowledge, condom use, and injection drug use risk behavior | |
| Notes | Not used in meta‐anlysis because pre/post condom use outcomes could not be converted to an odds ratio Results HIV KNOWLEDGE/BELIEFS (pg. 785, T2) N=217 Item Baseline (n) Follow‐up (n) Chi‐square value A person can get HIV by sharing 67.9% (147) 94.9% (205) 65.30 (p < .01) Sig. Pulling out the penis before a 49.3% (107) 87.6% (190) 20.80 (p < .01) Sig. Showering or washing one’s 58.5% (127) 81.1% (176) 27.16 (p < .01) Sig. All pregnant women infected 83.9% (182) 96.3% (209) 122.60 (p < .01) Sig. There is a vaccine that can 76.0% (165) 96.8% (210) 94.08 (p < .01) Sig. Having sex with more than 73.3% (159) 98.6% (214) 88.33 (p < .01) Sig. You can get HIV from a 69.8% (151) 92.2% (200) 147.46 (p < .01) Sig. Sharing needles and 85.7% (186) 98.2% (213) 137.27 (p < .01) Sig. Condom use could 86.2% (187) 96.3% (209) 132.57 (p < .01) Sig. CONDOM USE Never 82% (17) 32.5% (28) Wilcoxon signed ranks test: Z = 5.13, p < .001 Sig. Never 82.1% (92) 38.4% (43) Wilcoxon signed ranks test: Z = 6.32, p < .001 Sig. INJECTION DRUG RISK BEHAVIORS IN THE LAST 30 DAYS (pg. 786, T3), N = 217 Risk Behavior Baseline (n) Follow‐up (n) Chi‐square value Sharing needles/syringes 45.1% (98) 33.6% (73) 10.55 (p < .01) Sig. Sharing cotton/cooker/rinse 47.0% (102) 34.1% (74) 8.47 (p < .01) Sig. water Sharing drug solution 56.6% (123) 29.9% (65) 4.93 (p < .05) Sig. Cleaning needle/syringe 0.0% (0) 17.0% (37) 126.15 (p < . 01) Sig. |
|
| Risk of bias | ||
| Bias | Authors' judgement | Support for judgement |
| Random sequence generation (selection bias) | High risk | Non‐random selection of participants |
| Allocation concealment (selection bias) | High risk | Observational study |
| Blinding of participants and personnel (performance bias) All outcomes | High risk | Observational study |
| Blinding of outcome assessment (detection bias) All outcomes | High risk | Observational study |
| Incomplete outcome data (attrition bias) All outcomes | Low risk | Follow‐up rate was greater than 80% |
| Selective reporting (reporting bias) | Unclear risk | Study protocol is not avaiable |
| Other bias | Low risk | No other biases detected |
Corbett 2007.
| Methods | Randomized group trial study design. Assessments took place at baseline (N=4316) and at approx. 2 years (N =2966) post‐intervention. Participants were non‐randomly selected. | |
| Participants | Location: Harare, Zimbabwe Employment‐based VCT Employed HIV‐negative adults Gender: I: 90.5% male; 9.5% female C: 88.4% male; 11.6% female Age: Mean: I = 36.3 years; C =36.7 years |
|
| Interventions | Participants received either Intensive VCT or standard VCT. Intensive VCT included pre‐test counseling, risk asssessment, testing, results and pre‐test counseling with risk reduction planning all on the same day. Follow‐up counseling and repeat VCT were available. Standard VCT participants received pre‐test counseling and risk assessment and were then given a pre‐paid voucher to a chain of free‐standing VCT providers. All participants had access to free condoms. | |
| Outcomes | HIV incidence | |
| Notes | Not used in meta‐analysis data were not presented on condom use or number of sex partners Results: Sample Size: Intensive VCT (I) = 1503 Standard VCT (C) = 1463 HIV Incidence (pg. 486,Table 2) |
|
| Risk of bias | ||
| Bias | Authors' judgement | Support for judgement |
| Random sequence generation (selection bias) | Unclear risk | Authors do not specify how the 22 businesses were randomly allocated to receive intense or standard VCT (pg 484). |
| Allocation concealment (selection bias) | Unclear risk | Since the authors do not report their allocation method, it is impossible to discern whether or not allocation concealment (selection bias) was an issue. |
| Blinding of participants and personnel (performance bias) All outcomes | Low risk | Participants were not blinded to treatment. However, laboratory personnel were blinded. Given the nature of the intervention, it is unlikely that the lack of blinding affected study outcomes. |
| Blinding of outcome assessment (detection bias) All outcomes | Unclear risk | Authors do not state whether or not interviewers administering follow‐up surveys were blinded but laboratory staff were blinded for specimen analysis. |
| Incomplete outcome data (attrition bias) All outcomes | High risk | There were different attrition rates between intervention and control arms of the study. |
| Selective reporting (reporting bias) | Low risk | Authors measure HIV incidence, but state that “HIV incidence was not an outcome of the VCT trial, and so no power studies were performed before analysis”. Thus, the study may not have had enough power to detect differences in HIV incidence between the two arms. |
| Other bias | Low risk | No other biases detected |
Cremin 2010.
| Methods | Prospective cohort study. Assessments taken place at baseline (N= 8,273) and at 3 years (N= 6,559) and 5 years (N=12,553) post‐intervention. Participants were non‐randomly selected. | |
| Participants | Location: Manicaland province of Eastern Zimbabwe Mobile VCT Zimbabweans in rural areas and small towns. Gender: 42% male 58% female Age Range: 15‐54 years with a median of 29 years for males and 30 yeaers for females |
|
| Interventions | Participants were offered free HIV counseling and testing at each survey. This service was available at a mobile clinic which was present within the study site at the time the survey was being conducted. Participants receiving VCT from the research program did so after completing the survey questionnaire. During the baseline and second surveys, VCT clients were asked to return 2 weeks after testing, to receive their results and post‐test counseling. Counseling was provided by trained male and female nurse counselors. | |
| Outcomes | Consistent condom use in past 2 weeks with regular and non‐regular partners Sexual partner in the past month |
|
| Notes | Used in meta‐analysis Results Mean levels of reported behavior at 1st survey and by testing status at 3rd survey, among males and females in the open cohort [Survey Round 1 to Survey Round 3 (for those that received VCT in Round 3)Table 2, page 711 Males: Times visited bar or beer hall in the last month. Pre and Post. 5.53 to 1.26 NR Number of new sexual partners in past year. Pre and Post. 1.10 to 0.26 NR Number of sexual partners in past month. Pre and Post. 0.77 to 0.66 NR Number of current partners. Pre and Post. 1.08 to 0.80NR Proportion reporting consistent condom use in last 2 weeks with regular partner. Pre and Post. 0.13 to 0.07 NR Proportion reporting consistent condom use in last 2 weeks with non‐regular partner. Pre and Post. 0.45 to 0.26 NR Females: Times visited bar or beer hall in the last month. Pre and Post. 0.41 to 0.88 NR Number of new sexual partners in past year. Pre and Post. 0.30 to 0.21 NR Number of sexual partners in past month. Pre and Post. 0.68 to 0.64 NR Number of current partners. Pre and Post. 0.85 to 0.76 NR Proportion reporting consistent condom use in last 2 weeks with regular partner. Pre and Post. 0.07 to 0.07 NR Proportion reporting consistent condom use in last 2 weeks with non‐regular partner. Pre and Post. 0.31 to 0.16 NR Sexual behavior change following VCT, from generalized linear regression models predicting each behavioral outcomeTable 3, page 71 . Exp(Coef.): Exponentiated coefficient ; Exponentiated coefficients describe the change in the outcome variable associated with receiving VCT, stratified by sex and HIV status). A value of 1 indicates no change. Results are adjusted for age, calendar year and marital status, HIV positive Males: Visited bar or beer hall in the last month. Exp(Coef) = 1.26, p‐value <0.01 Sig New sexual partners in past year. Exp(Coef) = 0.75 NS Sexual partner in past month. Exp(Coef) = 1.19 NS Multiple concurrent partners. Exp(Coef) = 0.72 NS Consistent condom use in last 2 weeks with regular partner. Exp(Coef) = 1.65 NS Consistent condom use in last 2 weeks with non‐regular partner. Exp(Coef) = 0.65 NS HIV positive Females: Visited bar or beer hall in the last month. Exp(Coef) = 0.16, p‐value <0.05 Sig New sexual partners in past year. Exp(Coef) = 0.13, p<0.01 Sig Sexual partner in past month. Exp(Coef) = 0.19 NS Multiple concurrent partners. Exp(Coef) = 0.58 NS Consistent condom use in last 2 weeks with regular partner. Exp(Coef) = 0.76 NS Consistent condom use in last 2 weeks with non‐regular partner. Exp(Coef) = 2.69 NS HIV negative Males: Visited bar or beer hall in the last month. Exp(Coef) = 1.02, NS New sexual partners in past year. Exp(Coef) = 0.87 NS Sexual partner in past month. Exp(Coef) = 0.89 NS Multiple concurrent partners. Exp(Coef) = 1.11 NS Consistent condom use in last 2 weeks with regular partner. Exp(Coef) = 0.96 NS Consistent condom use in last 2 weeks with non‐regular partner. Exp(Coef) = 1.08 NS HIV negative Females: |
|
| Risk of bias | ||
| Bias | Authors' judgement | Support for judgement |
| Random sequence generation (selection bias) | High risk | Non‐random selection of participants |
| Allocation concealment (selection bias) | High risk | Observational study |
| Blinding of participants and personnel (performance bias) All outcomes | High risk | Observational study |
| Blinding of outcome assessment (detection bias) All outcomes | High risk | Observational study |
| Incomplete outcome data (attrition bias) All outcomes | Unclear risk | Follow‐up rate not reported |
| Selective reporting (reporting bias) | Unclear risk | Study protocol not available |
| Other bias | Low risk | No other biases detected |
Grinstead 2001.
| Methods | Randomized controlled pre‐/post trial comparing amount of sex and amount of unprotected sex at the 1st follow‐up among adults who received VCT to adults who attended the HI session. Individual unit of analysis. Non‐random selection of participants. | |
| Participants | Location: Nairobi, Kenya; Dar es salaam, Tanzania; and Port of Spain, Trinidad. Clinic‐based VCT Individual and couples seeking VCT at a free‐standing VCT center |
|
| Interventions | VCT based on the CDC client‐centered model. Counseling included personalized risk assessment, development of a personalized risk‐reduction plan, role plays and condom demonstrations. Test results available 2 weeks after the blood draw. The participants in the health information (HI) arm watched a 15 minute video and participated in a group discussion about HIV transmission and condom use led by a health information officer. At the first follow‐up HI participants were offered VCT. | |
| Outcomes | Positive annd negative life events | |
| Notes | Not used in meta‐analysis because outcomes on condom use or number of sex partners were not presented. Results: Individuals (1) Physical abuse: I (4.0%), C (4.0%); [I vs. C, NS] (2) Increased emotional support from family: I (25%), C (22%); [I vs. C, NS] (3) Increased emotional support from health professionals: I (28%), C (26%); [I vs. C, NS] (4) Increased emotional support from peers: I (28%), C (30%); [I vs. C, NS] (5) Increased emotional support from employer: I (11%), C (12%): [I vs. C, NS] (6) Strengthening of a sexual relationship: I (41%), C (38%); [I vs. C, NS] (7) Break up of marriage : I (5.0%), C (5.0%); [I vs. C, NS] (8) Break up of a sexual relationship: I (27%), C (26%); [I vs. C, NS] (9) Neglected or disowned by family: I (2.0%), C (4.0%); [I vs. C, NS] Couples (10) Physical abuse: I (6.0%), C (4.0%); [I vs. C, NS] (11) Increased emotional support from family : I (22%), C (21%); [I vs. C, NS] (12) Increased emotional support from health professionals: I (33%), C(33%); [I vs. C, NS] (13) Increased emotional support from peers: I (25%), C (31%); [I vs. C, NS] (14) Increased emotional support from employer: I (13%), C (14%); [I vs. C, NS] (15) Strengthening of a sexual relationship: I (49%), C (46%); [I vs. C, NS] (16) Break up of marriage: I (6.0%), C (4.0%); [I vs. C, NS] (17) Break up of a sexual relationship: I (24%), C (20%); [I vs. C, NS] Neglected or disowned by family: I (3.0%), C (1.0%); [I vs. C, Sig] |
|
| Risk of bias | ||
| Bias | Authors' judgement | Support for judgement |
| Random sequence generation (selection bias) | Low risk | Although the randomization process was not specified in the article, data utilized in the study came from the VCT Efficacy Trial in which the random sequence generation is detailed. |
| Allocation concealment (selection bias) | Low risk | Recruitment and allocation were sufficiently separated and concealed (NOTE: this was not explicitly stated in the article but this was mentioned in the VCT Efficacy Study). |
| Blinding of participants and personnel (performance bias) All outcomes | Low risk | Participants were not blinded, but it is unlikely that the lack of blinding influenced the study outcomes. |
| Blinding of outcome assessment (detection bias) All outcomes | Unclear risk | “Interviewers needed to be blinded to the baseline serostatus of participants during the follow‐up interview; therefore, several series of questions assessing life events and disclosure of HIV serostatus were deferred from the interview and ascertained later by a counselor” No mention is made whether the interviewers were blinded to the participants’ treatment group. |
| Incomplete outcome data (attrition bias) All outcomes | Low risk | No differences were found between retained and non‐retained participants at second follow‐up on any baseline sexual behaviour variables. |
| Selective reporting (reporting bias) | Unclear risk | It is not clear whether study addressed outcomes pre‐specified in study protocol (no baseline measures for negative and positive life events were measured). |
| Other bias | Low risk | No other biases detected. |
Kawichai 2004.
| Methods | Cross sectional analysis comparing risk behaviors among I=previously tested participants vs. C=untested participants, measured at baseline. Individual unit of analysis. Non‐random selection of participants. | |
| Participants | Location: Chiang Mai, Thailand Clinic‐based VCT Thai citizens living in Chiang Mai between the ages of 19‐35 years. Gender: 41% male 59% female Age (mean): Males: 28 years Female: 29 years |
|
| Interventions | Group pre‐test counseling provided by trained counselors at community sites. Topics covered include HIV/STDs, routes of infection, risk assessment, risk reduction and the meaning of an HIV test. After blood draw the questionnaire was administered. Participants received confidential post‐test counseling individually 2 to 3 weeks later at health clinics or hospitals. | |
| Outcomes | Number of sex partners, condom use | |
| Notes | Not used in meta‐analysis because pre/post outcomes did not account for dependency in the data and could not be converted to the standard metric of an odds ratio Results (1) Number of sex partners: Males: None or 1: I (96.7%), C (97.9%); More than 1 I (3.3%), C (2.1%) [I vs. C, NS] Females: None or 1: I (99.8%), C (99.8%); More than 1: I (0.2%), C (02%) [I vs. C, NS] 2) Having casual sex (3) Condom use with a casual partner (4) Condom use with spouse (5) Condom use with girlfriend/boyfriend (6) Visit CSW (7) Condom use with CSW |
|
| Risk of bias | ||
| Bias | Authors' judgement | Support for judgement |
| Random sequence generation (selection bias) | High risk | Non‐random selection of participants |
| Allocation concealment (selection bias) | High risk | Observational study |
| Blinding of participants and personnel (performance bias) All outcomes | High risk | Observational study |
| Blinding of outcome assessment (detection bias) All outcomes | High risk | Observational study |
| Incomplete outcome data (attrition bias) All outcomes | Unclear risk | Not applicable: cross‐sectional data |
| Selective reporting (reporting bias) | Unclear risk | Study protocol not available |
| Other bias | Low risk | No other biases detected |
Machekano 1998.
| Methods | Time series study design comparing HIV and STI incidence between: a) men who returned for their test results at the project clinic and men who did not come in for their test results; and b) before and after data among men who received their HIV test result. Analysis conducted on subjects who were HIV‐negative at the time of enrollment. Factories were visited every six months to repeat serological tests and interviews. Individual unit of analyses. Non‐random selection of participants. | |
| Participants | Location: Zimbabwe Employment‐ based VCT Male factory workers Age not reported |
|
| Interventions | Pre‐test counseling, provided at the factories during the study recruitment, consisted of individual risk assessment, meaning of the test results and availability of treatment and support. Subjects encouraged to obtain their test result from a project clinic located off factory premises 2 weeks after the blood draw. STD treatment and condoms provided free of charge. Post‐test counseling covered topics such as the meaning of test results and disclosure. | |
| Outcomes | HIV incidence, STI rates and STI incidence | |
| Notes | Not used in meta‐analysis because outcomes on condom use and number of sex partners were not presented Results (1) HIV incidence per 100 person‐years: HIV‐negative men: I (3.29), C (1.76) Incident Rate Ratio 1.87, Sig (2) HIV incidence per 100 person‐years: HIV negative men who obtained their test results: Before to After (4.82 to 3.04), Incident Rate Ratio 0.63, NS (3) STD rates per 100 person‐years: all men who obtained their HIV test result:Before to After (13.53 to 17.57) Incident Rate Ratio 1.3, NS (4) STD incidence per 100 person‐years: HIV‐infected men who obtained their HIV test result: Before to After (25.32 to 29.71) Incident Rate Ratio 1.17, NS (5) STD incidence per 100 person‐years: HIV negative men who obtained their HIV test result: Before to After (10.84 to14.79) Incident Rate Ratio 1.36, NS (6) STD incidence per 100 person‐years: all men: I (14.29), C (4.30) Incident Rate Ratio 3.47, Sig |
|
| Risk of bias | ||
| Bias | Authors' judgement | Support for judgement |
| Random sequence generation (selection bias) | High risk | Non‐random selection of participants |
| Allocation concealment (selection bias) | High risk | Observational study |
| Blinding of participants and personnel (performance bias) All outcomes | High risk | Observational study |
| Blinding of outcome assessment (detection bias) All outcomes | High risk | Observational study |
| Incomplete outcome data (attrition bias) All outcomes | Low risk | Follow‐up rate was greater than 80% |
| Selective reporting (reporting bias) | Unclear risk | Study protocol not available |
| Other bias | Low risk | No other biases detected |
Matambo 2006.
| Methods | This was a before and after study. Assessments took place at baseline (N=388) and at 3 months (N=388) post‐intervention. Participants were non‐randomly selected. | |
| Participants | Location: Harare, Zimbabwe Employment‐based VCT Employed individuals in Harare Gender: 87% male 13% female Age: Mean of 36 years |
|
| Interventions | Participants received pretest counseling, including risk assessment and a risk reduction plan. Same‐day results and posttest counseling were provided. For those with negative test results, posttest counseling routinely included discussion of the window period phenomenon, advice on how to tell sex partner(s) and ask them to consider voluntary counseling and testing as well, and advice on reducing their risk of acquiring HIV in the future. At the 3‐month follow‐up, a questionnaire, including a repeat risk assessment, was administered by the clinic nurse. |
|
| Outcomes | Unprotected sex with primary and non‐primary partners, genital ulcer or discharge | |
| Notes | Not used in meta‐analysis because pre/post outcomes presented did not account for dependency in the data and could not be converted to an odds ratio. Results N=388 for all outcomes Results can be found in Table 1 BR=Base rate PR=Post‐intervention rate Results reported by N (%) Unprotected sex: With primary partner only: BR: 280 (72) PR: 276 (71) P‐value: NR With >1 nonprimary partner: BR:24 (6) PR:37 (10) P‐value: NR With both primary partner and non primary partners: BR:16 (4) PR: 8 (2.1) P‐value: NR None: BR: 68 (18) PR: ) 67 (17) P‐value: NR Sex with someone thought to be HIV positive: BR: 20 (5) PR: 11 (3) P‐value: .06 NS Any risky behavior: BR: 20 (5) PR: 16 (4) P‐value:.28 NS Scarification: BR: 7 (1.8) PR: 3 (0.8) P‐value:.16 NS Sharing Razors: BR:1 (0.3) PR: 1 (0.3) P‐value: 1.0 NS Tattooing: BR:67 (17) PR: 58 (15) P=value: .07 NS Genital ulcer or discharge: BR: 5 (1.3) PR: 6 (1.6) P‐value: .73 NS False‐ negative test results associated with the window period: 0%; 95% CI, 0%–0.96%) |
|
| Risk of bias | ||
| Bias | Authors' judgement | Support for judgement |
| Random sequence generation (selection bias) | High risk | Non‐randomized selection of participants |
| Allocation concealment (selection bias) | High risk | Observational study |
| Blinding of participants and personnel (performance bias) All outcomes | High risk | Observational study |
| Blinding of outcome assessment (detection bias) All outcomes | High risk | Observational study |
| Incomplete outcome data (attrition bias) All outcomes | Unclear risk | Follow‐up rates not reported |
| Selective reporting (reporting bias) | Unclear risk | Study protocol not available |
| Other bias | Low risk | No other biases detected. |
Matovu 2005.
| Methods | Prospective cohort of initially HIV‐negative respondents who completed the baseline interview in 1999 and the follow‐up interview in 2000. All participants received pre‐test counseling and had their blood drawn. Authors compared respondents who I=accepted VCT (received their VCT test result) vs. C= did not accept VCT (respondents who did not receive their VCT test result) in terms of number of sexual partners and condom use behaviors at baseline and follow‐up. Census sampling. | |
| Participants | Location: Rakai, Uganda Home‐based VCT HIV negative adults in rural Uganda Gender: 57% female 43% male Ag range 15‐49 years |
|
| Interventions | Participants were interviewed and had a blood draw, followed by pre‐test counseling. Participants could request free VCT as individuals or couples, either at the time of the interview or during the inter‐survey period. Participants who choose to learn their HIV status received post‐test counseling and verbally told their HIV test result. | |
| Outcomes | Condom use (comparing consistent use to anything less than consistent use) Number of sex partners (dichotomized at 0‐1 partner vs.≥ 2 partners) |
|
| Notes | Used in meta‐analysis Results 1) Among initially HIV‐negative persons : Number of sex partners Males: One: I (61.7% vs. 60.0%); C (64.7% vs. 63.4%); Two: I (26.4% vs. 27.7%); C (21.0% vs. 22.2%); Three: I (11.9% vs. 12.3%); C (14.3% vs. 14.4%) [I vs. C, NS] Females: One: I (97.5% vs. 97.9%); C (94.4% vs. 96.2%); Two: I (2.0% vs. 2.1%); C (4.7% vs. 3.5%); Three: I (0.5% vs. 0.1%); C (0.9% vs. 0.2%) [I vs. C, NS] (2) Condom use (3) HIV incidence |
|
| Risk of bias | ||
| Bias | Authors' judgement | Support for judgement |
| Random sequence generation (selection bias) | High risk | Non‐randomized selection of participants |
| Allocation concealment (selection bias) | High risk | Observational study |
| Blinding of participants and personnel (performance bias) All outcomes | High risk | Observational study |
| Blinding of outcome assessment (detection bias) All outcomes | High risk | Observational study |
| Incomplete outcome data (attrition bias) All outcomes | High risk | Follow‐up rate was less than 80% |
| Selective reporting (reporting bias) | Unclear risk | Study protocol not available |
| Other bias | Low risk | No other biases detected |
Mola 2006.
| Methods | Prospective cohort study. Assessments took place at baseline (N=1220), 4 months (N=1052), and 6 months (N=954 post‐intervention. Participants were not randomly selected to participate. | |
| Participants | Location: Beira and Chimoio. Mozambique Clinic‐based VCT Individuals seeking VCT in central Mozambique Gender: I: 52% male C: 48% male Age: I: 43% < 21 years, 51%: 21‐40 years, 6% >40 years C: 31% < 21 years, 64% 21‐40 years, 5% >40 years |
|
| Interventions | Voluntary counseling and testing for HIV (no detailed description of the intervention provided) | |
| Outcomes | Condom use (sometimes/always) | |
| Notes | Used in meta‐analysis Results Sex with friend/prostitute in last month, Number (%) Baseline I = 181 (57) C = 156 (42) p < 0.01 Sig. First return I = 157 (55) C = 160 (42) p < 0.05 Sig. Second return I = 135 (64) C = 153 (50) p < 0.05 Sig Condom in last sex (among those having sex with friends/prostitutes in last month); Number (%) Always or sometime use condom; Number (%) Condom last sex; Number (%) (The authors also report results of analyses by gender, literacy rate, and HIV status, though no actual numbers are reported) |
|
| Risk of bias | ||
| Bias | Authors' judgement | Support for judgement |
| Random sequence generation (selection bias) | High risk | Non‐randomized selection of participants |
| Allocation concealment (selection bias) | High risk | Observational study |
| Blinding of participants and personnel (performance bias) All outcomes | High risk | Observational study |
| Blinding of outcome assessment (detection bias) All outcomes | High risk | Observational study |
| Incomplete outcome data (attrition bias) All outcomes | High risk | Follow‐up rate was less than 80% |
| Selective reporting (reporting bias) | Unclear risk | Study protocol not available |
| Other bias | Low risk | No other biases detected |
Muller 1995.
| Methods | Cross‐sectional study comparing condom use and number of sex partners among HIV infected men and women who had previously sought VCT on average 23 months earlier and were attending an immune clinic to HIV infected age and gender‐ matched controls receiving VCT for the first time. Individual unit of analysis. Non‐random selection of participants. | |
| Participants | Location: Bangokok, Thailand Clinic‐based VCT Adults seeking VCT Gender: 17% female 83% male Age: 15 to 66 years |
|
| Interventions | HIV positive patients, who received their test result at the anonymous clinic (AC), were referred to the immune clinic (IC) for care and treatment after the post‐test counseling. This outpatient clinic has cared for patients with HIV/AIDS since 1985 and newly attending patients receive counseling by specially trained Red Cross health workers. | |
| Outcomes | Condom use during last 3 sexual encounters (comparing always use to less than always use) Number of sex partners in past 12 months (dichotomized at 0‐1 partners vs.≥ 2 partners) |
|
| Notes | Used in meta‐anlysis Results (1) Condom use during last three acts of sex: I (44%), C (14%); [I vs. C, Sig] (2) Numbers of sexual partners‐was reported: I (NR), C (NR); [I vs. C, Sig] (3) Abstinence: I (42%), C (14%); [I vs. C, Sig] |
|
| Risk of bias | ||
| Bias | Authors' judgement | Support for judgement |
| Random sequence generation (selection bias) | High risk | Non‐randomized selection of particiapnts |
| Allocation concealment (selection bias) | High risk | Observational study |
| Blinding of participants and personnel (performance bias) All outcomes | High risk | Observational study |
| Blinding of outcome assessment (detection bias) All outcomes | High risk | Observational study |
| Incomplete outcome data (attrition bias) All outcomes | Unclear risk | Not applicable: cross‐sectional data |
| Selective reporting (reporting bias) | Unclear risk | Study protocol not available |
| Other bias | Low risk | No other biases detected |
Roth 2001.
| Methods | Pre‐/post intervention trial comparing condom use among men before and after having received the male counseling intervention. Individual and couple unit of analyses. Non‐random selection of participants. | |
| Participants | Location: Kigali, Rwanda Clinic‐based VCT Male cohabiting partners of women Gender: 100% male Age (mean): Females: 32 years Males: 39 years |
|
| Interventions | Male counseling for the partners of previously tested women. Each man watched a video on HIV risk/safer sexual practices and participated in small group discussions led by trained social workers. Trained counselors gave individuals their HIV test results during a return visit. | |
| Outcomes | Condom use | |
| Notes | Not included in meta‐analysis because pre/post could not converted to odds ratios. Results: (1) Rate of sexual intercourse with and without condoms A 4‐way interaction effect (couple by male awareness group by assessment by type of sex) indicates that among couples with at least one HIV–infected partner sexual intercourse without condoms decreased and with condoms increased from before to after [F test Sig] (2) Condom ratios (3) Regular condom use (4) Regular condom users among concordant HIV positive couples who already knew their HIV status at the 1st assessment (5) Insistence on sex by male partners when refused (6) Insistence on sex by male partners when refused among couples with at least one HIV positive partner: |
|
| Risk of bias | ||
| Bias | Authors' judgement | Support for judgement |
| Random sequence generation (selection bias) | High risk | Non‐randomized selection of participants |
| Allocation concealment (selection bias) | High risk | Observational study |
| Blinding of participants and personnel (performance bias) All outcomes | High risk | Observational study |
| Blinding of outcome assessment (detection bias) All outcomes | High risk | Observational study |
| Incomplete outcome data (attrition bias) All outcomes | Unclear risk | Follow‐up rate not reported |
| Selective reporting (reporting bias) | Unclear risk | Study protocol not available |
| Other bias | Low risk | No other biases detected |
Samayoa 2010.
| Methods | Before‐After (stratified by HIV status) study. Assessments took place at baseline (N=144) and at 3 months (N=90). Non‐random selection of participants | |
| Participants | Location: Guatemala City, Guatemala Clinic‐based VCT Adults seeking HIV test in Guatemala Gender: 43.1% male 56.9% female Age range: 18‐83 years |
|
| Interventions | Voluntary pre‐test and post‐test counseling regarding HIV infection, transmission, prevention, and interpretation of HIV test results. Those who tested positive received psychological support; those who tested negative received further behavioral recommendations to reduce likelihood of infection. | |
| Outcomes | Number of sexual partners in past 3 months (reported mean and standard deviation); unprotected sex | |
| Notes | The number of sex partners outcome was used in meta‐analysis but the unprotected sex outcome was not used in meta‐analysis because the pre/post results could not be converted to an odds ratio. Results # Sexual Partners (Mean (SD)) . All, then stratified by HIV status. C(All) = 1.64 (2.6); I(All) = 1 (0.49) Sig at p=0.02 C(HIV+) = 2.39 (3.7); I(HIV+) = 1.02 (0.7) Sig at p=0.02 C(HIV‐) = 1.02 (0.52); I(HIV‐) = 0.98 (0.24) NS at p = 0.62 Giving Money for Sex (# said yes) . All, then stratified by HIV status. Receiving Money for Sex (# said yes) . All, then stratified by HIV status. Has a Regular Sexual Partner (# said yes) . All, then stratified by HIV status. |
|
| Risk of bias | ||
| Bias | Authors' judgement | Support for judgement |
| Random sequence generation (selection bias) | High risk | Non‐randomized selection of participants |
| Allocation concealment (selection bias) | High risk | Observational study |
| Blinding of participants and personnel (performance bias) All outcomes | High risk | Observational study |
| Blinding of outcome assessment (detection bias) All outcomes | High risk | Observational study |
| Incomplete outcome data (attrition bias) All outcomes | High risk | Follow‐up rate was less than 80% |
| Selective reporting (reporting bias) | Unclear risk | Study protocol not available |
| Other bias | Low risk | No other biases detected |
VCT Efficacy 2000.
| Methods | Randomized controlled pre‐/post trial. Participants were randomly assigned to the study arms as individuals or couples. HI participants were offered VCT during the 1st follow‐up visit (2nd follow‐up data not shown). Because there was no effect of study site on intervention‐group outcome, data were pooled for all analyses. Individual unit of analysis. Non‐random selection of participants. | |
| Participants | Location: Nairobi, Kenya; Dar es salaam, Tanzania; and Port of Spain, Trinidad. Clinic‐based VCT Individual and couples seeking VCT at a free‐standing VCT center Gender‐Individuals 51% female 49% male Gender‐ Couples 50% female 50% male |
|
| Interventions | VCT based on the CDC client‐centered model. Counseling included personalized risk assessment, development of a personalized risk‐reduction plan, role plays and condom demonstrations. Test results available 2 weeks after the blood draw. The participants in the health information (HI) arm watched a 15 minute video and participated in a group discussion about HIV transmission and condom use led by a health information officer. At the first follow‐up HI participants were offered VCT. | |
| Outcomes | Unprotected sex with primary and non‐primary partners (outcome flipped to reflect protected sex) | |
| Notes | used in meta‐analysis Results Individuals (1) Any intercourse with non primary partner Males: I (42.2% to 38.5%; NS), C (40.2% to 43.5%; NS) [I vs. C, NS] Females: I (39.8% to 24.3%; Sig), C (32.4% to 28.7%; Sig) [I vs. C, NS] (2) Unprotected sex with non primary partners (3) Unprotected sex with primary partners (4) Any intercourse with primary partners (5) Estimated STD incidence: OR 0.80 [I vs. C, NS] (7) Unprotected sex with enrollment partner (8) Unprotected sex with non‐enrollment partner (9) Any intercourse with non‐enrollment partner |
|
| Risk of bias | ||
| Bias | Authors' judgement | Support for judgement |
| Random sequence generation (selection bias) | Low risk | “Randomisation was stratified by site, sex, and couple or individual status. Participants were assigned VCT or health information by allocation of sealed envelopes. Couples were always randomised together.” |
| Allocation concealment (selection bias) | Low risk | Recruitment and allocation were sufficiently separated and concealed. |
| Blinding of participants and personnel (performance bias) All outcomes | Low risk | Participants were not blinded to treatment allocation. Participants assigned to VCT agreed to testing after being assigned to groups. It is unlikely that the lack of blinding influenced study results. |
| Blinding of outcome assessment (detection bias) All outcomes | Unclear risk | Specification of blinding lab technicians and interviewers were not provided. |
| Incomplete outcome data (attrition bias) All outcomes | Low risk | No differences were found between retained and non‐retained participants at second follow‐up on any baseline sexual behaviour variables. At 1st follow‐up, VCT ‐ 82% (n=1281); HI ‐ 81.5% (n=1269) At 2nd follow‐up, VCT ‐ 70.7% (n=1105); HI ‐ 70.1% (n=1091) |
| Selective reporting (reporting bias) | Unclear risk | All outcomes specified in the paper were measured and results were reported. |
| Other bias | Unclear risk | No other bias detected |
Wu 2005.
| Methods | Before and after study with no control group. Assessments at baseline (N=319), and one year (N=319). Random selection of participants (25%) for one year follow up. | |
| Participants | Location: China (Townships in three counties in Fuyang city of Anhuiprovince: Yingzhou, Lingquan, and Jieshou) Clinic‐based VCT Couples in mandatory premarital counseling Gender: 50% males; 50% females Age: not reported |
|
| Interventions | The intervention included the provision of information about HIV/AIDS, including methods of transmission and strategies to protect oneself and one’s partner from being infected. The program included a demonstration of condom use with a model. Each participant was given a risk–profile questionnaire to complete, which included a list of possible HIV exposures. The counseling sessions and questionnaires were administered to each person separately to ensure confidentiality. All participants were informed their test results would be made available to their partners only if they so desired. Local health professionals were trained to conduct all parts of the study program, including providing information about HIV/AIDS, obtaining blood samples for HIV testing, carrying out the rapid test, and providing pretest and posttest counseling for both HIV–negative and –positive individuals. | |
| Outcomes | HIV/AIDS knowledge | |
| Notes | Not used in meta‐analysis because results for condom use or number of sex partners were not reported. Results: Comparison of Knowledge and Behaviors Between Baseline and Follow–Up Studies Page 19, Table 4( N = 319 at baseline and follow up) I and C AIDS Knowledge:
|
|
| Risk of bias | ||
| Bias | Authors' judgement | Support for judgement |
| Random sequence generation (selection bias) | High risk | Non‐randomized selection of participants |
| Allocation concealment (selection bias) | High risk | Observational study |
| Blinding of participants and personnel (performance bias) All outcomes | High risk | Observational study |
| Blinding of outcome assessment (detection bias) All outcomes | High risk | Observational study |
| Incomplete outcome data (attrition bias) All outcomes | Low risk | Follow‐up rate was greater than 80% |
| Selective reporting (reporting bias) | Unclear risk | Study protocol not available |
| Other bias | Low risk | No other biases detected |
Characteristics of excluded studies [ordered by study ID]
| Study | Reason for exclusion |
|---|---|
| Allen 1992 | Fit definition of PITC as opposed to VCT because participants were receiving routine health services at the time of study enrollment |
| Farquhar 2004 | Fit definition of PITC as opposed to VCT and compared individuals' to couples' counseling (no pre/post or multi‐arm results presented were relevant to the primary research question) |
| Matovu 2007 | Same data presented as in Matovu 2005 |
| Sherr 2007 | Same data presented as in Cremin 2010 (different analyses were conducted) |
| Xu 2002 | Fit definition of PITC as opposed to VCT because participants were receiving routine health services at the time of study enrollment |
Differences between protocol and review
There were no major differences between the protocol and the review.
Contributions of authors
VT was the primary author of the review and coordinated the review process. JD was the primary author of an earlier review on this topic published in 2008. MS, KO, and CK provided substantial contributions in determining the inclusion criteria, assessing the eligibility of studies, determining the meta‐analysis procedures, and editing drafts of the review. All authors reviewed and approved the final manuscript.
Sources of support
Internal sources
No sources of support supplied
External sources
World Health Organization, Department of HIV/AIDS, Switzerland.
-
National Institute of Mental Health, USA.
RO1 MH071204, R01 MH090173‐01: Synthesizing HIV Behavioral Interventions Effectiveness in Developing Countries, and 1 RC1 MH088950‐01: Cost‐effectiveness of HIV‐related Mental Health Interventions
-
The Horizons Program, USA.
The Horizons Program is funded by the US Agency for International Development under the terms of HRN‐A‐00‐97‐00012‐00
-
The Johns Hopkins University Center for Communication Programs, USA.
R2P: Research to Prevention, funded through the Project Search Prevention Program Research Task Order, Grant # 104419, US Agency for International Development
Declarations of interest
None declared.
New
References
References to studies included in this review
Allen 2003 {published data only}
- Allen, S, J. Meinzen‐Derr, et al. Sexual behavior of HIV discordant couples after HIV counseling and testing. AIDS 2003;15(5):733‐740. [DOI] [PubMed] [Google Scholar]
Arthur 2007 {published data only}
- Arthur, G, V. Nduba, et al. Behaviour change in clients of health centre‐based voluntary HIV counselling and testing services in Kenya. Sex Transm Infect 2007;83(7):541‐546. [DOI] [PMC free article] [PubMed] [Google Scholar]
Bakari 2000 {published data only}
- Bakari, J. P, S. McKenna, et al. Rapid voluntary testing and counseling for HIV. Acceptability and feasibility in Zambian antenatal care clinics. Ann N Y Acad Sci 2000;918:64‐76. [DOI] [PubMed] [Google Scholar]
Chen 2007 {published data only}
- Chen, H. T, S. Liang, et al. HIV voluntary counseling and testing among injection drug users in south China: a study of a non‐government organization based program. AIDS Behav 2007;11(5):778‐788. [DOI] [PubMed] [Google Scholar]
Corbett 2007 {published data only}
- Corbett, E. L, B. Makamure, et al. HIV incidence during a cluster‐randomized trial of two strategies providing voluntary counselling and testing at the workplace, Zimbabwe. AIDS 2007;21(4):483‐489. [DOI] [PubMed] [Google Scholar]
Cremin 2010 {published data only}
- Cremin, I, C. Nyamukapa, et al. Patterns of self‐reported behaviour change associated with receiving voluntary counselling and testing in a longitudinal study from Manicaland, Zimbabwe. AIDS Behav 2010;14(3):708‐715. [DOI] [PMC free article] [PubMed] [Google Scholar]
Grinstead 2001 {published data only}
- Grinstead, O. A, S. E. Gregorich, et al. Positive and negative life events after counselling and testing: The Voluntary HIV‐1 Counselling and Testing Efficacy Study. AIDS 2001;15(8):1045‐1052. [DOI] [PubMed] [Google Scholar]
Kawichai 2004 {published data only}
- Kawichai, S, C. Beyrer, et al. HIV incidence and risk behaviours after voluntary HIV counselling and testing (VCT) among adults aged 19‐35 years living in peri‐urban communities around Chiang Mai city in northern Thailand, 1999. AIDS Care 2004;16(1):21‐35. [DOI] [PubMed] [Google Scholar]
Machekano 1998 {published data only}
- Machekano, R, W. McFarland, et al. Impact of HIV counselling and testing on HIV seroconversion and reported STD incidence among male factory workers in Harare, Zimbabwe. Cent Afr J Med 1998;44(4):98‐102. [PubMed] [Google Scholar]
Matambo 2006 {published data only}
- Matambo, R, E. Dauya, et al. Voluntary counseling and testing by nurse counselors: what is the role of routine repeated testing after a negative result?. Clin Infect Dis 2006;42(4):569‐57. [DOI] [PubMed] [Google Scholar]
Matovu 2005 {published data only}
- Matovu, J. K, R. H. Gray, et al. Voluntary HIV counseling and testing acceptance, sexual risk behavior and HIV incidence in Rakai, Uganda. AIDS 2005;19(5): 503‐511. [DOI] [PubMed] [Google Scholar]
Mola 2006 {published data only}
- Mola, O. D, M. A. Mercer, et al. Condom use after voluntary counselling and testing in central Mozambique. Trop Med Int Health 2006;11(2):176‐181. [DOI] [PubMed] [Google Scholar]
Muller 1995 {published data only}
- Muller, O, S. Sarangbin, et al. Sexual risk behaviour reduction associated with voluntary HIV counselling and testing in HIV infected patients in Thailand. AIDS Care 1995;7(5):567‐572. [DOI] [PubMed] [Google Scholar]
Roth 2001 {published data only}
- Roth, D. L, K. E. Stewart, et al. Sexual practices of HIV discordant and concordant couples in Rwanda: Effects of a testing and counselling programme for men. International Journal of STD and AIDS 2001;12(3):181‐188. [DOI] [PubMed] [Google Scholar]
Samayoa 2010 {published data only}
- Samayoa, B, M. R. Anderson, et al. Does HIV VCT reduce risk behaviors? An observational study in Guatemala City. Curr HIV Res 2010;8(2):121‐126. [DOI] [PubMed] [Google Scholar]
VCT Efficacy 2000 {published data only}
- VCT Efficacy Study Group. Efficacy of voluntary HIV‐1 counselling and testing in individuals and couples in Kenya, Tanzania, and Trinidad: a randomised trial. Lancet 2000;356(9224):103‐112. [PubMed] [Google Scholar]
Wu 2005 {published data only}
- Wu, Z, K. Rou, et al. Acceptability of HIV/AIDS counseling and testing among premarital couples in China. AIDS Educ Prev 2005;17(1):12‐21. [DOI] [PubMed] [Google Scholar]
References to studies excluded from this review
Allen 1992 {published data only}
- Allen, S, Tice, J, et al. Effect of serotesting with counselling on condom use andseroconversion among HIV discordant couples in Africa. BritishMedical Journal 1992;304(6842):1605–1609. [DOI] [PMC free article] [PubMed] [Google Scholar]
Farquhar 2004 {published data only}
- Farquhar, C, Kiarie, J. N, et al. Antenatal couple counseling increases uptake of interventions to prevent HIV‐1 transmission. Journal of AcquiredImmune Deficiency Syndromes 2004;37(5):1620–1626. [DOI] [PMC free article] [PubMed] [Google Scholar]
Matovu 2007 {published data only}
- Matovu, J. K, R. H. Gray, et al. Repeat voluntary HIV counseling and testing (VCT), sexual risk behavior and HIV incidence in Rakai, Uganda. AIDS Behav 2007;11(1):71‐78. [DOI] [PubMed] [Google Scholar]
Sherr 2007 {published data only}
- Sherr, L, B. Lopman, et al. Voluntary counselling and testing: uptake, impact on sexual behaviour, and HIV incidence in a rural Zimbabwean cohort. AIDS 2007;21(7):851‐860. [DOI] [PubMed] [Google Scholar]
Xu 2002 {published data only}
- Xu, F, Kilmarx, P. H, et al. Incidence of HIV‐1 infection and effects of clinic‐based counseling on HIV preventive behaviors among married women in northern Thailand. Journal ofAcquired Immune Deficiency Syndroms 2002;29(3):284–288. [DOI] [PubMed] [Google Scholar]
Additional references
Allen, 2003
- Allen, S, J. Meinzen‐Derr, et al. Sexual behavior of HIV discordant couples after HIV counseling and testing. AIDS 2003;15(5):733‐740. [DOI] [PubMed] [Google Scholar]
Arthur, 2007
- Arthur, G, V. Nduba, et al. Behaviour change in clients of health centre‐based voluntary HIV counselling and testing services in Kenya. Sex Transm Infect 2007;83(7):541‐546. [DOI] [PMC free article] [PubMed] [Google Scholar]
Bakari, 2000
- Bakari, J. P, S. McKenna, et al. Rapid voluntary testing and counseling for HIV. Acceptability and feasibility in Zambian antenatal care clinics. Ann N Y Acad Sci 2000;918:64‐76. [DOI] [PubMed] [Google Scholar]
CDC 2001
- CDC. Revised guidelines for HIV counseling, testing and referral and revised recommendations for HIV screening of pregnant women. Morbidity and Mortality Weekly Report 2001;50(RR19):1‐58. [PubMed] [Google Scholar]
Chen, 2007
- Chen, H. T, S. Liang, et al. HIV voluntary counseling and testing among injection drug users in south China: a study of a non‐government organization based program. AIDS Behav 2007;11(5):778‐788. [DOI] [PubMed] [Google Scholar]
CMA 2005 [Computer program]
- Borenstein M, Hedges L, Higgins J, Rothstein H. Comprehensive Meta‐analysis Version 2.2. Englewood, NJ: Biostat, 2005.
Cohen 2011
- Cohen MS, Chen YQ, McCauley M, Gamble T, Hosseinipour MC, Kumarasamy N, et al. Prevention of HIV‐1 infection with early antiretroviral therapy. N Engl J Med 2011 Aug 11;365(6):493‐505. [DOI] [PMC free article] [PubMed] [Google Scholar]
Copper 1994
- In: Copper HM, Hedges LV editor(s). The handbook of research synthesis. New York: Russell Sage Foundation, 1994. [Google Scholar]
Corbett, 2007
- Corbett, E. L, B. Makamure, et al. HIV incidence during a cluster‐randomized trial of two strategies providing voluntary counselling and testing at the workplace, Zimbabwe. AIDS 2007;21(4):483‐489. [DOI] [PubMed] [Google Scholar]
Cremin, 2010
- Cremin, I, C. Nyamukapa, et al. Patterns of self‐reported behaviour change associated with receiving voluntary counselling and testing in a longitudinal study from Manicaland, Zimbabwe. AIDS Behav 2010;14(3):708‐715. [DOI] [PMC free article] [PubMed] [Google Scholar]
De Zoysa 1995
- Zoysa I, Phillips KA, Kamenga MC, OReilly KR, Sweat MD, White RA, Gristead OA, Coates TJ. Role of HIV counseling and testing in changing risk behavior in developing countries. AIDS 1995;9(Suppl A):S95‐101. [PubMed] [Google Scholar]
Denison 2008
- Denison JA, OReilly KR, Schmid GP, Kenedy CE, Sweat MD. HIV voluntary counseling and testing and behavioral risk reduction in Developing Countries: A Meta‐analysis, 1990‐2005. AIDS and Behavior 1998;12(3):363‐73. [DOI] [PubMed] [Google Scholar]
Grant 2010
- Grant RM, Lama JR, Anderson PL, McMahan V, Liu AY, Vargas L, et al. Preexposure chemoprophylaxis for HIV prevention in men who have sex with men. N Engl J Med 2010 Dec 30;363(27):2587‐99. [DOI] [PMC free article] [PubMed] [Google Scholar]
Grinstead, 2001
- Grinstead, O. A, S. E. Gregorich, et al. Positive and negative life events after counselling and testing: The Voluntary HIV‐1 Counselling and Testing Efficacy Study. AIDS 2001;15(8):1045‐1052. [DOI] [PubMed] [Google Scholar]
Hedges 1998
- Hedges, Larry V, Vevea, Jack L. Fixed‐ and random‐effects models in meta‐analysis.. Psychological Methods Dec. 1998;3(4):486‐504. [Google Scholar]
Higgins 1991
- Higgins DL, Galavotti C, OReilly KR, Schnell DJ, Moore M, Rugg DL, Johnson R. Evidence for the effects of HIV antibody counseling and testing on risk behaviors. Journal of the American Medical Association 1991;266(17):2419‐29. [PubMed] [Google Scholar]
Kawichai, 2004
- Kawichai, S, C. Beyrer, et al. HIV incidence and risk behaviours after voluntary HIV counselling and testing (VCT) among adults aged 19‐35 years living in peri‐urban communities around Chiang Mai city in northern Thailand, 1999. AIDS Care 2004;16(1):21‐35. [DOI] [PubMed] [Google Scholar]
Kennedy 2012
- Kennedy CE, Fonner VA, Sweat MD, Okero A, Baggaley R, O’Reilly KR. Provider‐initiated HIV testing and counseling in low‐ and middle‐income countries: a systematic review. AIDS and Behavior 2012;[Epub ahead of print]. [DOI] [PMC free article] [PubMed] [Google Scholar]
Machekano, 1998
- Machekano, R, W. McFarland, et al. Impact of HIV counselling and testing on HIV seroconversion and reported STD incidence among male factory workers in Harare, Zimbabwe. Cent Afr J Med 1998;44(4):98‐102. [PubMed] [Google Scholar]
Matambo, 2006
- Matambo, R, E. Dauya, et al. Voluntary counseling and testing by nurse counselors: what is the role of routine repeated testing after a negative result?. Clin Infect Dis 2006;42(4):569‐57. [DOI] [PubMed] [Google Scholar]
Matovu, 2005
- Matovu, J. K, R. H. Gray, et al. Voluntary HIV counseling and testing acceptance, sexual risk behavior and HIV incidence in Rakai, Uganda. AIDS 2005;19(5): 503‐511. [DOI] [PubMed] [Google Scholar]
Matovu, 2007
- Matovu, J. K, R. H. Gray, et al. Repeat voluntary HIV counseling and testing (VCT), sexual risk behavior and HIV incidence in Rakai, Uganda. AIDS Behav 2007;11(1):71‐78. [DOI] [PubMed] [Google Scholar]
Medley 2004
- Medley A, Garcia‐Moreno C, McGill S, Maman S. Rates, barriers and outcomes of HIV serostatus disclosure among women in developing countries: implications for prevention of mother‐to‐child transmission programmes. Bull World Health Organ 2004;82(4):299‐307. [PMC free article] [PubMed] [Google Scholar]
Mola, 2006
- Mola, O. D, M. A. Mercer, et al. Condom use after voluntary counselling and testing in central Mozambique. Trop Med Int Health 2006;11(2):176‐181. [DOI] [PubMed] [Google Scholar]
Muller, 1995
- Muller, O, S. Sarangbin, et al. Sexual risk behaviour reduction associated with voluntary HIV counselling and testing in HIV infected patients in Thailand. AIDS Care 1995;7(5):567‐572. [DOI] [PubMed] [Google Scholar]
Roth, 2001
- Roth, D. L, K. E. Stewart, et al. Sexual practices of HIV discordant and concordant couples in Rwanda: Effects of a testing and counselling programme for men. International Journal of STD and AIDS 2001;12(3):181‐188. [DOI] [PubMed] [Google Scholar]
Samayoa, 2010
- Samayoa, B, M. R. Anderson, et al. Does HIV VCT reduce risk behaviors? An observational study in Guatemala City. Curr HIV Res 2010;8(2):121‐126. [DOI] [PubMed] [Google Scholar]
Sherr, 2007
- Sherr, L, B. Lopman, et al. Voluntary counselling and testing: uptake, impact on sexual behaviour, and HIV incidence in a rural Zimbabwean cohort. AIDS 2007;21(7):851‐860. [DOI] [PubMed] [Google Scholar]
UNAIDS 2000
- UNAIDS. Voluntary counseling and testing (VCT). UNAIDS Best Practices Collection. Technical Update 2000:1‐12.
United Nations 2006
- United Nations. Resolution adopted by the General Assembly: 60/262 Political Declaration on HIV/AIDS (No. Sixteenth session. A/Res/60/262). UN General Assembly 2006.
VCT 2000
- VCT Efficacy Study Group. Efficacy of voluntary HIV‐1 counselling and testing in individuals and couples in Kenya, Tanzania, and Trinidad: a randomised trial. Lancet 2000;356(9224):103‐112. [PubMed] [Google Scholar]
Weinhardt 1999
- Weinhardt LS, Carey MP, Johnson BT, Bickman NL. Effects of HIV counseling and testing on sexual risk behavior: A meta‐analytic review of published research, 1985‐1997. American Journal of Public Health 1999;89(9):1397‐1405. [DOI] [PMC free article] [PubMed] [Google Scholar]
WHO 2007
- WHO, UNAIDS. Guidance on provider‐ initiated HIV testing and counseling in health facilities. Geneva, Switzerland: WHO and UNAIDS, 2007. [Google Scholar]
WHO 2009
- WHO, UNAIDS, UNICEF. Towards universal access: Scaling up priority HIV/AIDS interventions in the health sector. Progress Report, September 2009. Geneva, Switzerland: WHO, UNAIDS, and UNICEF, 2009. [Google Scholar]
WHO 2012
- World Health Organization. Guidance on couples HIV testing and counselling including antiretroviral therapy for treatment and prevention in serodiscordant couples: Recommendations for a public health approach. Geneva: WHO, April 2012. [PubMed] [Google Scholar]
Wolitski 1997
- Wolitski RJ, MacGrowen RJ, Higgins DL, & Jorgensen CM. The effects of HIV counseling and testing on risk‐related practices and help‐seeking behavior. AIDS Education and Prevention 1997;9(3 Suppl):52‐67. [PubMed] [Google Scholar]
World Bank 2010
- World Bank. Countries and Regions. Retrieved July 15, 2010 from http://worldbank.org/.
Wu, 2005
- Wu, Z, K. Rou, et al. Acceptability of HIV/AIDS counseling and testing among premarital couples in China. AIDS Educ Prev 2005;17(1):12‐21. [DOI] [PubMed] [Google Scholar]