Kibana: Your window into all of your data
Kibana is the open source interface to query, analyze, visualize, and manage your data stored in Elasticsearch.
New to Kibana? Here's all you need to get started.
Watch videoLearn the core concepts of data analysis using Kibana.
Learn moreAre you using all of the features Kibana offers? Master the art of the Kibana dashboard.
Watch videoInside Kibana
Discover, visualize, and analyze with AI
Search, analyze, visualize, and alert all from a single UI. Query data in real time with built-in machine learning, geospatial analysis, and AI-powered correlation. Designed for speed, scale, and operational control across structured, semi-structured, and unstructured data.


Search and explore data
Query, transform, and interact with Elasticsearch in real time. Use natural language input, intelligent autocomplete, inline ML analysis, field-level summaries, and filters to seamlessly explore structured and unstructured data.
Build dashboards and visualizations
Build beautiful interactive dashboards with metrics, XY charts, graphs, maps, and tables. Visualize live data, drill into details instantly, and reuse saved queries across views for deeper analysis.
Integrate data with AI
Use natural language to generate and explain queries, troubleshoot issues, and explore data. Elastic's built-in assistant and Agent Builder understand your fields and context to accelerate analysis — no syntax memorization or manual query building required.
Inside Kibana
See the unusual. Map the where. Automate the what.
Use no-code machine learning to uncover anomalies and rare events, visualize geospatial patterns on interactive maps, and define intelligent alert rules that trigger automated responses and workflows across your environment for faster detection and resolution.


Anomaly detection with machine learning
Detect anomalies, rare events, and message patterns using no-code ML jobs. Visualize scored results, categorize messages, trigger alerts, and integrate into automated workflows for faster investigation and response.
Map and analyze geo data
Visualize and query geospatial data with multilayer maps, distance filters, and shape overlays to analyze location-based patterns and anomalies. Elastic Maps Service delivers basemaps and boundaries both on and offline for air-gapped environments.
Set alerts and automate responses
Define powerful alert rules with your data and trigger downstream workflows and custom actions integrated with your systems (Slack, PagerDuty, ServiceNow, and 100+ more).
Getting started with Kibana, your data's best view

Add your data
Ingest logs, metrics, or documents into Elasticsearch, or use sample datasets to explore instantly.

Explore and search
Use Discover or the AI Assistant to query, filter, and analyze data. Validate fields and find insights fast.

Visualize and act
Build your first dashboard, set alerts, or enable ML jobs to automate detection and response.
All from Kibana
Kibana is the window to your use case, uniting observability, security, and search in one intuitive platform. Monitor data, detect threats, and manage operations with the clarity and control to turn data into action.
Correlate and analyze multiple signals
Monitor logs, metrics, traces, and more in real time with one UI. Correlate spikes, errors, and resource usage across services with dashboards, ML, and alerts. Use time-synced views and live tailing to accelerate root cause analysis.
Detect and respond to threats
Detect threats and investigate security events with prebuilt and custom rules, anomaly detection, and timeline views. Correlate logs, alerts, and threat intel, track investigations with cases, and link detections to MITRE ATT&CK.
Build custom enterprise search
Connect and tune custom search experiences across websites or internal content. Analyze query trends, monitor and optimize query performance, and support vector search uses.
Build, deploy, and operate in production
Operate, manage, and optimize your Elasticsearch deployment with tools for data lifecycle, RBAC, access control, audit logging, and cluster diagnostics. Use AutoOps for automated insights and recommendations on performance, query tuning, and data storage.
Kibana developer resources
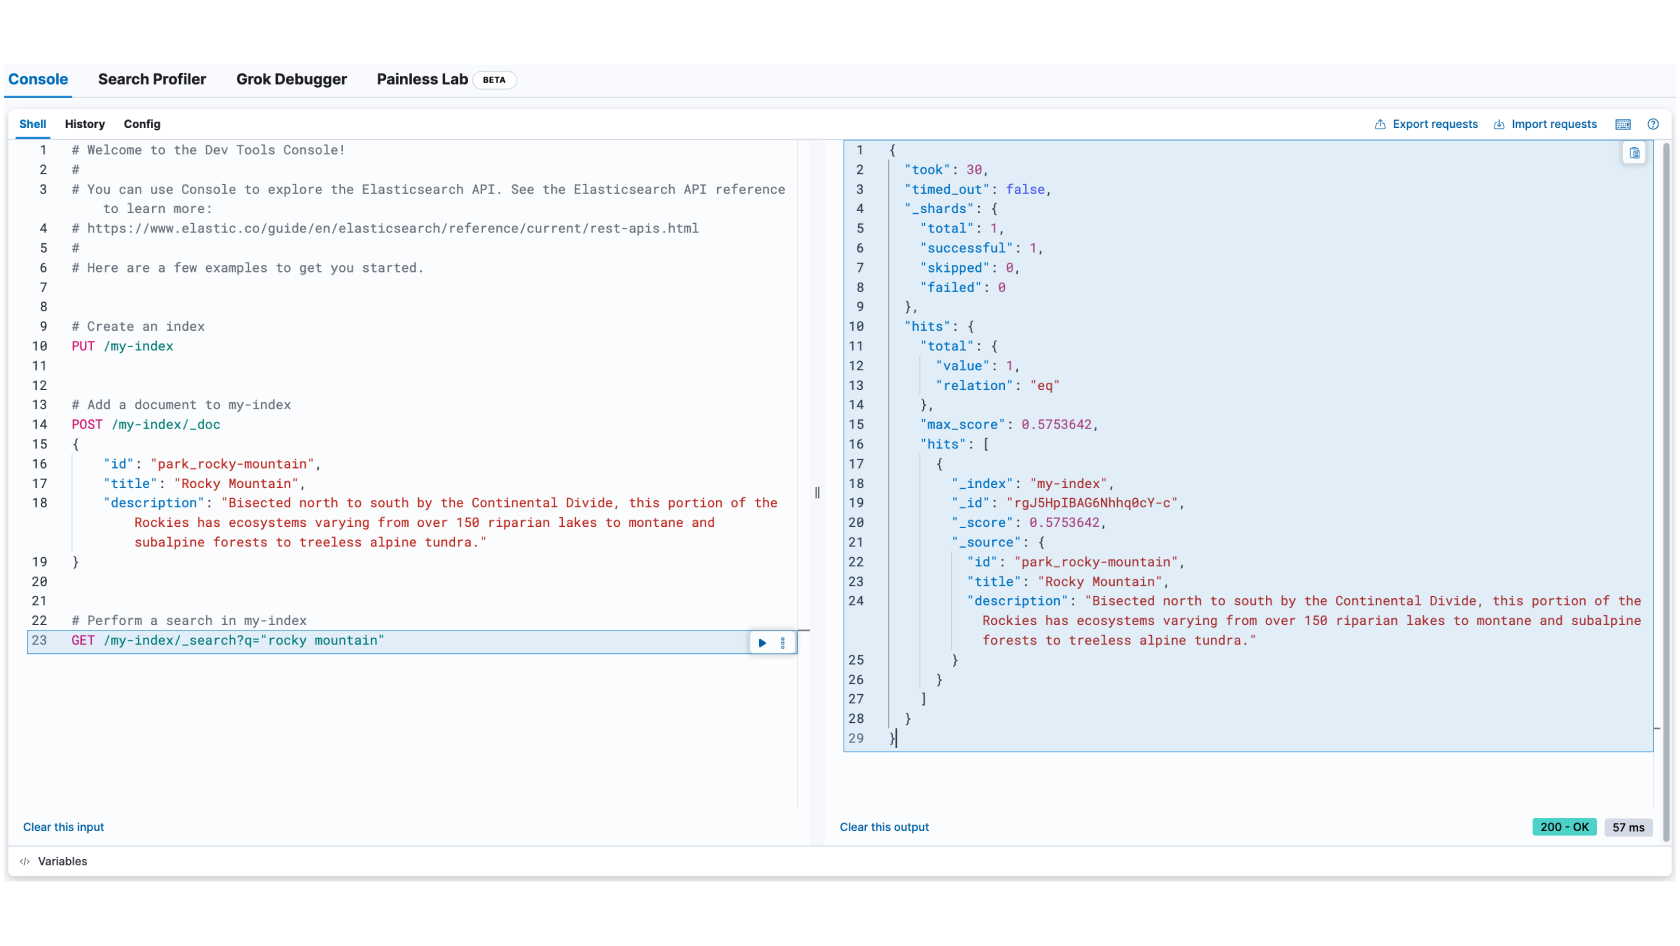
Run Elasticsearch API calls, test queries, update data, and debug responses using an interactive JSON editor with autocomplete.
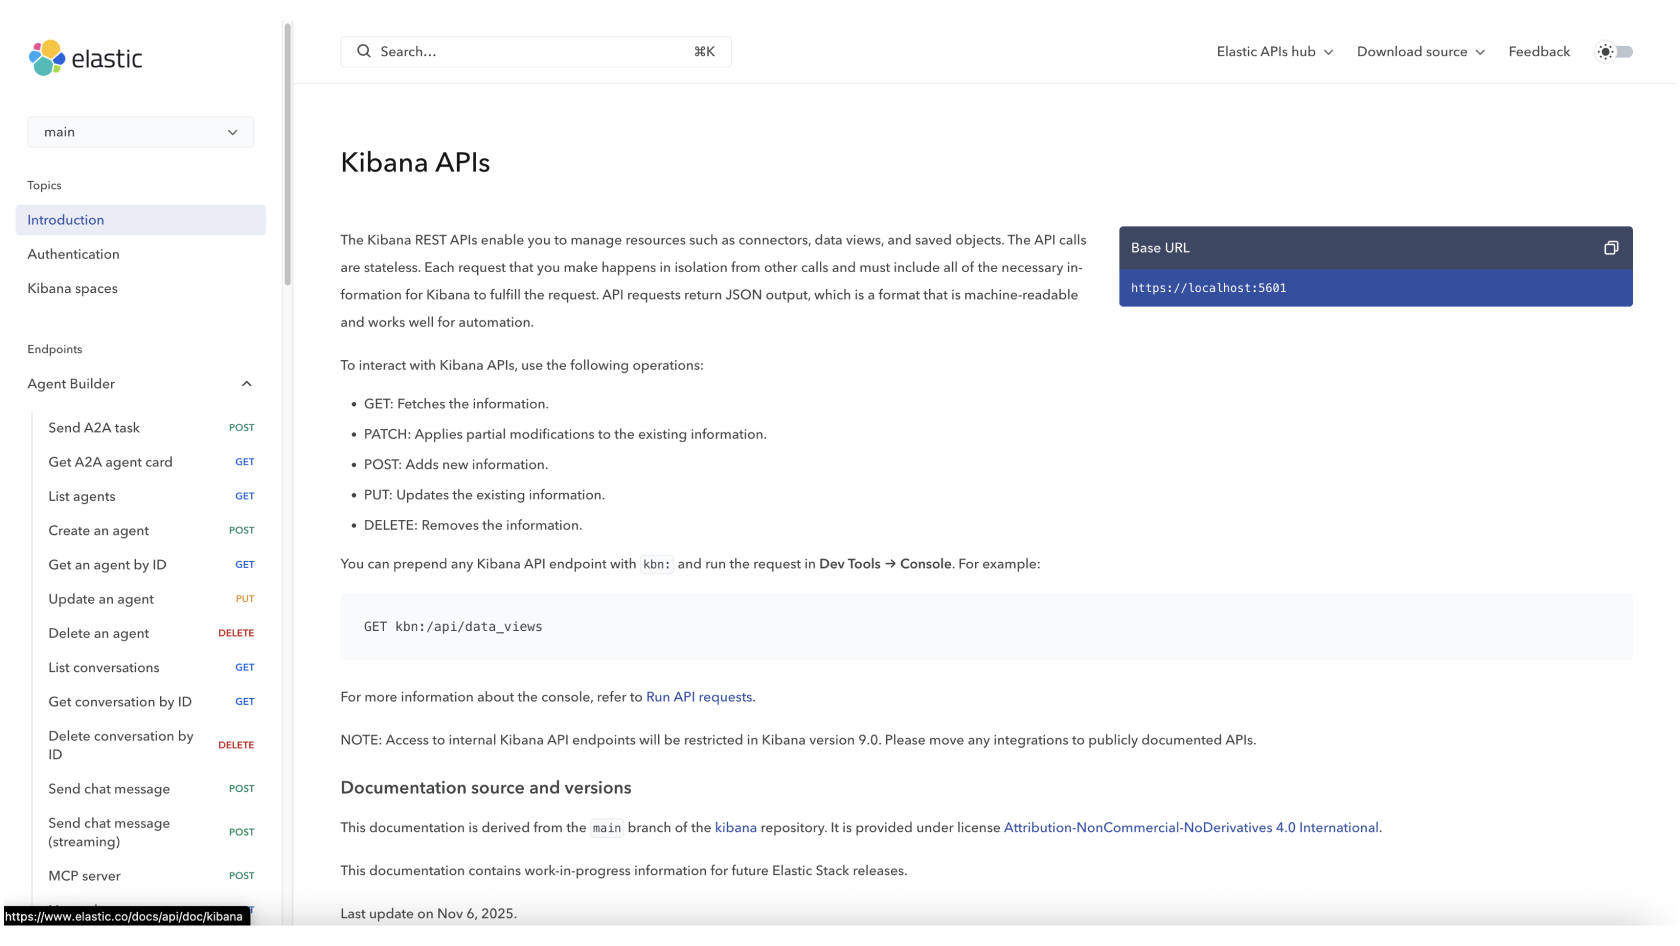
Manage your Discover Sessions, Dashboards, Visualizations, Maps, Alert Rules, and more with Kibana’s API or Terraform provider.
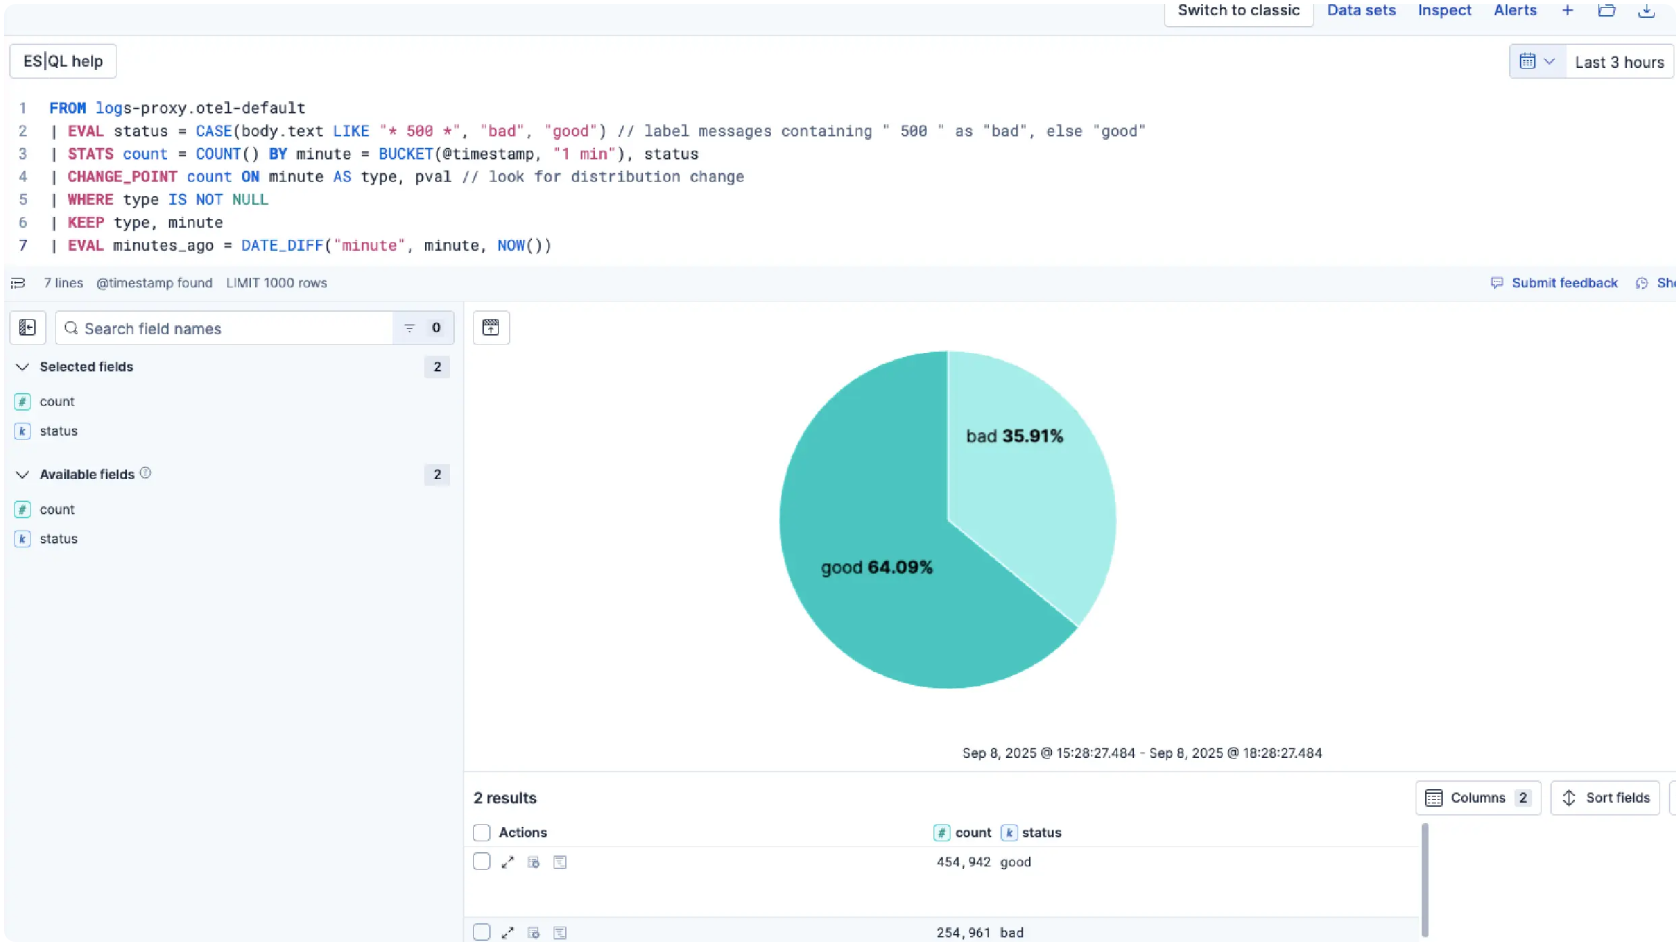
Get Kibana ES|QL IDE complete with data browsing, rich field auto-complete, recommended queries, query history, and more.
From a laptop to a hundred-node cluster, Kibana works the same everywhere. On-premises, in the cloud, or across clouds — we'll be there.
Elastic Cloud Serverless
Do less with Serverless
Hassle-free operations with a fully managed serverless offering — the easiest way to ramp up search, observability, and security.
Elastic Cloud Hosted
Deploy hosted Elasticsearch and Kibana on AWS, Google Cloud, and Azure
Spin up a fully loaded deployment on the cloud provider you choose. As the company behind Elasticsearch, we bring our features and support to your Elastic clusters in the cloud.
On-Prem
Download Kibana/Elasticsearch
Grab a fresh installation and start running Kibana and Elasticsearch on your machine in just a few steps.
Built for builders
Customer spotlight

Chat Leap uses Elastic to power global campaigns reaching millions of customers for everything from Black Friday sales to global sporting events.
Customer spotlight

Brolly greatly streamlined its entire incident management with Elastic Observability.
Customer spotlight

Lawrence Livermore National Laboratory maximizes its HPC system availability for ground-breaking national security and scientific research with Elastic Security.
Join the neighborhood
Explore what others are doing with Kibana, ask questions, and get help when you get stuck.

Dive into Elastic forums — discuss, learn, teach, troubleshoot, and explore with the global community.

Talk shop, share search wins, and network with peers at your local Elastic community meetup.

Slack off the right way — join the Elastic Slack channel and stay connected with fellow search ninjas.