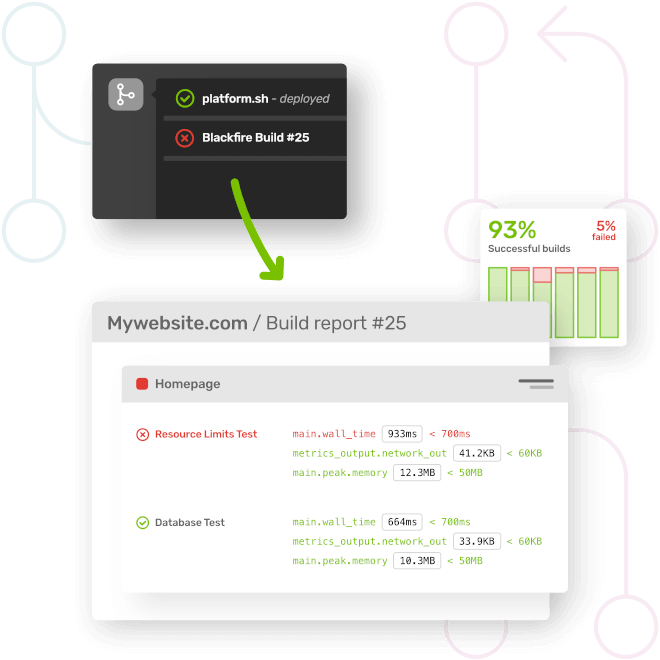
Get actionable performance insights
Get precise, data-driven insights and recommendations to enhance your app's efficiency.
Blackfire provides automated profiling and actionable guidelines, eliminating guesswork and helping teams continuously improve performance
Build resilient and crisis-free apps
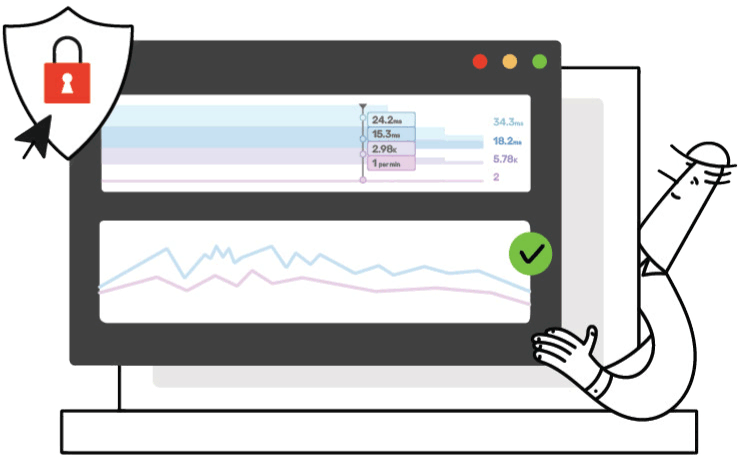
Avoid firefighting with a structured approach to performance monitoring.
Blackfire helps you detect performance risks before they escalate, empowering teams to prevent and rapidly resolve crises confidently.
Debug smarter, build faster
Reduce debugging time and focus on delivering value to users.
With Blackfire's continuous observability, you identify and fix issues faster, freeing up time for feature development and product innovation.
See why developers choose Blackfire
| Procrastination (No Observability) | DIY | New Relic / Datadog | Blackfire | |
|---|---|---|---|---|
| Out of the box observability | ✗ | Complex initial setup | Moderate initial setup | Immediate, fully functional with minimal configuration |
| Observability pipelines configuration and maintenance | ✗ | Extensive manual setup | Managed for the users | Managed for the users |
| Bug discovery process speed | Slow | Moderate | Good | Fastest Automated, integrated performance discovery |
| Actionable recommendations and insights | ✗ | Limited | Good | Clear, developer-focused, highly actionable insights |
| Crisis management | Chaotic and expensive | Depends on manual setup | Real-time alerts | Proactive crisis prevention Efficient mitigation |
| Performance issues proactive detection | Reactive only | Limited | Good | Straightforward and proactive detection coupled with your CI/CD pipelines |
| Help you become a better developer | ✗ | ✗ | Moderate | Highly effective Intuitive insights for continuous improvement |
| Cost of fixing performance issues | Very high | Moderate-to-high | Moderate | Lowest Highly proactive detection prevents major costs |
| Optimize development resources and time | Constant firefighting | Limited | Moderate | Highly effective |
Here's what results our clients achieved:
3xLoad time decrease for Symfony.com
1monthFaster time to market for NKD.com
20xMore orders for GOG.com
Built in Europe by developers, for developers.
Trusted worldwide, by teams like yours
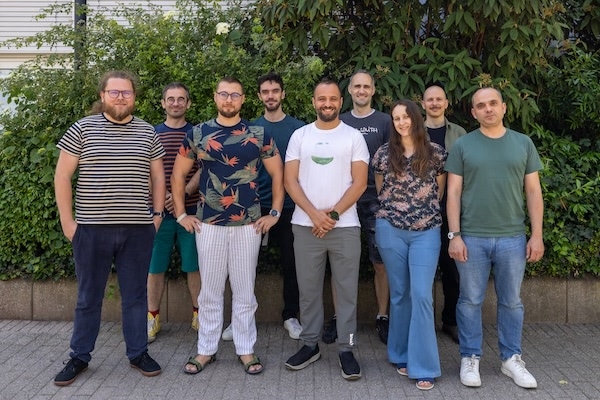
Blackfire was born from the world of open-source software in the heart of Europe.
We saw engineering teams struggling with performance bottlenecks and drowning in observability data without answers. So we built a different kind of tool: one that delivers precise, actionable insights, helping developers stay in control of their applications, without the noise.
Today, Blackfire is the leading Web Observability solution in Europe for decoupled PHP and Python applications — trusted by over 1,000 engineering teams worldwide.
In 2021, we joined forces with Platform.sh, expanding our mission to provide 360° actionable observability. Together, we empower developers with the tools they need to build, scale, and optimize their applications confidently — with performance as a feature, not an afterthought.
Maximize performance efficiency with real-time insights
Effortlessly identify and address performance bottlenecks, enhancing the efficiency of your application's most resource-intensive areas.
Achieve high performance with low overhead while maintaining full observability of your entire application.
Achieve instant bottleneck detection through continuous application monitoring and thorough code execution analysis.
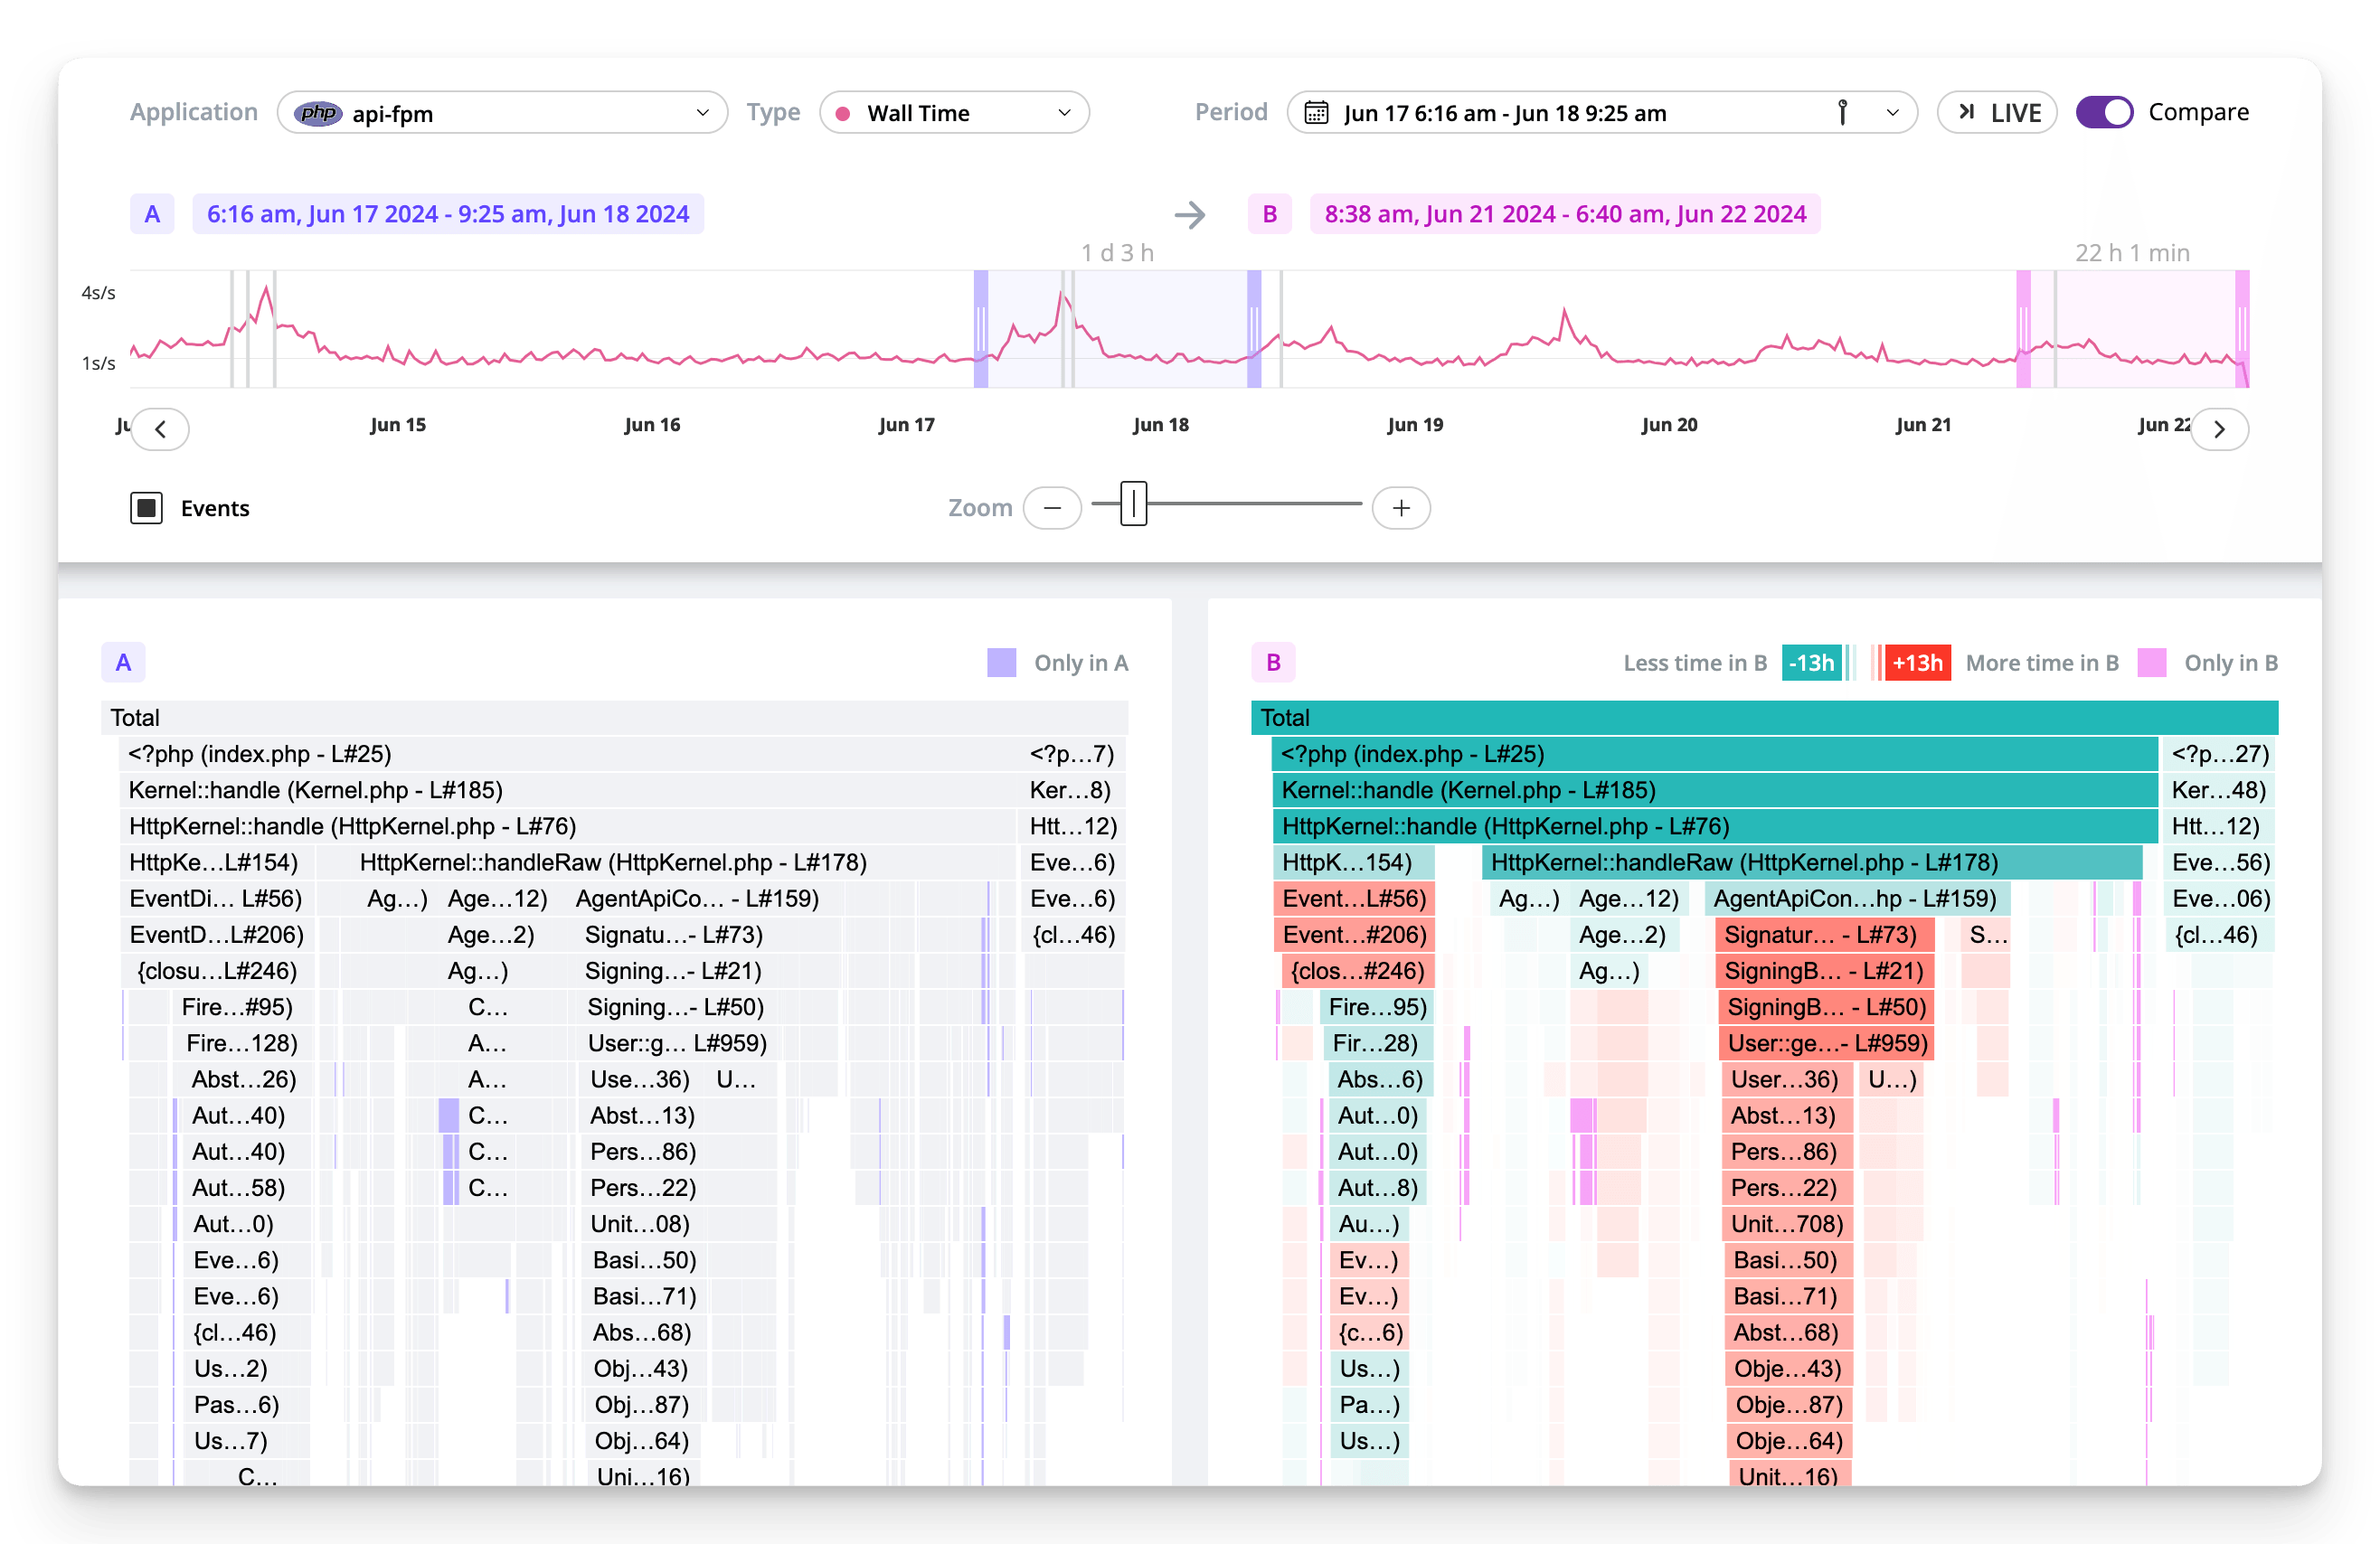
Live monitoring in production
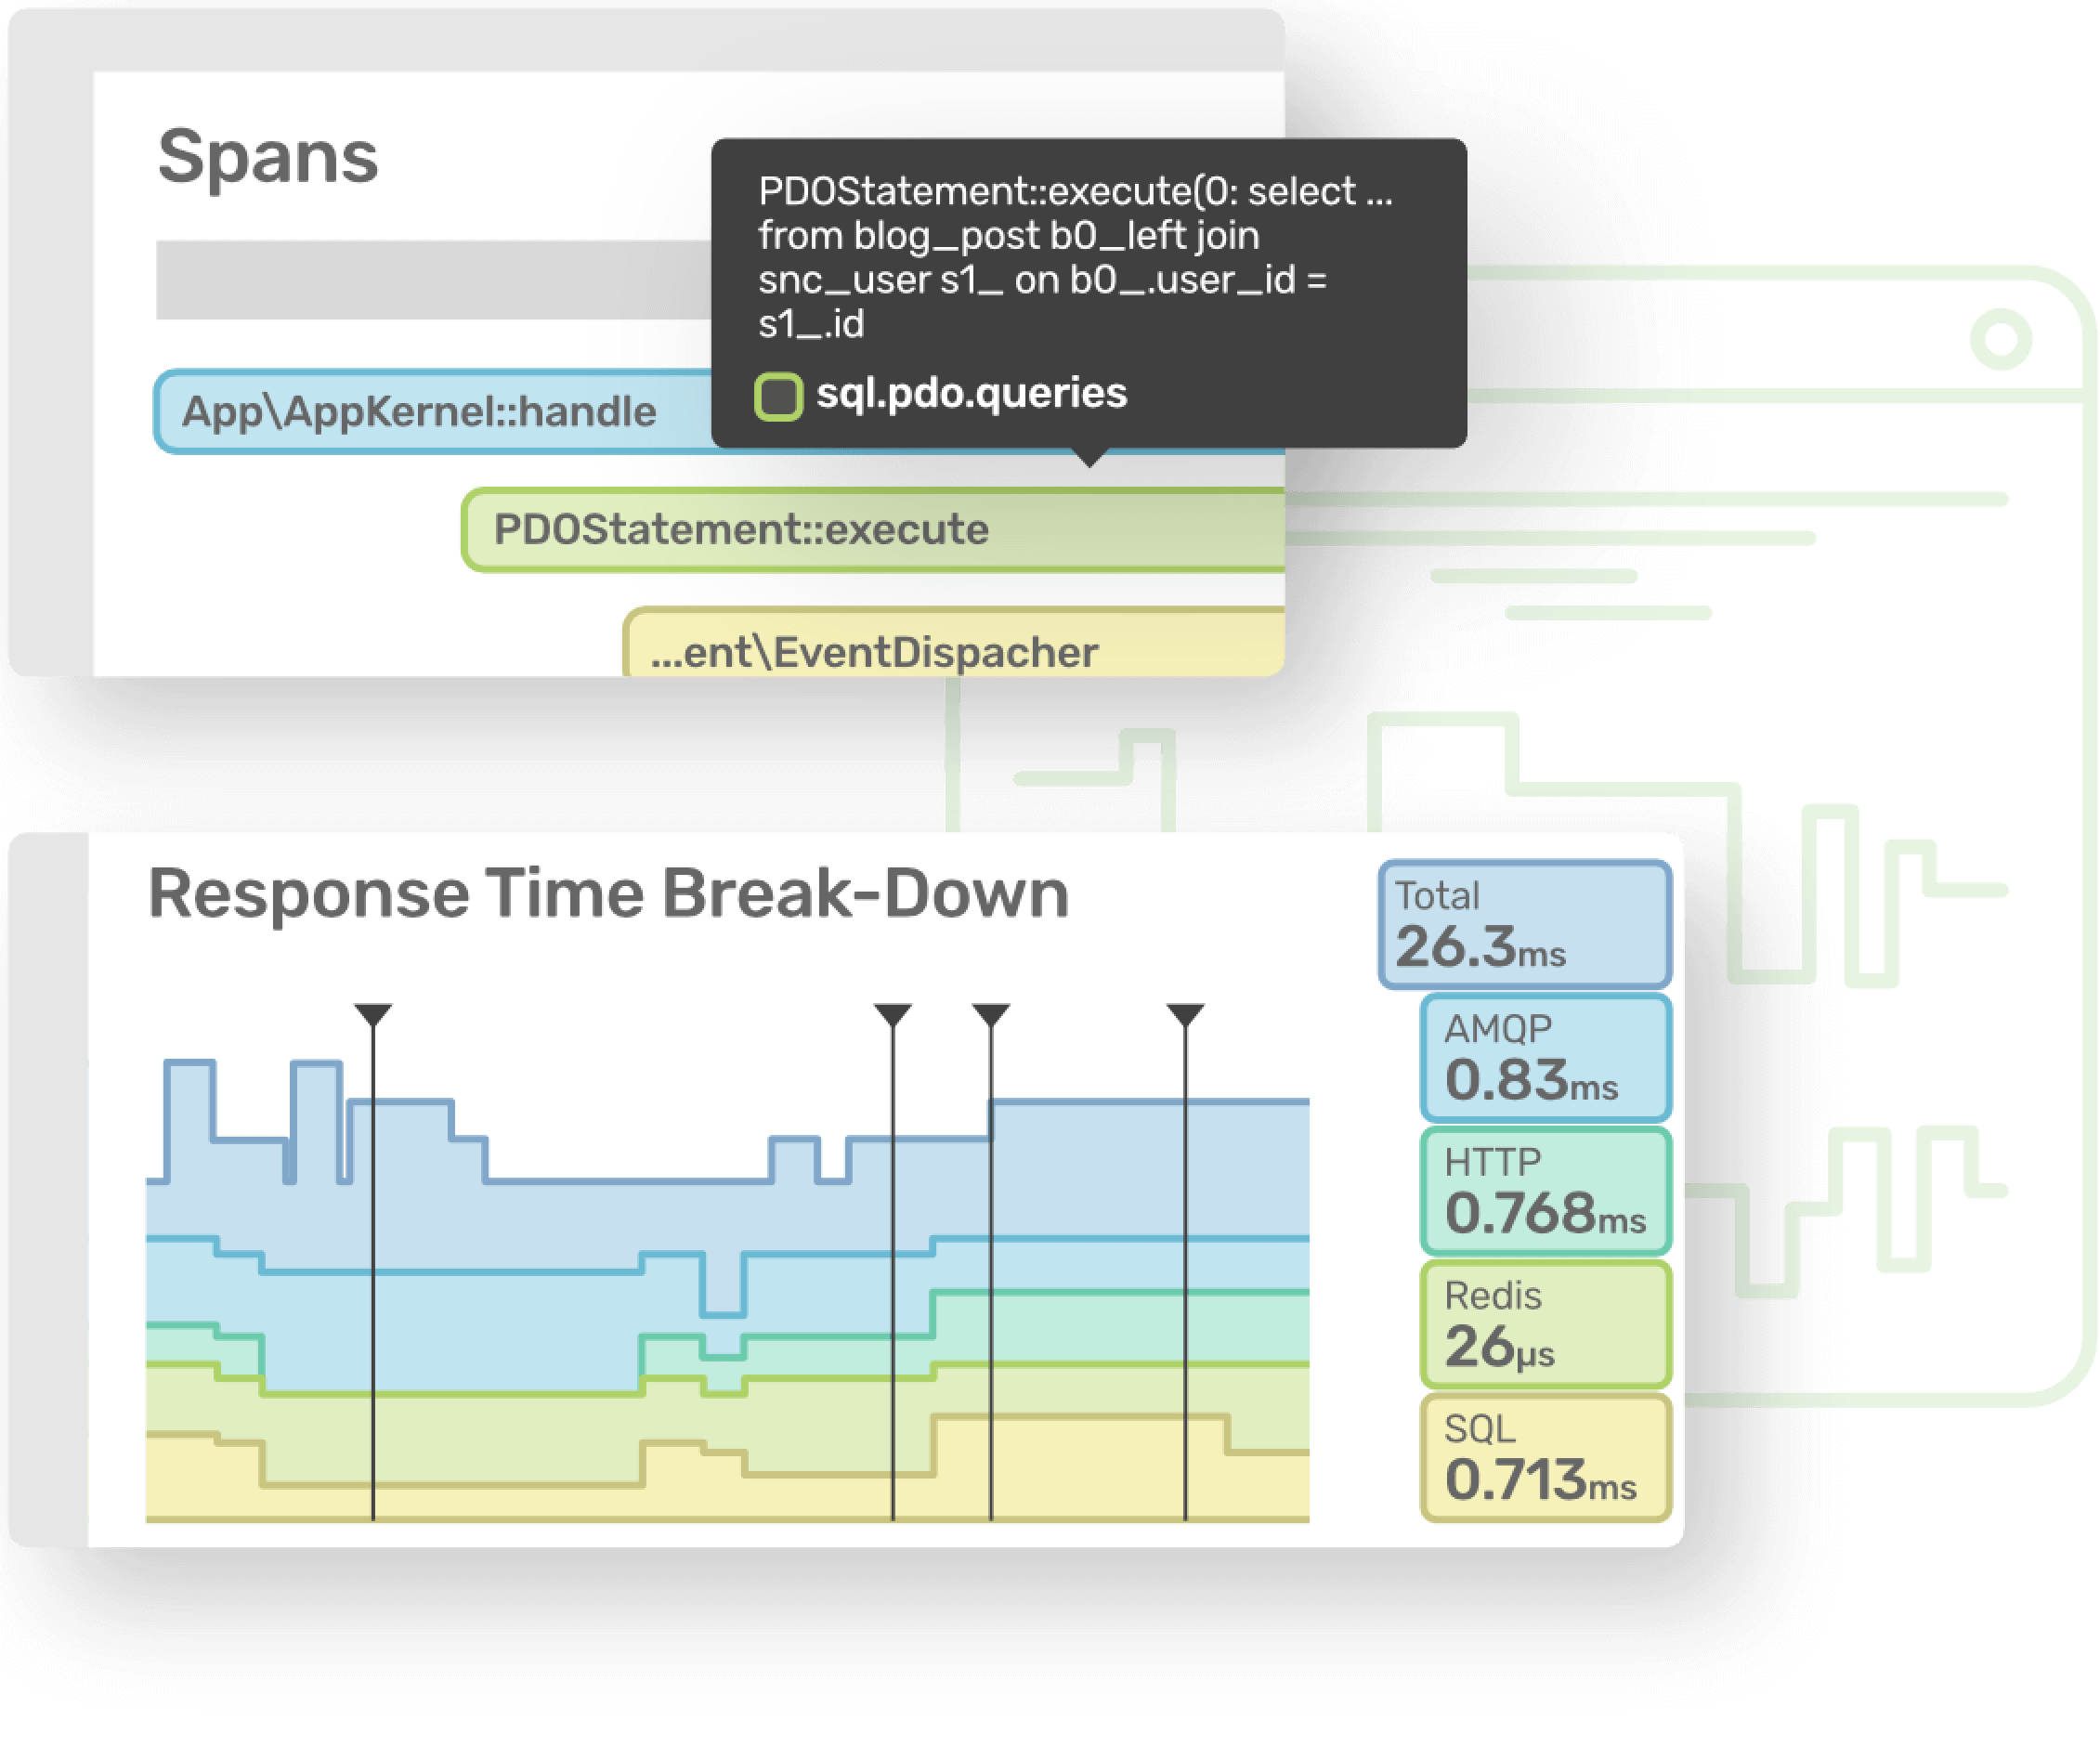
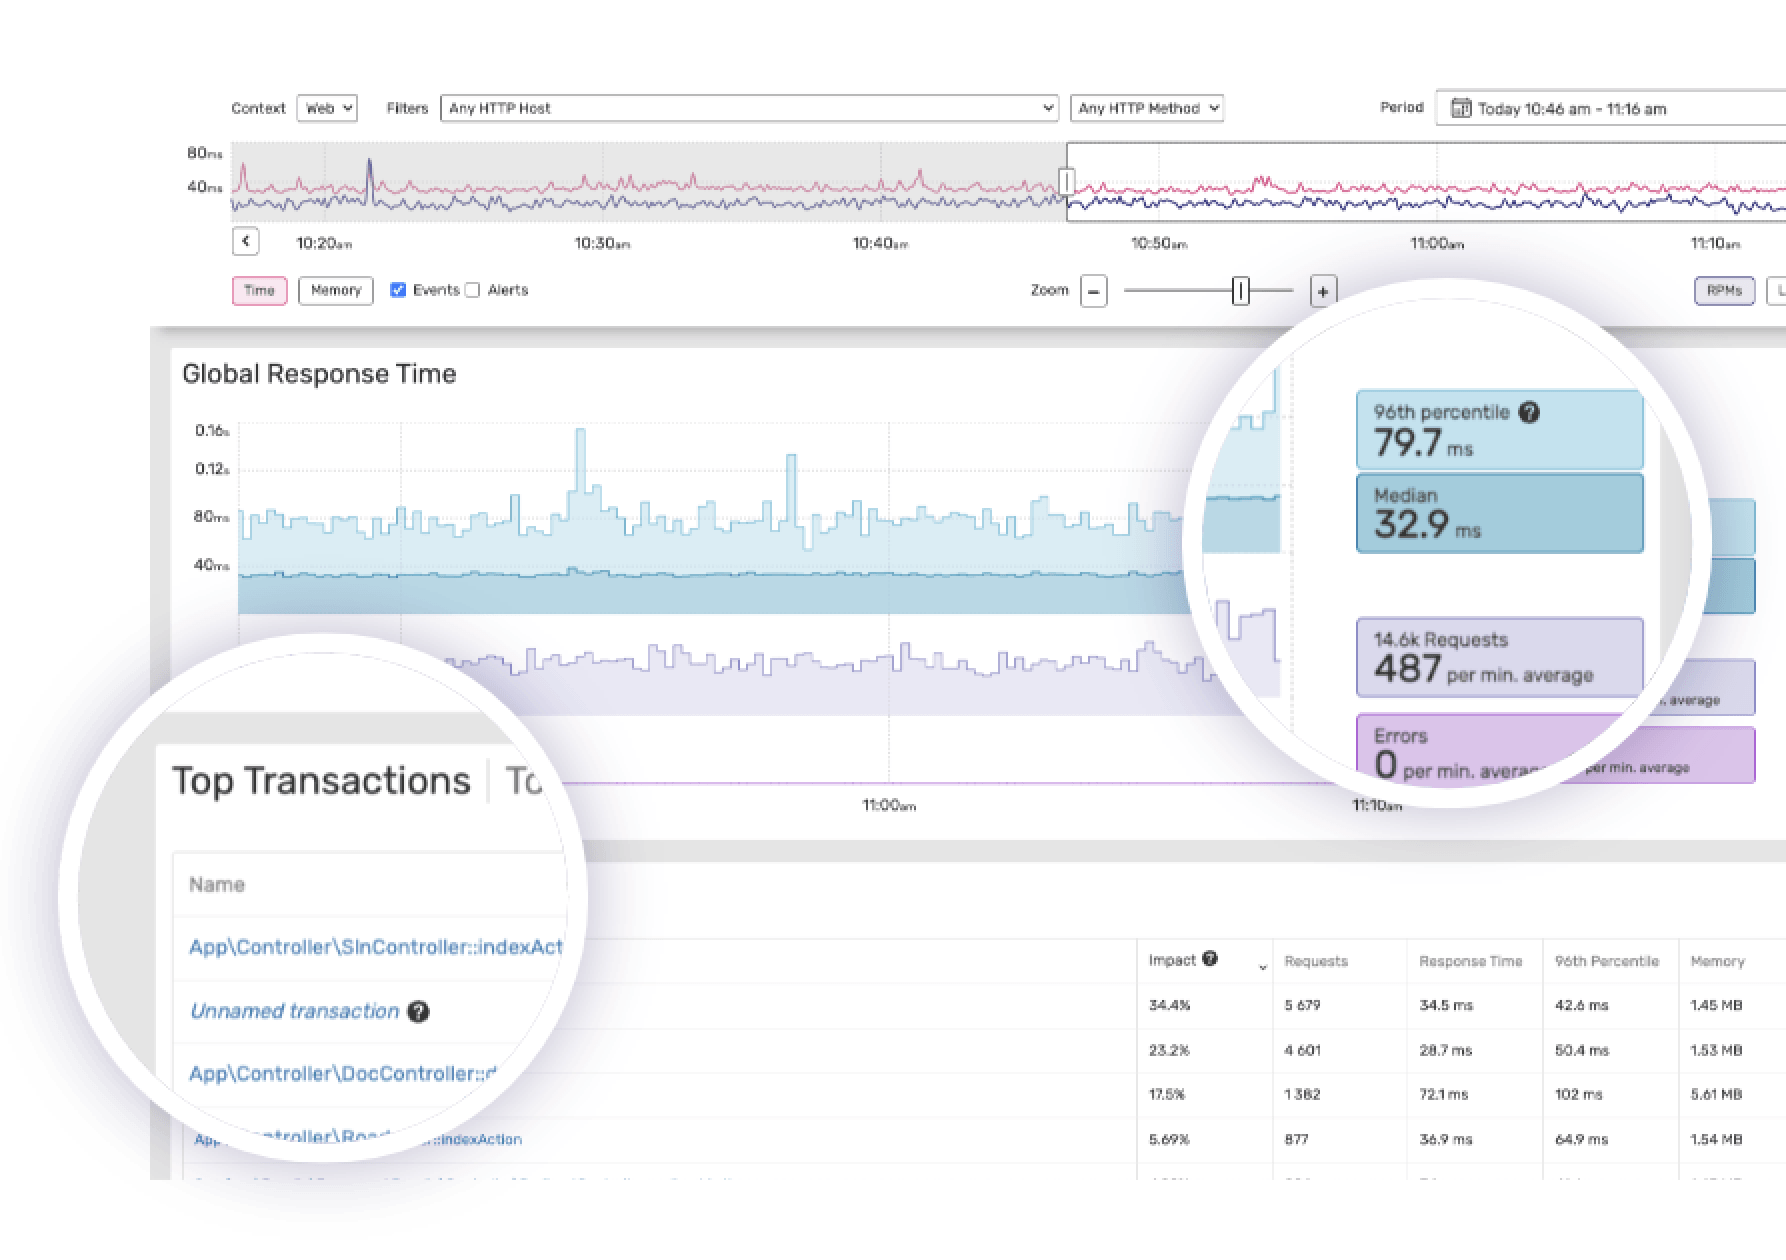
From overall application health to code-level insights, get facts and figures about how your application performs in production.
Monitor server-side response time and memory usage. Drill-down and find bottlenecks in transactions and service calls (e.g., SQL, HTTP, queues).
Obtain unrivaled visibility in your code's behavior while Blackfire automatically profiles key transactions.
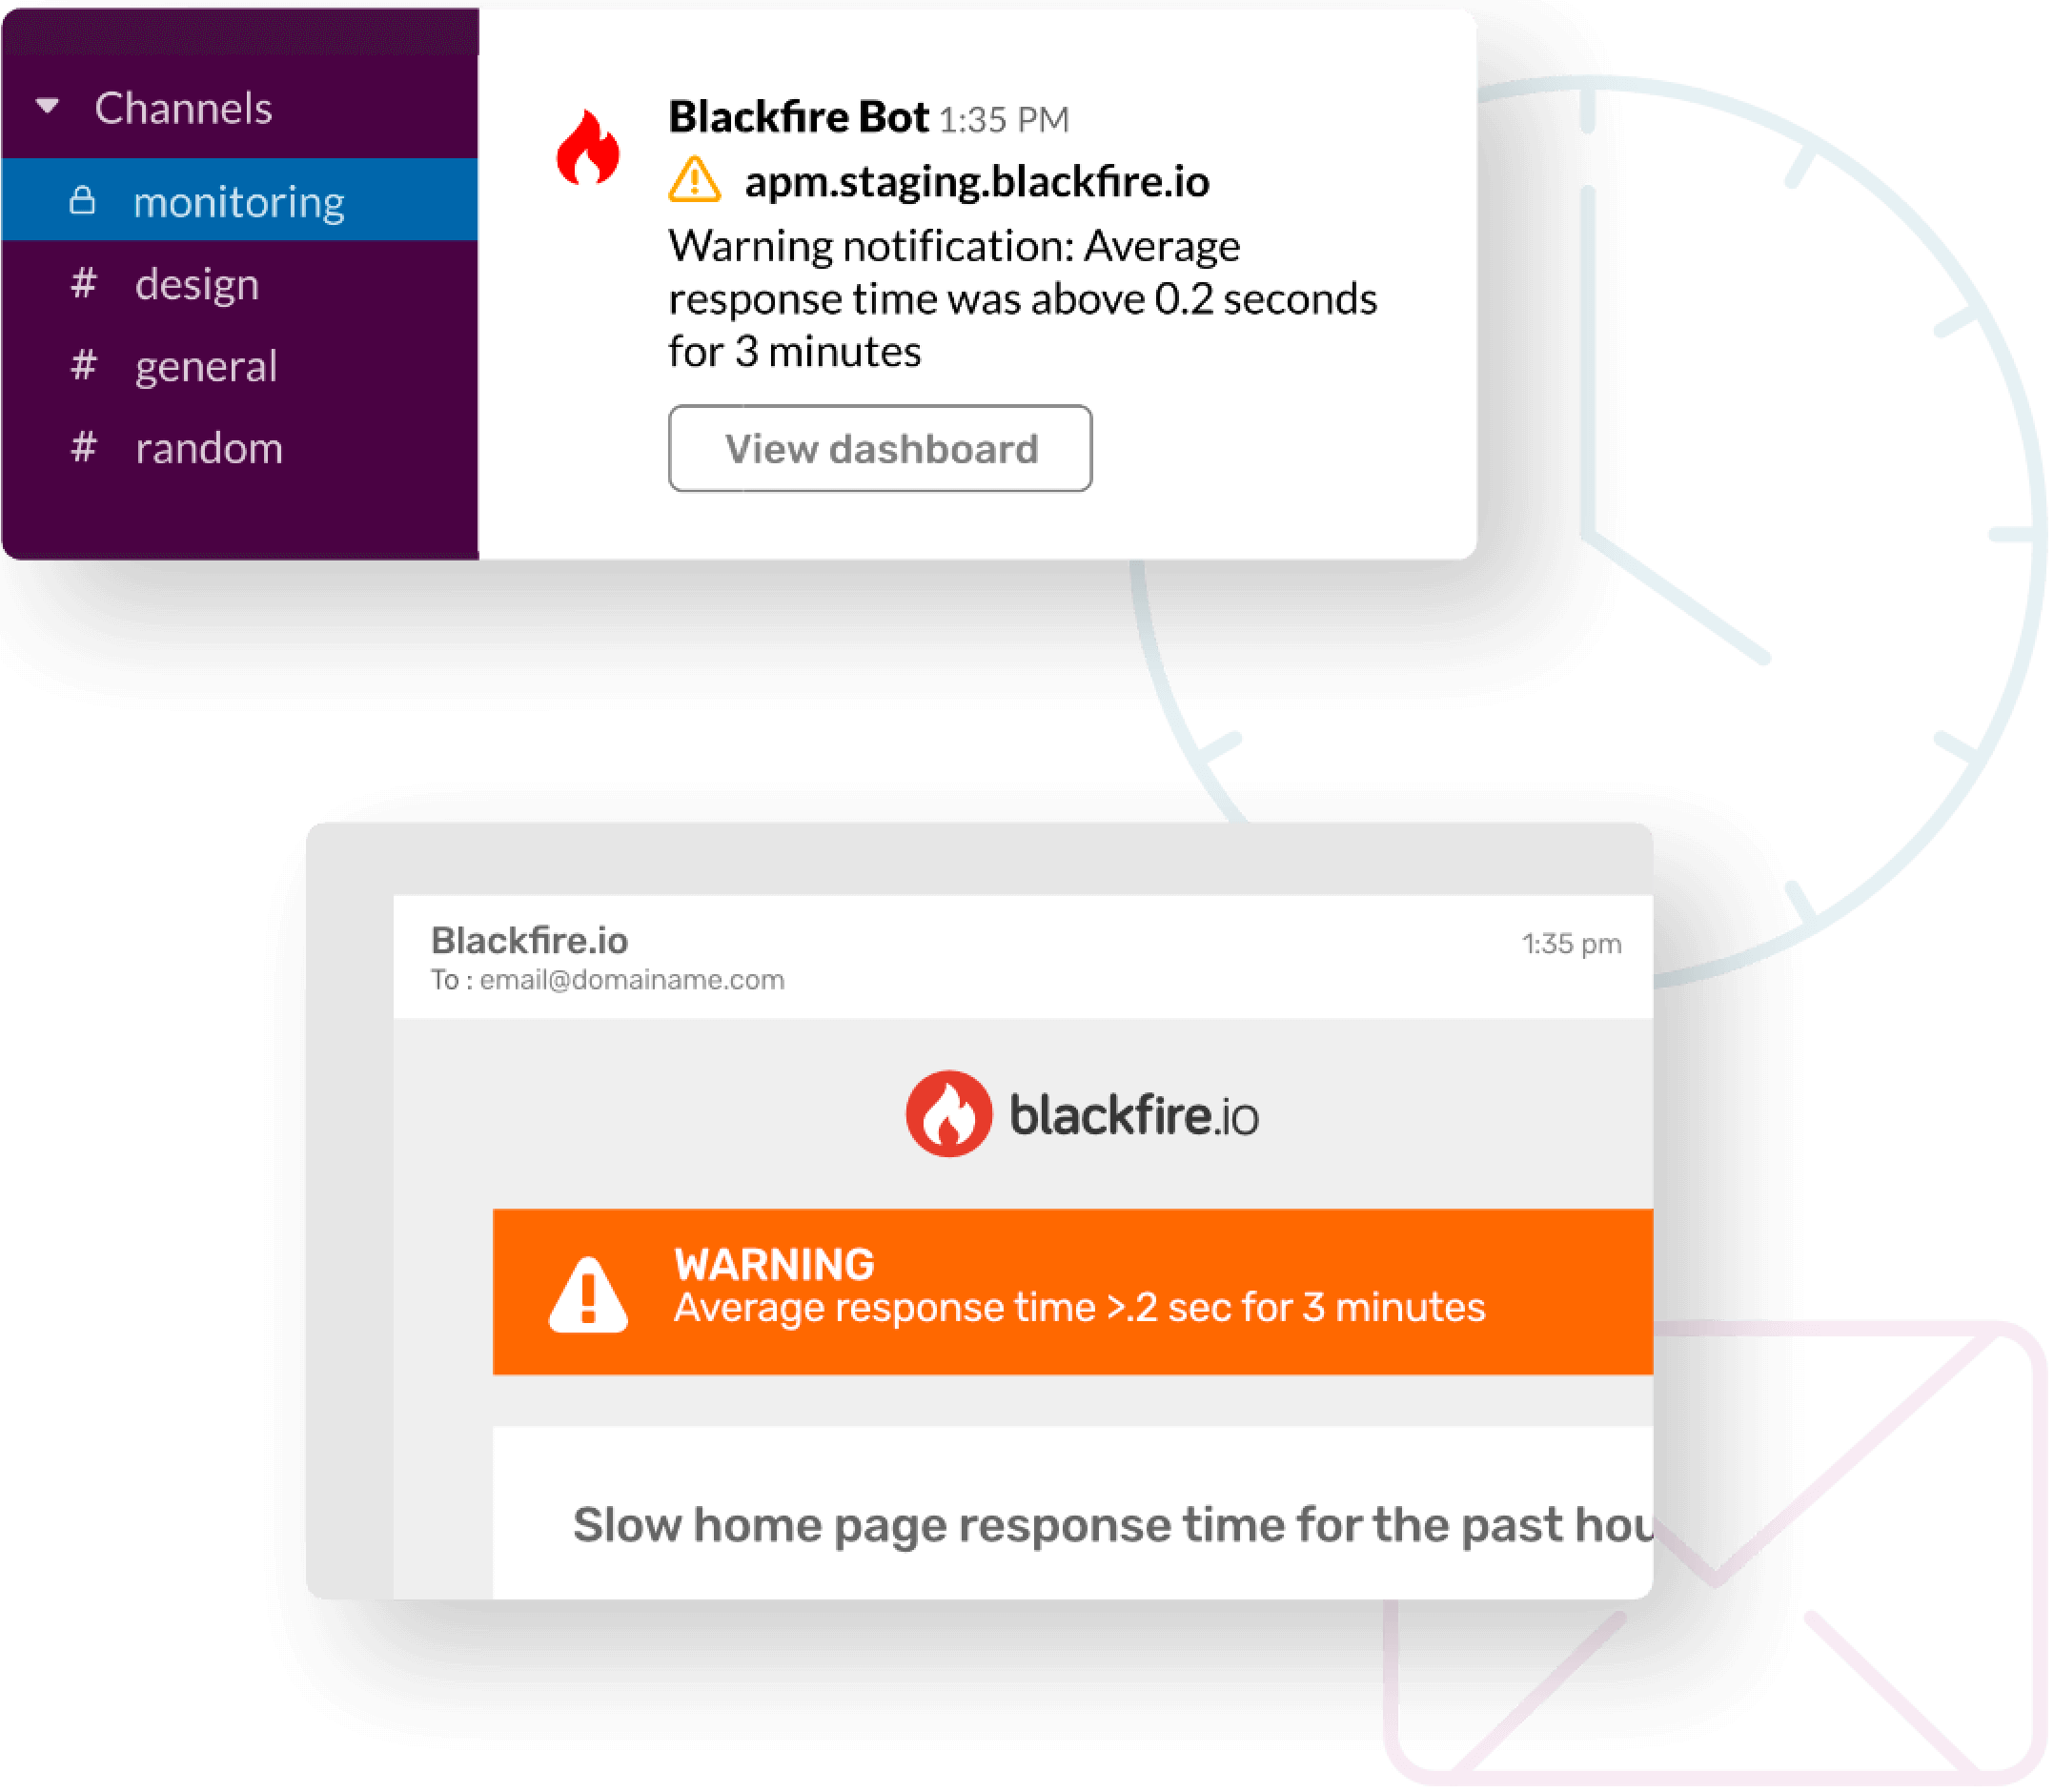
Receive an alert when something goes wrong.
Deterministic profiling in production, development, test/staging
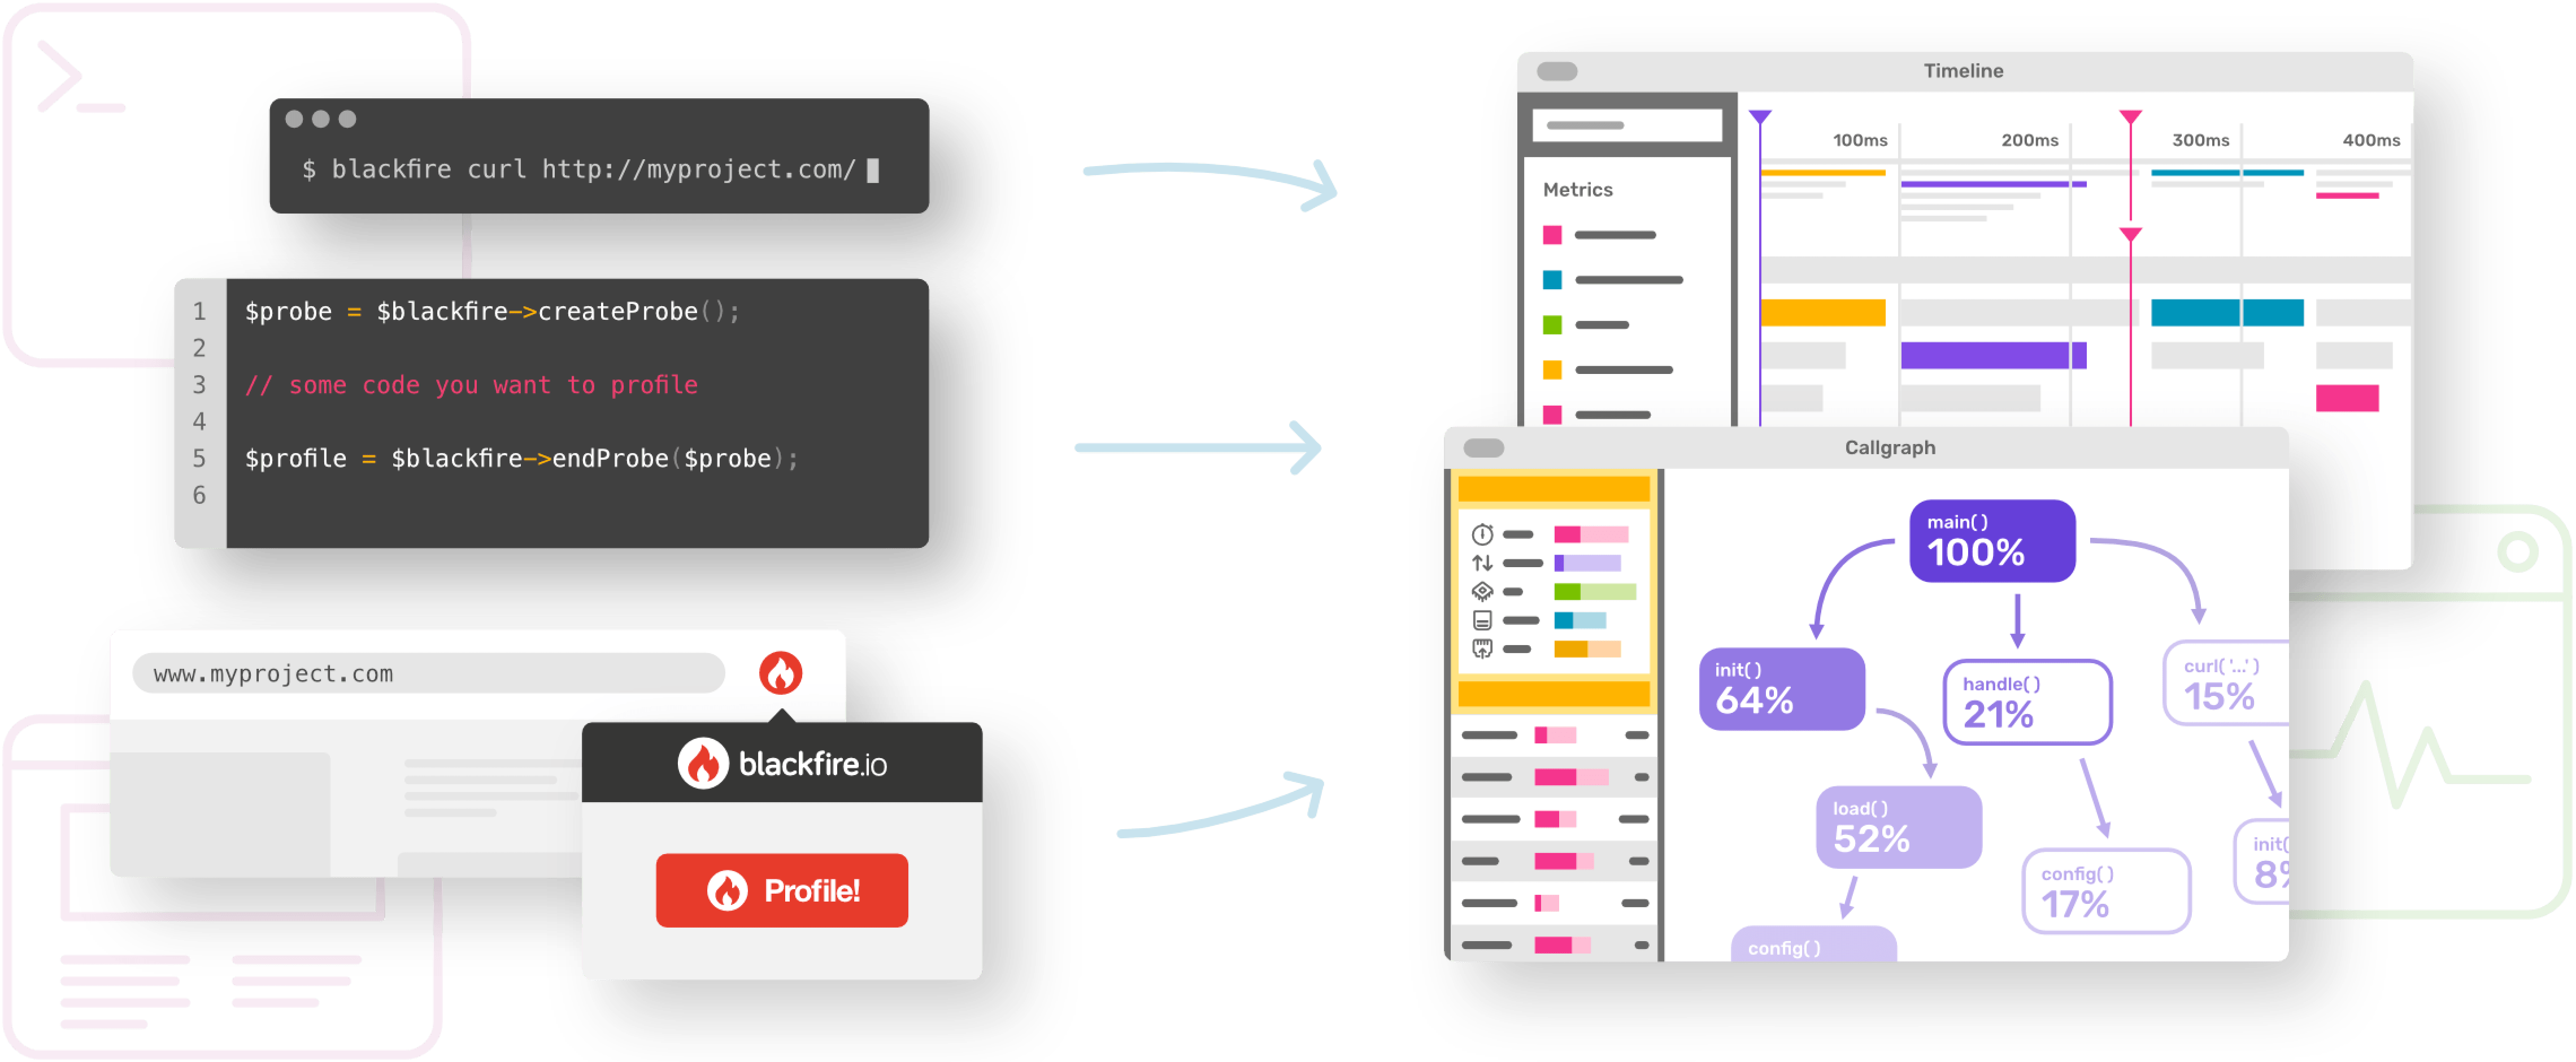
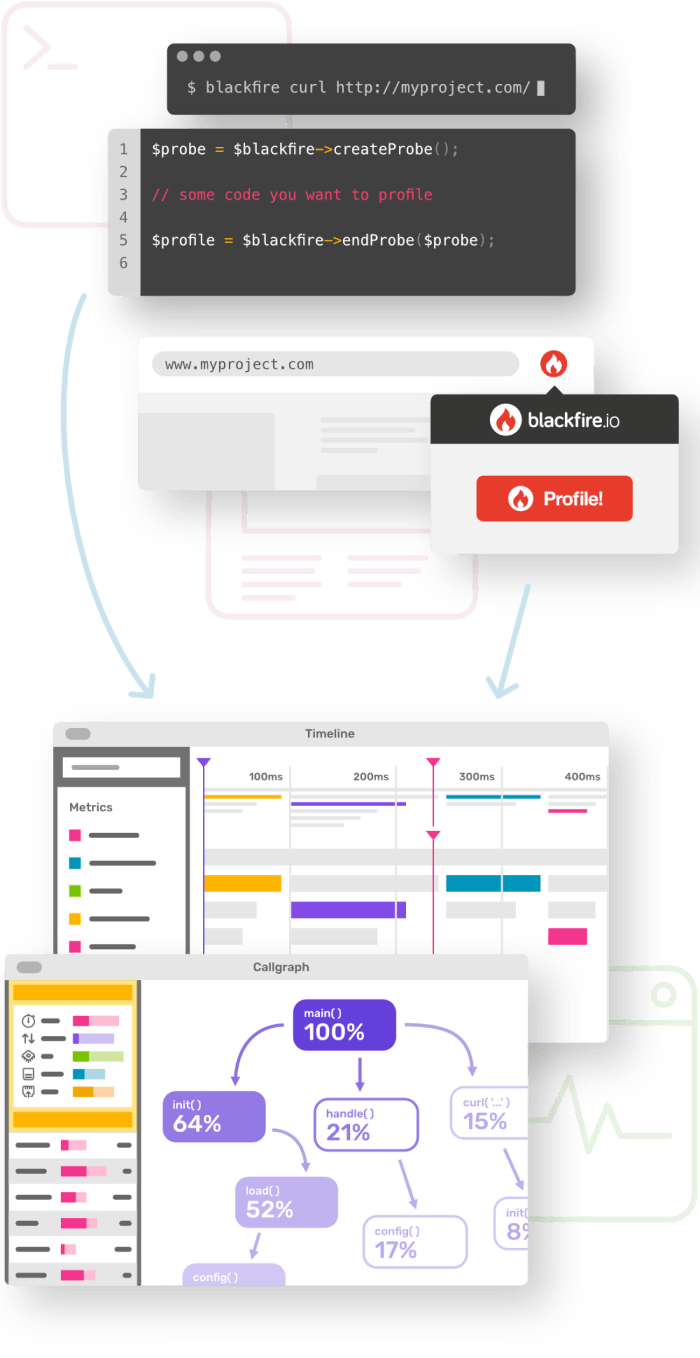
Blackfire's unique deterministic profiling technology for PHP and Python collects function-call-level metrics that help you understand exactly how your code behaves.
Through time-sequence and behavioral visualizations, analyze how code consumes time, memory, and network. Find slow SQL queries and HTTP requests.
Collect these kinds of metrics from your live production site, then reproduce measurements on local machines. Iterate and compare iterations to validate code changes.
Performance testing
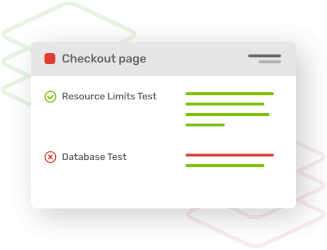
Performance is a feature. It should be tested as such.
Thanks to Blackfire's cutting-edge profiler, extend your test suite from unit-tests, integration tests, and functional tests to performance tests.
Never let a performance regression be deployed on production.
Benefit from our extended support of PHP, Symfony, Laravel, Magento, Drupal, Typo3, Wordpress, Python, Django, with built-in metrics and default assertions.
Automated testing workflows
Synthetic user monitoring, CI/CD integration, unit tests integration? We've got you covered.
Leverage Blackfire's flexible profiling automations to run performance tests proactively, whenever needed. Use the open-source crawler, scraper and tester, SDKs, and native integrations, or configure basic testing scenarios right from the Blackfire web application.
Get comprehensive build reports and notifications where and when it matters—from email to Slack, and GitHub, Bitbucket, or GitLab.