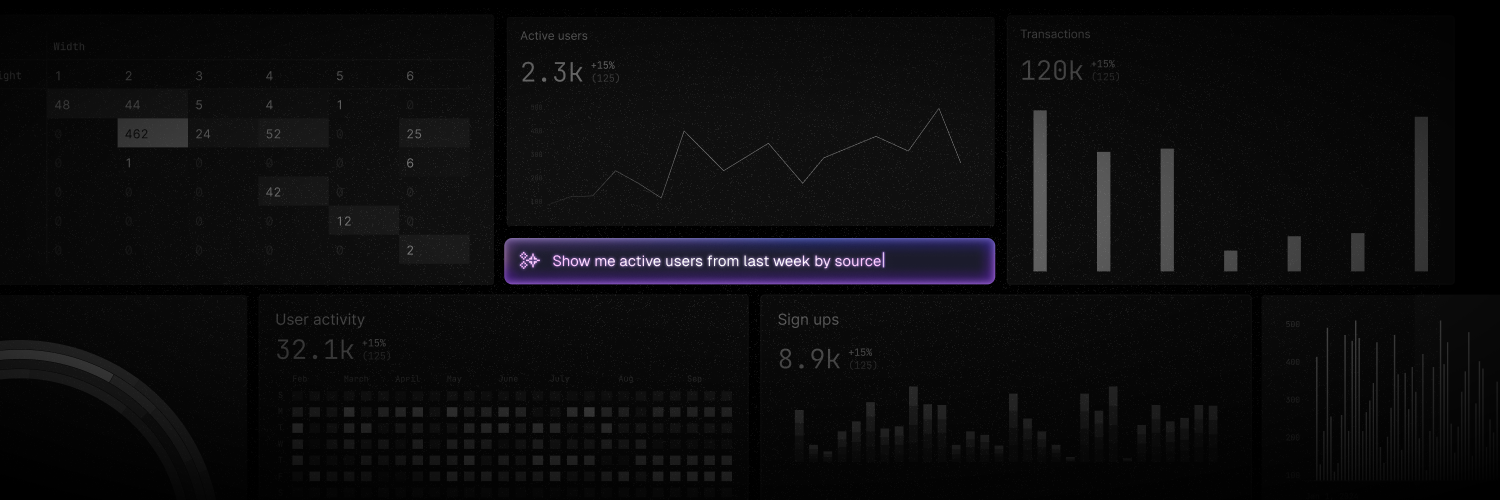
 Basedash lets you create beautiful charts and dashboards using natural language. Just describe what you want to see and Basedash will generate the rest.
For a product overview outside the docs, see the Basedash AI chat and dashboards pages.
Basedash lets you create beautiful charts and dashboards using natural language. Just describe what you want to see and Basedash will generate the rest.
For a product overview outside the docs, see the Basedash AI chat and dashboards pages.
What makes Basedash different?
Unlike traditional BI tools, Basedash uses AI to do the heavy lifting. Instead of manually writing SQL queries or clicking through complex chart builders, you can simply:
- Describe your charts in plain English - “Show me monthly revenue growth” or “Compare sales by region”
- Chat with your data - Ask follow-up questions and drill deeper into your insights
- Get instant visualizations - AI automatically chooses the best chart type and formatting
- Collaborate with your team - Share dashboards and insights across your organization
If you’re comparing Basedash with traditional BI platforms, start with the BI tools comparison hub.
Signing up
Basedash is now available to everyone! You can sign up here to get started. The signup process is simple:
- Create your account using your email
- Verify your email
- Start connecting your data sources and building charts
Getting started
Once you have access to Basedash, you can connect your data and start creating dashboards.
Watch our getting started guide
Need help?
If you have any questions or need assistance:
- Check out our detailed guides in the documentation
- Join our Slack community
- Email us at support@basedash.com