Updated: October 28th, 2025
DebugView is a great feature in Google Analytics 4 and is a solid improvement compared to GA3 (Universal Analytics). It allows you to debug incoming data at a very granular level. However, sometimes it just does not work. And that’s probably the exact reason why you are on this page.
By saying “not working”, I mean that you cannot see data coming in from your own device (a.k.a. “No devices available”). If that’s the case, I have several tips that might help you troubleshoot this issue.
If you know (or find) other possible solutions, please let me know in the comments, and I’ll update the guide. Let’s make this guide useful for as many people as we can.

Table of Contents
Here’s what you will learn in this article
- #1. Debug mode parameter is not set
- #2. Check filters
- #3. Google Analytics is blocked by some browser extension
- #4. Google Analytics is blocked by developer tools
- #5. Google Tag Manager may be blocked by a browser extension
- #6. Using Brave browser?
- #7. Weird delays (sometimes)
- #8. Bugs
- #9. Using server-side tagging?
- #10. Content security policy is blocking GA
- 11. Consent
- #12. Log out of the WordPress admin panel
- #13. Check if you have selected the correct device
- #14. Automatic migration from Universal Analytics
- #15. Completely restart the browser
- #16. Clear browser cache and cookies
- #17. Wrong GA4 property
- #18. ga-disable-XXXXXX
- Final words
Video tutorial
If you prefer video content, here’s a tutorial from my Youtube channel.
Before you begin: The 4 most common checks
DebugView issues often stem from a few common oversights. Before exploring all reasons, quickly verify these four things:
- Is Debug Mode actually enabled? Double-check: Is the GA Debugger Extension ON, OR is GTM Preview Mode connected, OR did you manually set the debug_mode parameter? Confirm the _dbg or ep.debug_mode parameter is in the GA4 network requests (See Tip #1 for how).
- Are internal/developer filters active? Go to Admin > Data Settings > Data Filters. If the “Internal Traffic” filter is active, it WILL block DebugView, even if “Developer Traffic” is also active. Try temporarily disabling the Internal filter. (See Tip #2).
- Are browser extensions interfering? Temporarily disable ALL browser extensions, especially ad blockers and privacy tools (like Ghostery, uBlock Origin, even VPN extensions). Retry DebugView. (See Tips #3, #5).
- Are you viewing the correct GA4 property? Verify the Measurement ID (G-XXXX) on your site matches the property you’re viewing in GA4 Admin > Data Streams. (See Tip #17).
If none of these tips apply to you, continue reading to learn other reasons (and solutions).
#1. Debug mode parameter is not set
As I explained in this blog post, DebugView shows only those events that have a particular debug mode parameter included. It can be either ep.debug_mode or _dbg. And there are three ways how it can be added to web events.
- By installing and enabling the GA debugger Chrome extension
- Or by having enabled Google Tag Manager’s Preview mode on a page that you’re debugging
- Or by sending a debug_mode parameter together with an event
Any of these options will add _dbg or ep.debug_mode parameters to GA4 requests. You can learn more about each option here.
If you want to learn how to enable the DebugView on mobile apps, please refer to this page.
Even if you are 100% sure that one of those 3 options is configured properly, you can still check if the _dbg or ep.debug_mode are actually included in outgoing GA requests. In your browser, go to developers tools. I will be using Chrome, therefore, I will click 3 dots > More tools > Developer tools.

Then go to the Network tab, and in the search field, enter “collect?v=2” (without quotation marks). Refresh the page where you are debugging your GA4 setup. Then you will see the list of all requests that are sent to GA4. Click any recent request and then keep looking for either _dbg or ep.debug_mode.

If you see them, then this is ok. If not, read this blog post and enable the DebugView parameter by choosing any of 3 options:
- GA debugger Chrome extension
- Having GTM preview mode enabled
- Or manually sending the debug_mode parameter

#2. Check filters
At the moment of writing this blog post, Google Analytics 4 offers a basic set of filtering features. One of them is the ability to exclude your internal traffic based on IP address.
There are two types of IP-address-based filters: internal traffic and developer traffic.
- Internal traffic is supposed to exclude all events that are coming from IP addresses (that are configured in Admin > Data Streams > Web Data Stream > More Tagging Settings > Define Internal Traffic). This also prevents events from being displayed in the DebugView.
- Developer traffic. This will be excluded from regular reports if debug more parameter is included in the request (but will display it in the DebugView)
If you go to Admin > Data Settings > Filters, check which filters are active.

If you only have an internal traffic filter active, that might cause the DebugView problem. This often happens even if the Developer filter is active, too.
It might take some time until you start seeing data in the debug view after you configure those filters. In the worst-case scenario, if you still cannot see your data after several hours, something else is wrong.
It’s a shame that the active Developer Filter does not have a higher priority than the Internal Traffic filter.
What can you do about this? One option could be to temporarily use a VPN service (e.g., NordVPN, etc.) to change your IP address. Then, you will start seeing yourself in the DebugView.
Another option would be to temporarily disable the Internal traffic filter while you are debugging (then wait several minutes until it goes live). But in this case, events coming from other employees within your organization will also pollute the data for a while.
#3. Google Analytics is blocked by some browser extension
Your browser might have an extension installed that blocks Google Analytics 4 tracking. Even though you see the tags firing in GTM preview mode, that does not mean that the data was properly sent to GA.
For example, there is an extension called Google Analytics opt-out. It will prevent data from your browser from being sent to Google Analytics. Thus, you won’t see your device in the DebugView.
There might be other extensions, too (e.g., some adblockers).
So, try to temporarily disable all browser extensions and see if you start seeing your device in the DebugView. If it starts working, try enabling extensions one by one and see which one breaks the debugging once again.
When you identify that extension, please let me know in the comments. I will mention it in this chapter. Thanks!
#4. Google Analytics is blocked developer tools
It’s possible that while you were testing, you wanted to temporarily block the requests going to Google Analytics (but later forgot to unblock them).
If you open developer tools, check the requests that contain the word collect. If you have blocked requests to google-analytics.com (or some similar domain), an error message will look like this:

To unblock the request, right-click the request and then click “Unblock [domain]”.
#5. Google Tag Manager may be blocked by a browser extension
If Google Analytics 4 is installed via Google Tag Manager, then it’s possible that Google Tag Manager is blocked by some browser extension (e.g., uBlock origin, Ghostery, etc.).
You can open developer tools and look for the gtm.js request (if you are not some a very customized server-side tagging setup).
If the gtm.js request is blocked or redirected somewhere else, it’s probably because of some extension in your browser. You will have to disable them one by one to find out.

#6. Using Brave browser?
Also, if you are using a stricter browser (like Brave) for debugging, GA will be blocked by default. Thus you won’t see your events in the DebugView. In general, Brave is not convenient for debugging (because it also prevents GTM preview mode from working by default).
Solution? Use a different browser, like Chrome or Firefox, for testing your GA setup.
#7. Weird delays (sometimes)
I haven’t faced this myself for quite some time, but it was an issue in the past. Anyway, maybe you are facing this now. When I created a new GA4 property and then started immediately debugging it (via DebugView), my events were not displayed for several hours in the DebugView (or sometimes there was a weird delay where events appeared after 10 or more minutes).
There was no solution for that. Just waiting. So if you are dealing with a similar situation, waiting for several hours and then trying to debug again might be an option.
I know this is frustrating (especially when you have a lot of tasks to do now with GA4 implementation). But sometimes, waiting for a while helped.
#8. Bugs
Even years after GA4 was introduced, DebugView might still have bugs. Here’s one example. I go to the DebugView and see that there are zero devices here (even though I know I did everything correctly):
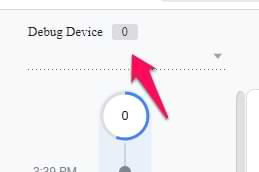
Once (out of curiosity), I clicked on this drop-down anyway. And boom, apparently, there are two devices. It was just a bug in the interface.

But sometimes bugs are more serious, and the DebugView just does not work. In that case, unfortunately, I don’t have a solution.
P.S. I noticed that often, the debug view magically starts working the next day.

#9. Using server-side tagging?
If you have implemented server-side tagging and GA4 is installed with it, then there is something you need to know.
If you usually enable the Debugview with the GA debugger extension, it supports only those GA4 requests sent directly to Google. In the case of server-side tagging, the requests are first sent to your own custom endpoint. Custom endpoint (hostname) means that the GA debugger cannot easily understand that this request is still a GA request.
As a result, GA4 requests are not decorated with an additional parameter that enables the Debugview. Thus the Debugview will not be enabled by the GA debugger extension if you are using server-side tagging.
Instead, you could send the debug_mode parameter with all your requests or use Google Tag Manager’s preview mode to automatically activate the GA4 Debugview. You can learn more about this here. But do this only while you’re debugging.
Also, I sometimes notice that even without the GA debugger extension (just the GTM preview mode), the debugview will not work (if you’re using server-side tagging). In that case, a solution (again) would be to temporarily set the debug_mode parameter in your GA4 tags (either in web GTM or server GTM).
#10. Content security policy is blocking GA
If your website has a Content Security Policy, it might block Google Analytics requests. You can identify this by going to your browser’s developer console (On Windows, Chrome, you should go to Browser’s Menu > More Tools > Developer Tools > Console.
Then, refresh the page. If you can find an error that looks like this (or something similar), this means that you are dealing with the Content Security Policy.

But in this case, the URL of the error should contain google-analytics.com.
What does that mean? Your developers will have to update the CSP of the website. There are no workarounds, you won’t avoid developers here. Here are the instructions on what they should do.
In 2022, Google changed the URL of where GA sends the data. Previously it was just www.google-analytics.com, now it might be region1.google-analytics.com (or something similar). So it would be most convenient if developers updated the CSP to support all domains containing google-analytics.com.
This means that CSP should add *.google-analytics.com and *.analytics.google.com to their “connect-src” and “img-src” instructions in their content security policy (*. at the start is important).
#11. Consent
This one is full of nuances, and, unfortunately, I will not be able to give you specific instructions (because the setup on every website can be different).
In a nutshell, the problem goes like this: check if you have a cookie consent popup on your website. What happens after you reject cookies in that popup? Normally, Google Analytics 4 tracking code should not be activated, which means that Debugview will also not work.
Another situation might be that maybe you have implemented Google Consent Mode. If the visitor does not give consent for tracking, your GA4 tracking codes are still activated. However, then the data sent to Google Analytics 4 is limited, and you won’t see such events in the DebugView (it’s impossible to see them).
One more idea that comes to my mind is that maybe your cookie consent popup uses an auto-blocking feature that automatically blocks all tracking codes on the site and does not let them work properly.
How to troubleshoot this? It’s complicated. And as I have said, things can differ on various websites. To learn more about cookie consent popups and Google Consent Mode, take a look at my Google Tag Manager course for beginners.
#12. Log out of WordPress Admin Panel
Several readers have reported that if they are debugging a WordPress website while logged into the WP admin panel, DebugView sometimes fails to show their data. Logging out of the admin panel resolved the issue for them.
While the exact cause might vary, if you’re debugging WordPress and facing DebugView issues, logging out of the WP admin is a quick and easy troubleshooting step to try.
#13. Check if you have selected a correct device
If more people have enabled the debug_mode, their devices will be visible in the GA4 debugview. It’s possible that you are looking at the wrong device’s data.
You can switch between devices at the top-left corner of the debugview.
Even if you see a zero next to “Debug Device”, you should still click on the device drop-down and see if there are any devices. If yes, then switch to another one and see if the incoming events resemble your test behavior.
#14. Automatic migration from Universal Analytics
This tip was shared by our reader, Angela.
Her GA4 property was automatically created from the old GA3 (Universal Analytics) property. GA was installed using the Universal Analytics tracking code, which was then automatically reused by the new GA4 property. With this setup, real-time reports and debug view did not work for her.
Then she talked with developers, removed the legacy Google Analytics tracking codes from the website’s code, and installed GA4 via GTM instead. After this was done, her debugview started to work.
#15. Try completely restarting the browser
Just closing the browser window is not enough. What I mean is to completely shut down and then start the browser again. For example, you can completely close Chrome by clicking three dots in the top-right corner and then clicking “Exit”.
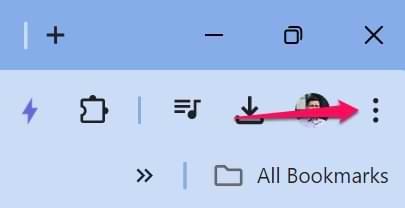
After that, launch the browser again and see if that helps.
#16. Clearing browser cache and cookies might help
If none of the aforementioned tips helped, then you can try clearing your browser and trying to debug again. Instructions to clear the browser (cache and cookies) differ on each browser; thus, you will need to google that. For example, use “How to clear browser cache and cookies on [insert your browser name]”.
#17. Wrong GA4 property
I know that this might sound silly (and you probably have already checked), but I would recommend double-checking if you are really looking at the correct GA4 property. First, check your tracking code (or Google Tag Manager) to see the Measurement ID to which you are sending data.
Then go to Google Analytics > Admin > Data Streams > Select your website data stream and then see if it’s the same ID. If not, that is the reason why Debugview is not working for you.
#18. ga-disable-XXXXXX
This reason happens rarely, but it’s still completely possible.
Check the source code of your website. For example, you can do that with a right-click on your page’s background > View page source. Search for “ga-disable”.

gtag.js library (used by Google Analytics) supports a feature that allows disabling Google Analytics on a page programmatically. This code is usually placed high in the source code, above gtag.js or the Google Tag Manager container snippet.
That feature looks like this:
window['ga-disable-GA_MEASUREMENT_ID'] = true;
GA_MEASURMENT_ID should be replaced with the ID that is used on your website, e.g., G-123456789, for example:
<script>
window['ga-disable-G-123456789'] = true;
</script>
<!-- Google tag (gtag.js) -->
<script async src="https://www.googletagmanager.com/gtag/js?id=G-123456"></script>
<script>
window.dataLayer = window.dataLayer || [];
function gtag(){dataLayer.push(arguments);}
gtag('js', new Date());
gtag('config', 'G-123456789');
</script>
If you found window[‘ga-disable-GA_MEASUREMENT_ID’] = true in your source code, that’s the reason why debugview is not working. In fact, your Google Analytics shouldn’t work at all because this feature disables GA completely. What to do? Remove that line of code or ask the developer to do it.
DebugView in Google Analytics 4 not working: Final words
GA4’s DebugView is a handy tool, but it can be frustrating when it doesn’t show your data. By systematically checking the common causes outlined in this guide, you can usually pinpoint the issue. Here are the key takeaways to remember:
- Enable debug signal: DebugView requires an active signal (GA Debugger Extension, GTM Preview, or debug_mode parameter).
- Check GA4 filters: The Internal Traffic filter (when Active) is a primary suspect for blocking DebugView. Set it to “Testing” temporarily.
- Rule out browser issues: Disable extensions, check DevTools for blocks, and avoid privacy-focused browsers like Brave during testing.
- Verify installation & config: Ensure GA4/GTM is installed, Measurement ID is correct, GTM container is published, and you’re viewing the right property/device.
- Consider consent: Denied consent or advanced Consent Mode configurations will prevent data from appearing in DebugView.
- Be aware of delays/bugs: Sometimes, waiting or restarting the browser is necessary due to GA4 processing delays or interface bugs.
If you know/identify more problems and possible solutions to fix the DebugView if it is not working, let me know in the comments. Many GA4 users will be thankful.