Overview
This year, over 64,000 developers told us how they learn and level up, which tools they’re using, and what they want.
Each year since 2011, Stack Overflow has asked developers about their favorite technologies, coding habits, and work preferences, as well as how they learn, share, and level up. This year represents the largest group of respondents in our history: 64,000 developers took our annual survey in January.
As the world’s largest and most trusted community of software developers, we run this survey and share these results to improve developers’ lives: We want to empower developers by providing them with rich information about themselves, their industry, and their peers. And we want to use this information to educate employers about who developers are and what they need.
We learn something new every time we run our survey. This year is no exception:
- A common misconception about developers is that they've all been programming since childhood. In fact, we see a wide range of experience levels. Among professional developers, 11.3% got their first coding jobs within a year of first learning how to program. A further 36.9% learned to program between one and four years before beginning their careers as developers.
- Only 13.1% of developers are actively looking for a job. But 75.2% of developers are interested in hearing about new job opportunities.
- When we asked respondents what they valued most when considering a new job, 53.3% said remote options were a top priority. A majority of developers, 63.9%, reported working remotely at least one day a month, and 11.1% say they’re full-time remote or almost all the time.
- A majority of developers said they were underpaid. Developers who work in government and non-profits feel the most underpaid, while those who work in finance feel the most overpaid.
Want to dive into the results yourself? In a few weeks, we’ll make the anonymised results of the survey available for download under the Open Database License (ODbL). We look forward to seeing what you find!
Developer Profile
Who codes? More people in more places than ever before.
Geography
Each month, about 40 million people visit Stack Overflow to learn, share, and level up. We estimate that 16.8 million of these people are professional developers and university-level students.
Our estimate on professional developers comes from the things people read and do when they visit Stack Overflow. We collect data on user activity to help surface jobs we think you might find interesting and questions we think you can answer. You can download and clear this data at any time.
Developer Roles
Developer Type
Web developer
- 72.6%
Desktop applications developer
- 28.9%
Mobile developer
- 23.0%
Database administrator
- 14.4%
Developer with a statistics or mathematics background
- 11.3%
Systems administrator
- 11.3%
DevOps specialist
- 11.1%
Embedded applications/devices developer
- 9.3%
Data scientist
- 8.4%
Other
- 7.5%
Graphics programming
- 4.8%
Graphic designer
- 3.9%
Machine learning specialist
- 3.8%
Quality assurance engineer
- 3.5%
36,125 responses; select all that apply
About three-quarters of respondents identify as web developers, although many also said they are working to build desktop apps and mobile apps.
Specific Developer Types
Full stack Web developer
- 63.7%
Back-end Web developer
- 24.4%
Front-end Web developer
- 11.9%
10,696 responses; select all that apply
Android
- 64.8%
iOS
- 57.6%
Windows Phone
- 4.3%
Blackberry
- 0.7%
1,558 responses; select all that apply
Analyst or consultant
- 38.8%
Other
- 31.9%
Data scientist
- 22.5%
Educator or academic
- 15.0%
Designer or illustrator
- 12.3%
Product manager
- 7.5%
C-suite executive
- 5.3%
Marketing or sales manager
- 3.1%
Elected official
- 0.7%
4,890 responses; select all that apply
Compared to the rest of the world, the United States has a higher proportion of people who identify as full stack web developers, whereas Germany has a comparatively lower proportion. As for mobile developers, the U.S. and United Kingdom have proportionally more iOS developers and fewer Android developers than the rest of the world.
People other than full-time developers also write code as part of their jobs, and they come to Stack Overflow for help and community. This year, we gave additional occupation options to respondents who are not full-time developers, but who occasionally code as part of their work. These roles include analyst, data scientist, and educator.
Experience
Years Since Learning to Code
Less than a year
- 2.9%
1 to 2 years
- 5.4%
2 to 3 years
- 6.4%
3 to 4 years
- 7.2%
4 to 5 years
- 7.6%
5 to 6 years
- 7.0%
6 to 7 years
- 5.6%
7 to 8 years
- 4.8%
8 to 9 years
- 3.7%
9 to 10 years
- 6.3%
10 to 11 years
- 4.3%
11 to 12 years
- 2.7%
12 to 13 years
- 2.6%
13 to 14 years
- 2.1%
14 to 15 years
- 3.9%
15 to 16 years
- 3.3%
16 to 17 years
- 2.0%
17 to 18 years
- 1.7%
18 to 19 years
- 1.3%
19 to 20 years
- 2.0%
20 or more years
- 17.2%
51,145 responses
Less than a year
- 1.1%
1 to 2 years
- 2.5%
2 to 3 years
- 3.7%
3 to 4 years
- 5.2%
4 to 5 years
- 6.5%
5 to 6 years
- 6.8%
6 to 7 years
- 5.8%
7 to 8 years
- 5.2%
8 to 9 years
- 4.1%
9 to 10 years
- 7.1%
10 to 11 years
- 5.0%
11 to 12 years
- 3.3%
12 to 13 years
- 3.2%
13 to 14 years
- 2.6%
14 to 15 years
- 4.8%
15 to 16 years
- 4.0%
16 to 17 years
- 2.5%
17 to 18 years
- 2.2%
18 to 19 years
- 1.5%
19 to 20 years
- 2.4%
20 or more years
- 20.3%
35,983 responses
A common misconception about developers is that they've all been programming since childhood. In fact, we see a wide range of experience levels. Among professional developers, one-eighth (12.5%) learned to code less than four years ago, and an additional one-eighth (13.3%) learned to code between four and six years ago. Due to the pervasiveness of online courses and coding bootcamps, adults with little to no programming experience can now more easily transition to a career as a developer.
Years Coding Professionally
Less than a year
- 7.4%
1 to 2 years
- 12.9%
2 to 3 years
- 11.7%
3 to 4 years
- 9.8%
4 to 5 years
- 8.3%
5 to 6 years
- 7.3%
6 to 7 years
- 4.7%
7 to 8 years
- 4.0%
8 to 9 years
- 3.1%
9 to 10 years
- 4.8%
10 to 11 years
- 4.1%
11 to 12 years
- 2.0%
12 to 13 years
- 1.8%
13 to 14 years
- 1.3%
14 to 15 years
- 2.1%
15 to 16 years
- 2.1%
16 to 17 years
- 1.7%
17 to 18 years
- 1.3%
18 to 19 years
- 1.0%
19 to 20 years
- 1.0%
20 or more years
- 7.5%
40,890 responses
Web and mobile developers have significantly less professional coding experience, on average, than developers in other technical disciplines such as systems administration and embedded programming. Across all developer kinds, the software industry acts as the primary incubator for new talent, but sees a relatively low proportion of more experienced developers. For example, 60% of mobile developers at software firms have fewer than five years of professional coding experience, compared to 45% of mobile developers in other industries.
Among professional developers, 11.3% got their first coding jobs within a year of first learning how to program. A further 36.9% learned to program between one and four years before beginning their careers as developers. Globally, developers in Southern Asia had the lowest average amount of prior coding experience when beginning their careers; those in continental Europe had the highest.
Years Coded Professionally in the Past
Less than a year
- 5.9%
1 to 2 years
- 8.2%
2 to 3 years
- 8.0%
3 to 4 years
- 6.7%
4 to 5 years
- 6.8%
5 to 6 years
- 4.9%
6 to 7 years
- 3.1%
7 to 8 years
- 4.7%
8 to 9 years
- 2.9%
9 to 10 years
- 6.1%
10 to 11 years
- 5.1%
11 to 12 years
- 2.9%
12 to 13 years
- 2.1%
13 to 14 years
- 1.7%
14 to 15 years
- 4.0%
15 to 16 years
- 4.3%
16 to 17 years
- 2.0%
17 to 18 years
- 2.0%
18 to 19 years
- 0.6%
19 to 20 years
- 2.4%
20 or more years
- 15.8%
974 responses; among respondents who indicated they no longer program as part of their job
Respondents who indicated that they had worked as professional developers in the past, but now did something else for a living, were asked how long they had coded as part of their jobs.
Demographics
Gender
Male
- 88.6%
Female
- 7.6%
Other
- 1.2%
Gender non-conforming
- 0.9%
Transgender
- 0.5%
35,990 responses
Male
- 89.5%
Female
- 7.2%
Other
- 1.0%
Gender non-conforming
- 0.7%
Transgender
- 0.4%
26,762 responses
Male
- 86.2%
Female
- 8.3%
Other
- 2.0%
Gender non-conforming
- 1.6%
Transgender
- 0.8%
4,545 responses
We asked respondents for their gender identity. Specifically, we asked them to select each of the following options that apply to them:
- Male
- Female
- Transgender
- Non-binary, genderqueer, or gender non-conforming
- A different identity (write-in option)
According to Quantcast, women account for 10% of Stack Overflow’s U.S. traffic. Similarly, 10% of survey respondents from the U.S. identify as women. In our survey last year, 6.6% of respondents from the U.S. identified as women.
Meanwhile, women account for 9% of Stack Overflow’s UK traffic, while 7.3% of survey respondents from the UK were women. Finally, women account for 8% of Stack Overflow’s traffic from both France and Germany, while 5.1% and 5.6% of respondents from those countries, respectively, identify as women.
We will publish additional analysis related to respondents’ gender identities in the coming weeks.
Ethnicity
White or of European descent
- 74.4%
South Asian
- 8.8%
Hispanic or Latino/Latina
- 5.6%
East Asian
- 4.9%
Middle Eastern
- 3.6%
I prefer not to say
- 2.6%
Black or of African descent
- 2.5%
I don’t know
- 2.0%
Native American, Pacific Islander, or Indigenous Australian
- 0.9%
33,033 responses; select all that apply
White or of European descent
- 76.2%
South Asian
- 8.2%
Hispanic or Latino/Latina
- 5.7%
East Asian
- 4.3%
Middle Eastern
- 3.4%
I prefer not to say
- 2.3%
Black or of African descent
- 2.3%
I don’t know
- 1.7%
Native American, Pacific Islander, or Indigenous Australian
- 0.9%
24,652 responses; select all that apply
White or of European descent
- 64.4%
South Asian
- 13.3%
East Asian
- 7.7%
Hispanic or Latino/Latina
- 5.3%
Middle Eastern
- 4.7%
I don’t know
- 3.8%
Black or of African descent
- 3.7%
I prefer not to say
- 3.2%
Native American, Pacific Islander, or Indigenous Australian
- 0.8%
4,097 responses; select all that apply
This was the first year we asked respondents for their ethnic identity. We asked them to select each option that applied.
We asked respondents this question to add an important dimension to what we can learn about developers. In addition, public policy researchers and employers frequently look to us for information on how they can reach out to and better understand underrepresented groups among developers.
We will publish additional analysis related to respondents’ ethnic identities in the coming weeks.
Disability Status
None or prefer not to say
- 96.3%
Other
- 1.8%
Blind
- 1.0%
Deaf
- 0.5%
Unable to walk
- 0.2%
Unable to type
- 0.1%
1,755 responses identified as having a disability
Similar to our question about ethnicity, this was the first year we asked respondents for their disability status. Of the 3.4% of respondents who identified as having a disability, we asked them to select each option that applied, and we included a write-in option. We know developers can experience many forms of disability. For this survey, we confined our list of standard options on this question to disabilities that require some physical accommodation by employers.
We will publish additional analysis related to respondents’ disability status in the coming weeks.
Parents' Education Level
A bachelor’s degree
- 29.1%
A master’s degree
- 21.6%
High school
- 16.8%
Some college/university study, no bachelor's degree
- 13.7%
A doctoral degree
- 5.9%
A professional degree
- 4.4%
Primary/elementary school
- 3.9%
I don't know/not sure
- 2.1%
I prefer not to answer
- 1.8%
No education
- 0.6%
34,938 responses
A bachelor’s degree
- 30.2%
A master’s degree
- 22.0%
High school
- 17.2%
Some college/university study, no bachelor's degree
- 13.6%
A doctoral degree
- 5.4%
A professional degree
- 4.3%
Primary/elementary school
- 3.9%
I don't know/not sure
- 1.6%
I prefer not to answer
- 1.4%
No education
- 0.5%
26,066 responses
A bachelor’s degree
- 26.0%
A master’s degree
- 20.5%
High school
- 16.6%
Some college/university study, no bachelor's degree
- 13.3%
A doctoral degree
- 6.5%
A professional degree
- 4.5%
I don't know/not sure
- 4.3%
Primary/elementary school
- 4.3%
I prefer not to answer
- 3.3%
No education
- 0.7%
4,338 responses
We asked respondents, “What is the highest level of education received by either of your parents?” Similar to ethnicity and disability status, this is the first year we asked this question. We asked this question in part because public policy researchers and some employers seek information about first-generation college students to improve their efforts to support them.
We will publish additional analysis on this in the coming weeks.
Developer Role and Gender
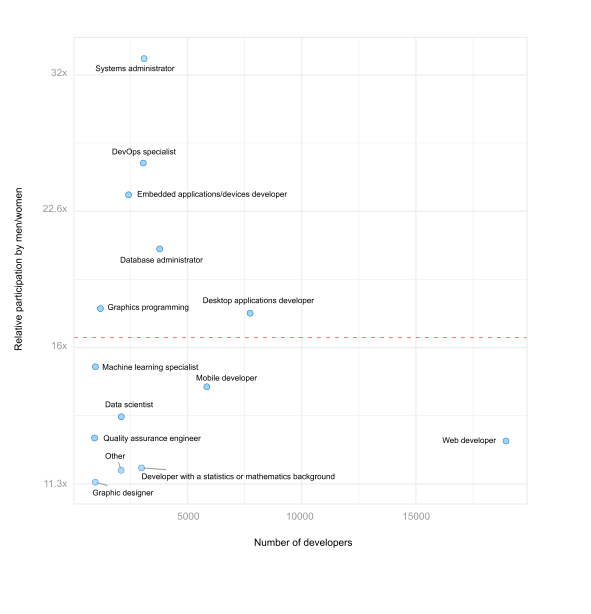 The dashed line shows the average ratio of men's to women's participation
While the sample as a whole skewed heavily male, women were more likely to be represented in some developer roles than others. They were proportionally more represented among data scientists, mobile and web developers, quality assurance engineers, and graphic designers. The dashed line shows the average ratio for all of these developer roles.
Developer Role and Ethnicity
Web developer
- 72.4%
Desktop applications developer
- 30.8%
Mobile developer
- 20.1%
Database administrator
- 14.5%
DevOps specialist
- 12.4%
Systems administrator
- 12.4%
Developer with a statistics or mathematics background
- 11.5%
Embedded applications/devices developer
- 9.7%
Other
- 8.7%
Data scientist
- 7.8%
Graphics programming
- 4.9%
Quality assurance engineer
- 3.5%
Machine learning specialist
- 3.5%
Graphic designer
- 3.3%
18,770 responses
Web developer
- 73.6%
Mobile developer
- 27.8%
Desktop applications developer
- 22.4%
Developer with a statistics or mathematics background
- 11.7%
Database administrator
- 11.3%
DevOps specialist
- 8.5%
Data scientist
- 7.4%
Embedded applications/devices developer
- 7.2%
Systems administrator
- 7.0%
Other
- 6.6%
Graphic designer
- 3.8%
Machine learning specialist
- 3.8%
Quality assurance engineer
- 3.1%
Graphics programming
- 2.8%
2,009 responses
Web developer
- 80.9%
Desktop applications developer
- 29.0%
Mobile developer
- 27.8%
Database administrator
- 17.0%
Systems administrator
- 14.8%
DevOps specialist
- 11.5%
Developer with a statistics or mathematics background
- 10.2%
Data scientist
- 9.6%
Embedded applications/devices developer
- 8.2%
Other
- 6.2%
Graphics programming
- 4.7%
Machine learning specialist
- 4.4%
Graphic designer
- 4.2%
Quality assurance engineer
- 4.0%
1,412 responses
Web developer
- 74.2%
Mobile developer
- 27.7%
Desktop applications developer
- 25.0%
Database administrator
- 12.9%
Developer with a statistics or mathematics background
- 11.4%
DevOps specialist
- 10.9%
Systems administrator
- 10.4%
Data scientist
- 8.8%
Embedded applications/devices developer
- 7.7%
Other
- 5.4%
Machine learning specialist
- 4.8%
Graphics programming
- 4.5%
Graphic designer
- 3.9%
Quality assurance engineer
- 3.8%
1,063 responses
Respondents who identified as White or of European descent were less likely to report being a mobile developer than those who identified as South Asian, Hispanic or Latino/Latina, or East Asian. A higher proportion of respondents who identified as Hispanic or Latino/Latina selected “web developer” as an option compared to those who selected White or of European descent, South Asian, or East Asian.
Important note: We didn't receive enough responses from developers of some ethnicities to include them here with reliable percentages. However, we do see that many developers who identify as Black or of African descent work as web developers and mobile developers, and many developers with Middle Eastern ethnic backgrounds work as web developers and desktop applications developers. Developers who identified as Native American, Pacific Islander, or Indigenous Australian work as web developers at a high rate.
Years of Coding Experience and Demographics
Less than a year
- 10.7%
- 6.0%
1 to 2 years
- 16.6%
- 11.3%
2 to 3 years
- 14.0%
- 10.8%
3 to 4 years
- 9.7%
- 9.5%
4 to 5 years
- 8.6%
- 8.1%
5 to 6 years
- 6.6%
- 7.5%
6 to 7 years
- 4.7%
- 4.8%
7 to 8 years
- 3.6%
- 4.4%
8 to 9 years
- 2.2%
- 3.4%
9 to 10 years
- 3.7%
- 5.0%
10 to 11 years
- 3.9%
- 4.3%
11 to 12 years
- 1.6%
- 2.3%
12 to 13 years
- 1.4%
- 2.0%
13 to 14 years
- 0.6%
- 1.5%
14 to 15 years
- 1.2%
- 2.2%
15 to 16 years
- 1.5%
- 2.4%
16 to 17 years
- 1.2%
- 2.0%
17 to 18 years
- 1.2%
- 1.6%
18 to 19 years
- 1.1%
- 1.1%
19 to 20 years
- 0.6%
- 1.2%
20 or more years
- 5.4%
- 8.7%
Female
Male
29,255 responses
White or of European descent
- 12.5
Native American, Pacific Islander, or Indigenous Australian
- 12.1
I prefer not to say
- 11.5
Hispanic or Latino/Latina
- 10.6
Middle Eastern
- 9.6
East Asian
- 9.2
Black or of African descent
- 8.8
I don’t know
- 8.3
South Asian
- 8.0
Mean of 33,004 responses
Between respondents who identified as men or women, nearly twice the number of women said they had been coding for less than a year. On average, respondents who identified as White or of European descent and those who identified as Pacific Islander or Indigenous Australian had the highest average number of years experience coding.
Education
Educational Attainment
I never completed any formal education
- 0.8%
Primary/elementary school
- 2.0%
Secondary school
- 11.5%
Some college/university study without earning a bachelor’s degree
- 15.8%
Bachelor’s degree
- 42.0%
Master’s degree
- 21.7%
Professional degree
- 1.4%
Doctoral degree
- 2.5%
I prefer not to answer
- 2.2%
51,392 responses
I never completed any formal education
- 0.7%
Primary/elementary school
- 0.6%
Secondary school
- 6.3%
Some college/university study without earning a bachelor’s degree
- 14.9%
Bachelor’s degree
- 47.9%
Master’s degree
- 24.9%
Professional degree
- 1.5%
Doctoral degree
- 2.2%
I prefer not to answer
- 1.1%
36,131 responses
Among current professional developers globally, 76.5% of respondents said they had a bachelor’s degree or higher, such as a Master’s degree or equivalent.
Undergraduate Major
Computer science or software engineering
- 50.0%
Computer engineering or electrical/electronics engineering
- 10.2%
Computer programming or Web development
- 9.1%
Information technology, networking, or system administration
- 5.0%
A natural science
- 4.4%
A non-computer-focused engineering discipline
- 4.2%
Mathematics or statistics
- 3.8%
Something else
- 2.5%
A humanities discipline
- 2.1%
A business discipline
- 2.1%
Management information systems
- 1.5%
Fine arts or performing arts
- 1.5%
A social science
- 1.5%
I never declared a major
- 1.4%
Psychology
- 0.5%
A health science
- 0.3%
42,841 responses; select all that apply
Computer science or software engineering
- 54.2%
Computer engineering or electrical/electronics engineering
- 10.0%
Computer programming or Web development
- 9.1%
Information technology, networking, or system administration
- 4.3%
A non-computer-focused engineering discipline
- 3.6%
A natural science
- 3.5%
Mathematics or statistics
- 3.4%
Something else
- 2.1%
A humanities discipline
- 1.9%
A business discipline
- 1.7%
Fine arts or performing arts
- 1.5%
Management information systems
- 1.4%
I never declared a major
- 1.3%
A social science
- 1.3%
Psychology
- 0.4%
A health science
- 0.2%
32,958 responses; select all that apply
Computer science or software engineering
- 48.3%
Computer programming or Web development
- 12.5%
Computer engineering or electrical/electronics engineering
- 10.2%
Information technology, networking, or system administration
- 6.8%
Something else
- 3.3%
A natural science
- 3.2%
A non-computer-focused engineering discipline
- 3.1%
Mathematics or statistics
- 2.8%
A business discipline
- 2.4%
A humanities discipline
- 1.6%
I never declared a major
- 1.6%
Fine arts or performing arts
- 1.2%
A social science
- 1.0%
Management information systems
- 1.0%
A health science
- 0.5%
Psychology
- 0.4%
3,945 responses; select all that apply
More than half (54.2%) of professional developers who had studied at a college or university said they had concentrated their studies on computer science or software engineering, and an additional quarter (24.9%) majored in a closely-related discipline such as computer programming, computer engineering, or information technology. The remaining 20.9% said they had majored in other fields such as business, the social sciences, natural sciences, non-computer engineering, or the arts.
Among current students who responded to the survey, 48.3% said they were majoring in computer science or software engineering, and 30.5% said they were majoring in closely-related fields. Finally, 21.2% said they were focusing on other fields.
Importance of Formal Education
Very important
- 15.9%
Important
- 25.1%
Somewhat important
- 26.9%
Not very important
- 20.5%
Not at all important
- 11.5%
23,355 responses
Of current professional developers, 32% said their formal education was not very important or not important at all to their career success. This is not entirely surprising given that 90% of developers overall consider themselves at least somewhat self-taught: a formal degree is only one aspect of their education, and so much of their practical day-to-day work depends on their company’s individual tech stack decisions.
However, computer science majors and computer engineering majors were the most likely (49.4%) to say their formal education was important or very important.
Compared to computer science majors, respondents who majored in less theoretical computer-related disciplines (such as IT, web development, or computer programming) were more likely to say their formal educations were unimportant.
Other Types of Education
Self-taught
- 90.0%
Online course
- 45.4%
On-the-job training
- 41.2%
Open source contributions
- 37.0%
Hackathon
- 23.6%
Coding competition
- 22.0%
Part-time/evening course
- 15.3%
Industry certification
- 14.7%
Bootcamp
- 9.0%
30,354 responses; select all that apply
Self-taught
- 91.1%
On-the-job training
- 46.6%
Online course
- 44.1%
Open source contributions
- 38.9%
Hackathon
- 25.4%
Coding competition
- 21.8%
Industry certification
- 16.4%
Part-time/evening course
- 15.0%
Bootcamp
- 9.4%
22,407 responses; select all that apply
Developers love to learn: 90% say they are at least partially self-taught. Among current professional developers, 55.9% say they’ve taken an online course, and 53.4% say they’ve received on-the-job training.
Ways Developers Teach Themselves
Official documentation
- 80.2%
Stack Overflow Q&A
- 80.1%
Trade book
- 53.8%
Non-Stack online communities
- 50.7%
Built-in help
- 47.1%
Stack Overflow Docs
- 27.5%
Textbook
- 20.8%
Friends network
- 20.7%
Company internal community
- 18.5%
Other
- 11.7%
Tutoring/mentoring
- 4.4%
26,735 responses; select all that apply
Official documentation
- 82.2%
Stack Overflow Q&A
- 80.0%
Trade book
- 56.3%
Non-Stack online communities
- 50.5%
Built-in help
- 47.6%
Stack Overflow Docs
- 26.0%
Friends network
- 20.3%
Textbook
- 19.6%
Company internal community
- 18.3%
Other
- 10.7%
Tutoring/mentoring
- 4.3%
20,018 responses; select all that apply
By far, reading official documentation and using Stack Overflow Q&A are the two most common ways developers level up their skills.
Bootcamp Success
I already had a job as a developer when I started the program
- 45.8%
I got a job as a developer before completing the program
- 9.7%
Immediately upon graduating
- 11.3%
Less than a month
- 6.0%
One to three months
- 8.8%
Four to six months
- 4.0%
Six months to a year
- 3.0%
Longer than a year
- 3.3%
I haven't gotten a job as a developer yet
- 8.1%
2,602 responses
Due to the high demand for professional developers, coding bootcamps have exploded in popularity in the past few years. Although commonly perceived as a way for non-developers to transition into a new career, we found that 45.8% of those who said they’d gone through a bootcamp were already developers when they started the program. This is likely because many developers decide at various parts in their career that they need to upgrade their skills or learn new technologies to stay relevant in the job market.
Program as a Hobby
Yes, I program as a hobby
- 48.3%
Yes, I contribute to open source projects
- 5.9%
Yes, both
- 26.8%
No
- 19.0%
51,392 responses
Yes, I program as a hobby
- 45.2%
Yes, I contribute to open source projects
- 6.2%
Yes, both
- 27.7%
No
- 20.8%
36,131 responses
Coding isn’t just a career; it can be a passion. Among all developers, 75.0% code as a hobby; even among professional developers a similar proportion (73.9%) do so. Additionally, 32.7% of developers said they contribute to open source projects.
What Kind of Learning Do Developers Recommend?
Take online courses
- 64.7%
Buy books and work through the exercises
- 49.9%
Part-time/evening courses
- 31.9%
Contribute to open source
- 31.5%
Bootcamp
- 22.4%
Conferences/meet-ups
- 22.3%
Return to college
- 21.3%
Participate in online coding competitions
- 15.3%
Get a job as a QA tester
- 14.3%
Participate in hackathons
- 11.7%
Master's degree
- 11.2%
Other
- 10.0%
None of these
- 2.6%
23,568 responses; select all that apply
Take online courses
- 64.5%
Buy books and work through the exercises
- 50.2%
Part-time/evening courses
- 32.1%
Contribute to open source
- 31.7%
Conferences/meet-ups
- 23.4%
Bootcamp
- 22.8%
Return to college
- 21.0%
Get a job as a QA tester
- 15.8%
Participate in online coding competitions
- 14.0%
Participate in hackathons
- 11.1%
Master's degree
- 10.8%
Other
- 10.4%
None of these
- 2.3%
17,025 responses; select all that apply
Want to learn to code but don’t know where to start? More developers say you should take an online course than any other method, followed by getting a book and working through the exercises.
As an important side note, we received great feedback on how we phrased this question, specifically the option, “Get a job as a QA tester and work your way into a developer role.” Although some developers start their careers as QA testers, the phrasing made it sound as if we saw QA as just a stepping stone, rather than a vital function and career option. QA professionals are our heroes (and QA engineers are 3.5% of our respondents this year!), and we apologize for not more carefully crafting our language.
Technology
The tools and trends of the trade.
Most Popular Technologies
Programming Languages
JavaScript
- 62.5%
SQL
- 51.2%
Java
- 39.7%
C#
- 34.1%
Python
- 32.0%
PHP
- 28.1%
C++
- 22.3%
C
- 19.0%
TypeScript
- 9.5%
Ruby
- 9.1%
Swift
- 6.5%
Objective-C
- 6.4%
VB.NET
- 6.2%
Assembly
- 5.0%
R
- 4.5%
Perl
- 4.3%
VBA
- 4.3%
Matlab
- 4.3%
Go
- 4.3%
Scala
- 3.6%
Groovy
- 3.3%
CoffeeScript
- 3.3%
Visual Basic 6
- 2.9%
Lua
- 2.8%
Haskell
- 1.8%
36,625 responses; select all that apply
JavaScript
- 61.9%
SQL
- 50.8%
Java
- 39.3%
C#
- 33.8%
Python
- 31.7%
PHP
- 27.9%
C++
- 22.1%
C
- 18.9%
TypeScript
- 9.4%
Ruby
- 9.0%
Swift
- 6.4%
Objective-C
- 6.4%
VB.NET
- 6.2%
Assembly
- 4.9%
R
- 4.4%
Perl
- 4.3%
VBA
- 4.3%
Matlab
- 4.2%
Go
- 4.2%
Scala
- 3.5%
Groovy
- 3.2%
CoffeeScript
- 3.2%
Visual Basic 6
- 2.9%
Lua
- 2.8%
Haskell
- 1.8%
36,935 responses; select all that apply. Shown as a percentage of the respondents who chose at least one language, framework, database, or platform.
JavaScript
- 66.7%
SQL
- 53.7%
Java
- 38.3%
C#
- 36.7%
Python
- 27.6%
PHP
- 27.2%
C++
- 19.3%
C
- 15.4%
TypeScript
- 11.3%
Ruby
- 9.5%
Objective-C
- 7.3%
Swift
- 6.9%
VB.NET
- 6.1%
Go
- 4.6%
Perl
- 4.1%
Scala
- 4.0%
Groovy
- 3.8%
Assembly
- 3.7%
CoffeeScript
- 3.7%
VBA
- 3.5%
R
- 3.1%
Matlab
- 2.9%
Visual Basic 6
- 2.5%
Lua
- 2.3%
Haskell
- 1.4%
27,612 responses; select all that apply. Shown as a percentage of the respondents who chose at least one language, framework, database, or platform.
For the fifth year in a row, JavaScript was the most commonly used programming language. And once again, SQL takes second place, and Java third. However, the use of Python overtook PHP for the first time in five years.
Frameworks, Libraries, and Other Technologies
Node.js
- 47.1%
AngularJS
- 44.3%
.NET Core
- 33.4%
React
- 19.5%
Cordova
- 11.0%
Firebase
- 9.8%
Xamarin
- 8.3%
Hadoop
- 5.7%
Spark
- 4.7%
20,229 responses; select all that apply
Node.js
- 25.8%
AngularJS
- 24.3%
.NET Core
- 18.3%
React
- 10.7%
Cordova
- 6.0%
Firebase
- 5.4%
Xamarin
- 4.5%
Hadoop
- 3.1%
Spark
- 2.6%
36,935 responses; select all that apply. Shown as a percentage of the respondents who chose at least one language, framework, database, or platform.
AngularJS
- 28.1%
Node.js
- 27.9%
.NET Core
- 19.6%
React
- 12.6%
Cordova
- 6.9%
Firebase
- 5.6%
Xamarin
- 4.8%
Hadoop
- 3.2%
Spark
- 2.7%
27,612 responses; select all that apply. Shown as a percentage of the respondents who chose at least one language, framework, database, or platform.
Node.js and AngularJS continue to be the most commonly used technologies in this category.
Databases
MySQL
- 55.6%
SQL Server
- 38.6%
SQLite
- 26.6%
PostgreSQL
- 26.5%
MongoDB
- 21.0%
Oracle
- 16.5%
Redis
- 14.1%
Cassandra
- 3.1%
29,452 responses; select all that apply
MySQL
- 44.3%
SQL Server
- 30.8%
SQLite
- 21.2%
PostgreSQL
- 21.2%
MongoDB
- 16.8%
Oracle
- 13.2%
Redis
- 11.2%
Cassandra
- 2.5%
36,935 responses; select all that apply. Shown as a percentage of the respondents who chose at least one language, framework, database, or platform.
MySQL
- 43.9%
SQL Server
- 34.1%
PostgreSQL
- 23.3%
SQLite
- 21.6%
MongoDB
- 18.5%
Oracle
- 14.0%
Redis
- 13.6%
Cassandra
- 2.9%
27,612 responses; select all that apply. Shown as a percentage of the respondents who chose at least one language, framework, database, or platform.
This is the first year we specifically asked developers what database technology they're using. MySQL and SQL Server were the most commonly used.
Platforms
Windows Desktop
- 41.0%
Linux Desktop
- 32.9%
Android
- 28.2%
Amazon Web Services (AWS)
- 28.1%
Mac OS
- 18.4%
iOS
- 16.4%
Raspberry Pi
- 16.1%
WordPress
- 15.6%
Microsoft Azure
- 11.4%
Arduino
- 10.3%
Windows Phone
- 3.9%
SharePoint
- 3.7%
Salesforce
- 2.6%
Serverless
- 2.1%
Mainframe
- 1.4%
29,114 responses; select all that apply
Windows Desktop
- 32.4%
Linux Desktop
- 26.0%
Android
- 22.2%
Amazon Web Services (AWS)
- 22.2%
Mac OS
- 14.5%
iOS
- 12.9%
Raspberry Pi
- 12.7%
WordPress
- 12.3%
Microsoft Azure
- 9.0%
Arduino
- 8.1%
Windows Phone
- 3.0%
SharePoint
- 2.9%
Salesforce
- 2.1%
Serverless
- 1.6%
Mainframe
- 1.1%
36,935 responses; select all that apply. Shown as a percentage of the respondents who chose at least one language, framework, database, or platform.
Windows Desktop
- 31.2%
Amazon Web Services (AWS)
- 25.6%
Linux Desktop
- 24.2%
Android
- 21.7%
Mac OS
- 15.3%
iOS
- 14.3%
WordPress
- 12.2%
Raspberry Pi
- 11.3%
Microsoft Azure
- 10.5%
Arduino
- 6.5%
Windows Phone
- 3.1%
SharePoint
- 2.9%
Salesforce
- 2.3%
Serverless
- 1.9%
Mainframe
- 1.1%
27,612 responses; select all that apply. Shown as a percentage of the respondents who chose at least one language, framework, database, or platform.
Windows Desktop was the most commonly used platform by developers, followed by Linux Desktop.
Languages Over Time
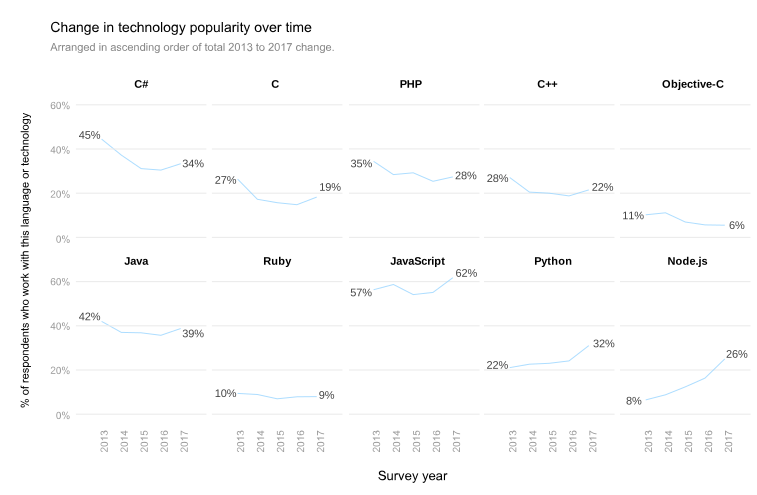
In the five years we've been collecting the Developer Survey, we've seen languages such as Python and Node.js grow in popularity, while the usage of languages like C# and C has been shrinking.
Most Loved, Dreaded, and Wanted
Most Loved, Dreaded, and Wanted Languages
Rust
- 73.1%
Smalltalk
- 67.0%
TypeScript
- 64.1%
Swift
- 63.9%
Go
- 63.3%
Python
- 62.7%
Elixir
- 62.4%
C#
- 61.7%
Scala
- 59.9%
Clojure
- 59.8%
JavaScript
- 59.8%
F#
- 56.2%
Haskell
- 54.5%
SQL
- 53.4%
C++
- 52.0%
Julia
- 50.7%
Java
- 50.5%
R
- 49.9%
Ruby
- 48.5%
C
- 41.7%
PHP
- 41.4%
Erlang
- 39.9%
Dart
- 38.6%
Common Lisp
- 37.4%
Groovy
- 37.1%
% of developers who are developing with the language or technology and have expressed interest in continuing to develop with it
Visual Basic 6
- 88.3%
VBA
- 80.4%
CoffeeScript
- 79.2%
VB.NET
- 77.2%
Matlab
- 72.3%
Objective-C
- 68.1%
Assembly
- 67.6%
Perl
- 65.9%
Lua
- 65.8%
Hack
- 64.5%
Groovy
- 62.9%
Common Lisp
- 62.6%
Dart
- 61.4%
Erlang
- 60.1%
PHP
- 58.6%
C
- 58.3%
Ruby
- 51.5%
R
- 50.1%
Java
- 49.5%
Julia
- 49.3%
C++
- 48.0%
SQL
- 46.6%
Haskell
- 45.5%
F#
- 43.8%
JavaScript
- 40.2%
% of developers who are developing with the language or technology but have not expressed interest in continuing to do so
Python
- 20.6%
JavaScript
- 18.6%
Go
- 13.5%
C++
- 11.8%
Java
- 11.7%
TypeScript
- 10.3%
C#
- 10.1%
Swift
- 8.7%
Ruby
- 7.0%
Rust
- 6.6%
SQL
- 6.5%
Scala
- 6.5%
C
- 6.4%
Haskell
- 5.4%
R
- 5.1%
F#
- 4.9%
PHP
- 4.1%
Assembly
- 3.8%
Elixir
- 3.6%
Objective-C
- 3.2%
Clojure
- 2.9%
Erlang
- 2.6%
CoffeeScript
- 2.2%
Lua
- 2.1%
Perl
- 1.5%
% of developers who are not developing with the language or technology but have expressed interest in developing with it
For the second year in a row, Rust was the most loved programming language. This means that proportionally, more developers wanted to continue working with it than any other language. Swift, last year's second most popular language, ranked as fourth.
For the second year in a row, Visual Basic (for 2017, Visual Basic 6, specifically) ranked as the most dreaded language. Most dreaded means that a high percentage of developers who are currently using the technology express no interest in continuing to do so.
Python shot to the most wanted language this year (as in, the language developers want to use this year more than any other), after ranking fourth last year.
Most Loved, Dreaded, and Wanted Frameworks, Libraries and Other Technologies
React
- 66.9%
Node.js
- 62.1%
.NET Core
- 60.9%
Spark
- 60.1%
Firebase
- 52.9%
AngularJS
- 51.7%
Hadoop
- 48.8%
Xamarin
- 48.7%
Cordova
- 38.8%
% of developers who are developing with the language or technology and have expressed interest in continuing to develop with it
Cordova
- 61.2%
Xamarin
- 51.3%
Hadoop
- 51.2%
AngularJS
- 48.3%
Firebase
- 47.1%
Spark
- 39.9%
.NET Core
- 39.1%
Node.js
- 37.9%
React
- 33.1%
% of developers who are developing with the language or technology but have not expressed interest in continuing to do so
Node.js
- 22.2%
AngularJS
- 19.4%
React
- 18.9%
.NET Core
- 12.8%
Xamarin
- 8.4%
Hadoop
- 7.9%
Spark
- 5.4%
Firebase
- 5.4%
Cordova
- 3.7%
% of developers who are not developing with the language or technology but have expressed interest in developing with it
React is the most loved among developers, whereas Cordova is the most dreaded. However, Node.js is the most wanted.
Most Loved, Dreaded, and Wanted Databases
Redis
- 64.8%
PostgreSQL
- 60.8%
MongoDB
- 55.0%
SQL Server
- 54.2%
Cassandra
- 49.9%
MySQL
- 49.6%
SQLite
- 47.2%
Oracle
- 36.9%
% of developers who are developing with the language or technology and have expressed interest in continuing to develop with it
Oracle
- 63.1%
SQLite
- 52.8%
MySQL
- 50.4%
Cassandra
- 50.1%
SQL Server
- 45.8%
MongoDB
- 45.0%
PostgreSQL
- 39.2%
Redis
- 35.2%
% of developers who are developing with the language or technology but have not expressed interest in continuing to do so
MongoDB
- 20.8%
PostgreSQL
- 11.5%
Redis
- 10.6%
MySQL
- 8.5%
Cassandra
- 7.5%
SQLite
- 7.2%
SQL Server
- 4.6%
Oracle
- 3.8%
% of developers who are not developing with the language or technology but have expressed interest in developing with it
Redis was the most loved database, meaning that proportionally, more developers wanted to continue working with it than any other database. Meanwhile, Oracle is the most dreaded. Finally, more developers wanted to work with MongoDB this year than any other database.
Most Loved, Dreaded, and Wanted Platforms
Linux Desktop
- 69.6%
Serverless
- 66.3%
Amazon Web Services (AWS)
- 65.2%
Raspberry Pi
- 65.2%
Mac OS
- 62.3%
iOS
- 62.0%
Microsoft Azure
- 61.7%
Android
- 61.6%
Arduino
- 59.2%
Windows Desktop
- 56.0%
Mainframe
- 42.3%
Windows Phone
- 39.2%
WordPress
- 35.5%
Salesforce
- 29.4%
SharePoint
- 29.1%
% of developers who are developing with the language or technology and have expressed interest in continuing to develop with it
SharePoint
- 70.9%
Salesforce
- 70.6%
WordPress
- 64.5%
Windows Phone
- 60.8%
Mainframe
- 57.7%
Windows Desktop
- 44.0%
Arduino
- 40.8%
Android
- 38.4%
Microsoft Azure
- 38.3%
iOS
- 38.0%
Mac OS
- 37.7%
Raspberry Pi
- 34.8%
Amazon Web Services (AWS)
- 34.8%
Serverless
- 33.7%
Linux Desktop
- 30.4%
% of developers who are developing with the language or technology but have not expressed interest in continuing to do so
Android
- 20.6%
Amazon Web Services (AWS)
- 18.6%
Raspberry Pi
- 15.4%
iOS
- 13.2%
Linux Desktop
- 9.6%
Arduino
- 8.4%
Microsoft Azure
- 7.1%
Mac OS
- 6.6%
Serverless
- 4.0%
Windows Desktop
- 3.9%
Windows Phone
- 2.7%
WordPress
- 2.2%
Salesforce
- 1.1%
SharePoint
- 1.0%
Mainframe
- 0.7%
% of developers who are not developing with the language or technology but have expressed interest in developing with it
Linux Desktop was the most loved platform. Sharepoint was the most dreaded. And finally, more developers wanted to work with Android this year than any other platform.
Technologies and Occupations
Most Popular Languages by Occupation
JavaScript
- 81.7%
SQL
- 60.4%
C#
- 38.1%
Java
- 37.9%
PHP
- 33.8%
Python
- 25.3%
TypeScript
- 14.4%
C++
- 12.6%
Ruby
- 11.1%
C
- 10.3%
VB.NET
- 6.5%
Objective-C
- 5.5%
Swift
- 5.5%
Go
- 4.9%
CoffeeScript
- 4.7%
Groovy
- 4.0%
Scala
- 4.0%
Perl
- 3.8%
VBA
- 3.2%
R
- 2.5%
Visual Basic 6
- 2.4%
Assembly
- 2.4%
Lua
- 2.0%
Matlab
- 1.9%
Elixir
- 1.4%
20,091 responses; select all that apply
SQL
- 60.2%
JavaScript
- 60.0%
C#
- 59.4%
Java
- 39.9%
C++
- 31.3%
Python
- 25.4%
PHP
- 21.6%
C
- 21.3%
TypeScript
- 12.1%
VB.NET
- 12.0%
Objective-C
- 7.7%
VBA
- 7.0%
Swift
- 6.1%
Ruby
- 5.7%
Assembly
- 5.3%
Visual Basic 6
- 5.3%
Perl
- 3.9%
Go
- 3.7%
Matlab
- 3.6%
Groovy
- 3.2%
Lua
- 2.9%
Scala
- 2.7%
R
- 2.6%
F#
- 2.4%
CoffeeScript
- 2.2%
8,155 responses; select all that apply
JavaScript
- 73.9%
SQL
- 63.9%
Java
- 41.4%
Python
- 38.9%
PHP
- 37.8%
C#
- 35.1%
C++
- 20.7%
C
- 18.5%
Ruby
- 14.0%
TypeScript
- 13.3%
Go
- 9.2%
Perl
- 8.5%
VB.NET
- 7.3%
Swift
- 6.8%
Objective-C
- 6.6%
Groovy
- 6.3%
CoffeeScript
- 5.6%
Scala
- 5.5%
VBA
- 5.2%
Assembly
- 4.5%
Lua
- 3.7%
R
- 3.6%
Visual Basic 6
- 3.4%
Matlab
- 2.7%
Haskell
- 2.1%
5,258 responses; select all that apply
JavaScript
- 58.7%
SQL
- 58.0%
Python
- 45.0%
Java
- 44.4%
C#
- 35.2%
C++
- 32.0%
PHP
- 24.6%
C
- 24.0%
R
- 11.2%
TypeScript
- 9.2%
Ruby
- 9.2%
Scala
- 8.6%
Matlab
- 8.2%
Objective-C
- 7.1%
VB.NET
- 6.8%
Assembly
- 6.7%
Perl
- 6.6%
Swift
- 6.4%
Go
- 6.4%
VBA
- 5.9%
Groovy
- 4.5%
CoffeeScript
- 3.9%
Visual Basic 6
- 3.7%
Lua
- 3.5%
Haskell
- 2.8%
4,779 responses; select all that apply
JavaScript and SQL are the most popular languages across web developers, desktop developers, sysadmins/DevOps, and data scientists. Not surprisingly, R is far more popular with data scientists than other occupations.
Most Popular Developer Environments by Occupation
Visual Studio
- 38.8%
Notepad++
- 34.3%
Sublime Text
- 31.4%
Vim
- 27.1%
Visual Studio Code
- 24.0%
IntelliJ
- 23.0%
Atom
- 20.0%
Eclipse
- 20.0%
Android Studio
- 14.0%
PHPStorm
- 11.7%
Xcode
- 9.2%
NetBeans
- 7.8%
PyCharm
- 7.7%
Emacs
- 4.2%
IPython / Jupyter
- 3.4%
RubyMine
- 2.2%
RStudio
- 1.3%
TextMate
- 1.2%
Coda
- 0.7%
Komodo
- 0.6%
Zend
- 0.5%
Light Table
- 0.2%
19,772 responses; select all that apply
Visual Studio
- 66.4%
Notepad++
- 48.1%
Visual Studio Code
- 25.8%
Eclipse
- 25.2%
Vim
- 21.2%
Sublime Text
- 21.1%
IntelliJ
- 18.8%
Android Studio
- 17.4%
Atom
- 12.7%
Xcode
- 11.4%
NetBeans
- 8.9%
PyCharm
- 7.3%
PHPStorm
- 4.9%
Emacs
- 4.6%
IPython / Jupyter
- 2.8%
RStudio
- 1.5%
RubyMine
- 1.4%
TextMate
- 1.2%
Komodo
- 0.7%
Coda
- 0.5%
Zend
- 0.4%
Light Table
- 0.2%
7,973 responses; select all that apply
Vim
- 42.1%
Visual Studio
- 35.9%
Notepad++
- 33.1%
Sublime Text
- 28.6%
IntelliJ
- 23.8%
Visual Studio Code
- 22.4%
Eclipse
- 21.9%
Atom
- 20.7%
Android Studio
- 15.4%
PHPStorm
- 12.2%
PyCharm
- 11.3%
Xcode
- 10.5%
NetBeans
- 8.2%
Emacs
- 7.0%
IPython / Jupyter
- 5.6%
RubyMine
- 2.6%
RStudio
- 1.8%
TextMate
- 1.6%
Komodo
- 0.9%
Coda
- 0.9%
Zend
- 0.6%
Light Table
- 0.3%
5,164 responses; select all that apply
Visual Studio
- 39.1%
Notepad++
- 36.7%
Vim
- 34.0%
Eclipse
- 26.9%
Sublime Text
- 26.1%
IntelliJ
- 25.2%
Visual Studio Code
- 17.3%
Atom
- 15.9%
Android Studio
- 15.5%
PyCharm
- 14.0%
IPython / Jupyter
- 12.7%
Xcode
- 10.7%
Emacs
- 9.5%
NetBeans
- 9.0%
RStudio
- 7.1%
PHPStorm
- 6.9%
RubyMine
- 1.7%
TextMate
- 1.4%
Komodo
- 1.0%
Coda
- 0.6%
Zend
- 0.6%
Light Table
- 0.4%
4,659 responses; select all that apply
Visual Studio was the most popular developer environment tool for web developers, desktop developers, and data scientists—but not for sysadmins/DevOps, who preferred Vim above all else. Notepad++ was popular across the board.
Top Paying Technologies
Top Paying Technologies by Region
Clojure
- $72,000
Rust
- $65,714
Elixir
- $65,000
F#
- $64,516
Go
- $64,516
Perl
- $63,068
Groovy
- $61,809
Ruby
- $60,000
Scala
- $60,000
R
- $57,125
CoffeeScript
- $55,054
Lua
- $54,919
TypeScript
- $54,299
Haskell
- $53,763
Objective-C
- $53,763
Python
- $53,763
Swift
- $53,763
C#
- $53,750
C++
- $51,324
VBA
- $50,476
JavaScript
- $50,000
Matlab
- $50,000
SQL
- $50,000
VB.NET
- $50,000
C
- $49,423
Median of 12,128 responses
Go
- $110,000
Scala
- $110,000
Objective-C
- $109,000
CoffeeScript
- $105,500
Perl
- $105,000
C++
- $100,890
C
- $100,000
R
- $100,000
Swift
- $100,000
TypeScript
- $100,000
Python
- $99,000
Groovy
- $98,250
Ruby
- $97,000
Java
- $96,000
SQL
- $91,000
C#
- $90,000
JavaScript
- $90,000
Assembly
- $83,000
PHP
- $80,000
VBA
- $80,000
VB.NET
- $75,000
Median of 3,603 responses
TypeScript
- $53,763
Ruby
- $51,250
C#
- $50,750
C++
- $50,000
Java
- $50,000
Python
- $50,000
JavaScript
- $48,506
C
- $48,256
SQL
- $48,125
VB.NET
- $43,750
PHP
- $42,500
Median of 1,398 responses
Java
- $53,763
Python
- $53,763
TypeScript
- $53,763
C
- $51,613
C++
- $51,613
JavaScript
- $51,613
SQL
- $51,613
C#
- $50,538
PHP
- $45,161
Median of 958 responses
Python
- $8,809
Java
- $7,341
JavaScript
- $7,047
C#
- $6,901
SQL
- $6,695
C++
- $6,622
C
- $6,240
PHP
- $5,286
Median of 706 responses
Python
- $42,151
C++
- $41,075
JavaScript
- $39,785
SQL
- $39,785
Java
- $39,086
C#
- $38,710
PHP
- $37,634
Median of 450 responses
Globally, developers who use Clojure in their jobs have the highest average salary at $72,000. In the U.S., developers who use Go as well as developers who use Scala are highest paid with an average salary of $110,000. In the UK, it's TypeScript at $53,763, while in Germany, it's Java at the same. Finally, in France, it's Python at $42,151.
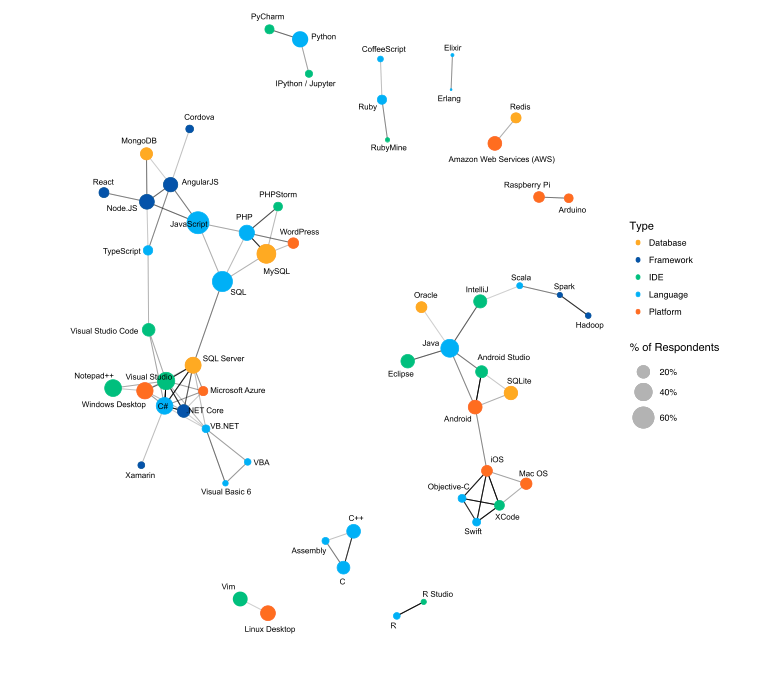
Technologies were clustered into several distinct "ecosystems" that tended to be used by the same developers. On the left of this chart we can see a large cluster representing web development (with JavaScript at the center) and one for Microsoft technologies (centered around C# and Visual Studio). On the right we see a constellation connecting Java, Android, and iOS. Other smaller correlated clusters included C/C++/Assembly, Raspberry Pi with Arduino, and languages like Python and R alongside language-specific IDEs.
Work
Developers generally love their career path. Whether they like their current job is another story.
Employment
Employment Status
Employed full-time
- 70.3%
Independent contractor, freelancer, or self-employed
- 10.2%
Employed part-time
- 6.2%
Not employed, and not looking for work
- 5.4%
Not employed, but looking for work
- 5.4%
I prefer not to say
- 2.1%
Retired
- 0.3%
51,392 responses
Employed full-time
- 83.6%
Independent contractor, freelancer, or self-employed
- 10.2%
Employed part-time
- 3.9%
Not employed, but looking for work
- 1.3%
I prefer not to say
- 0.5%
Not employed, and not looking for work
- 0.3%
Retired
- 0.1%
36,131 responses
Most developers are employed full time, and an additional 10.2% work as independent contractors, freelancers, or are self-employed.
Employment Status by Geography
Employed full-time
- 76.7%
Independent contractor, freelancer, or self-employed
- 6.7%
Employed part-time
- 5.2%
Not employed, and not looking for work
- 4.7%
Not employed, but looking for work
- 4.6%
I prefer not to say
- 1.5%
Retired
- 0.5%
11,455 responses
Employed full-time
- 71.7%
Independent contractor, freelancer, or self-employed
- 9.4%
Not employed, but looking for work
- 6.2%
Employed part-time
- 5.6%
Not employed, and not looking for work
- 5.3%
I prefer not to say
- 1.2%
Retired
- 0.7%
2,233 responses
Employed full-time
- 75.0%
Independent contractor, freelancer, or self-employed
- 11.5%
Not employed, and not looking for work
- 5.3%
Not employed, but looking for work
- 3.3%
Employed part-time
- 2.7%
I prefer not to say
- 1.8%
Retired
- 0.4%
4,740 responses
Employed full-time
- 67.1%
Employed part-time
- 13.0%
Independent contractor, freelancer, or self-employed
- 9.1%
Not employed, and not looking for work
- 5.1%
I prefer not to say
- 3.2%
Not employed, but looking for work
- 2.3%
Retired
- 0.2%
4,143 responses
Employed full-time
- 69.1%
Independent contractor, freelancer, or self-employed
- 9.6%
Employed part-time
- 7.9%
Not employed, and not looking for work
- 6.3%
Not employed, but looking for work
- 4.6%
I prefer not to say
- 2.2%
Retired
- 0.3%
1,740 responses
Employed full-time
- 72.2%
Not employed, but looking for work
- 9.0%
Independent contractor, freelancer, or self-employed
- 7.1%
Not employed, and not looking for work
- 5.8%
I prefer not to say
- 3.3%
Employed part-time
- 2.5%
Retired
- 0.2%
5,197 responses
The United States has a somewhat lower proportion of freelance or independent contractor developers compared to the rest of the world, and Germany has an unusually high proportion of developers working part-time.
Employment Status for Professional Developers by Geography
Employed full-time
- 89.2%
Independent contractor, freelancer, or self-employed
- 6.5%
Employed part-time
- 2.2%
Not employed, but looking for work
- 1.6%
I prefer not to say
- 0.3%
Not employed, and not looking for work
- 0.2%
Retired
- 0.0%
8,310 responses
Employed full-time
- 84.2%
Independent contractor, freelancer, or self-employed
- 9.8%
Employed part-time
- 2.9%
Not employed, but looking for work
- 2.0%
Not employed, and not looking for work
- 0.5%
I prefer not to say
- 0.4%
Retired
- 0.2%
1,605 responses
Employed full-time
- 85.4%
Independent contractor, freelancer, or self-employed
- 12.2%
Employed part-time
- 1.1%
Not employed, but looking for work
- 0.6%
I prefer not to say
- 0.4%
Not employed, and not looking for work
- 0.3%
Retired
- 0.1%
3,568 responses
Employed full-time
- 79.0%
Independent contractor, freelancer, or self-employed
- 10.3%
Employed part-time
- 9.0%
I prefer not to say
- 0.8%
Not employed, but looking for work
- 0.6%
Not employed, and not looking for work
- 0.4%
Retired
- 0.0%
2,767 responses
Employed full-time
- 83.9%
Independent contractor, freelancer, or self-employed
- 9.7%
Employed part-time
- 4.3%
Not employed, but looking for work
- 1.1%
Not employed, and not looking for work
- 0.5%
I prefer not to say
- 0.3%
Retired
- 0.2%
1,246 responses
Employed full-time
- 89.5%
Independent contractor, freelancer, or self-employed
- 6.4%
Not employed, but looking for work
- 1.5%
Employed part-time
- 1.3%
I prefer not to say
- 1.0%
Not employed, and not looking for work
- 0.3%
Retired
- 0.1%
3,438 responses
Respondents who are professional developers are employed full-time at higher rates.
Company Type
Industry Breakdown
Software
- 28.2%
Internet or Web services
- 14.3%
Finance, banking, or insurance
- 8.5%
Media, advertising, publishing, or entertainment
- 4.9%
Other
- 4.5%
Consulting
- 4.3%
Education
- 4.2%
Health care services
- 3.7%
Telecommunications
- 3.2%
Retail or wholesale trade
- 2.9%
Government (including military)
- 2.9%
I prefer not to answer
- 2.8%
Computer hardware or consumer electronics
- 2.3%
Transportation, logistics, or warehousing
- 2.0%
Automotive
- 1.8%
Aerospace or defense
- 1.7%
Gaming
- 1.7%
Industrial equipment/heavy machinery
- 1.4%
Energy generation/distribution
- 1.1%
Pharmaceuticals and/or medical devices
- 1.0%
Nonprofit/nongovernmental organizations
- 0.8%
Construction
- 0.6%
Agriculture, forestry, or fisheries
- 0.6%
Mining or oil & gas extraction
- 0.5%
44,072 responses
Software
- 30.1%
Internet or Web services
- 14.7%
Finance, banking, or insurance
- 9.1%
Media, advertising, publishing, or entertainment
- 5.2%
Consulting
- 4.2%
Other
- 3.9%
Health care services
- 3.8%
Telecommunications
- 3.2%
Education
- 3.0%
Retail or wholesale trade
- 2.9%
Government (including military)
- 2.6%
I prefer not to answer
- 2.4%
Transportation, logistics, or warehousing
- 2.1%
Computer hardware or consumer electronics
- 2.1%
Automotive
- 1.8%
Gaming
- 1.7%
Aerospace or defense
- 1.7%
Industrial equipment/heavy machinery
- 1.3%
Energy generation/distribution
- 1.0%
Pharmaceuticals and/or medical devices
- 0.9%
Nonprofit/nongovernmental organizations
- 0.7%
Agriculture, forestry, or fisheries
- 0.5%
Construction
- 0.5%
Mining or oil & gas extraction
- 0.5%
35,305 responses
More developers work for software and internet/web companies than any other industry, but developers are also employed in diverse industries across the economy. Aside from software, the portion of developers in different industries varies by region: In the United States, for instance, healthcare and government employ a higher than average proportion of developers.
Company Size
Fewer than 10 employees
- 9.8%
10 to 19 employees
- 10.5%
20 to 99 employees
- 22.1%