Maximize PostgreSQL Performance
pgDash provides a range of innovative diagnostic and monitoring features to help you gain insight and maximise the performance of your PostgreSQL deployment.
Diagnostics
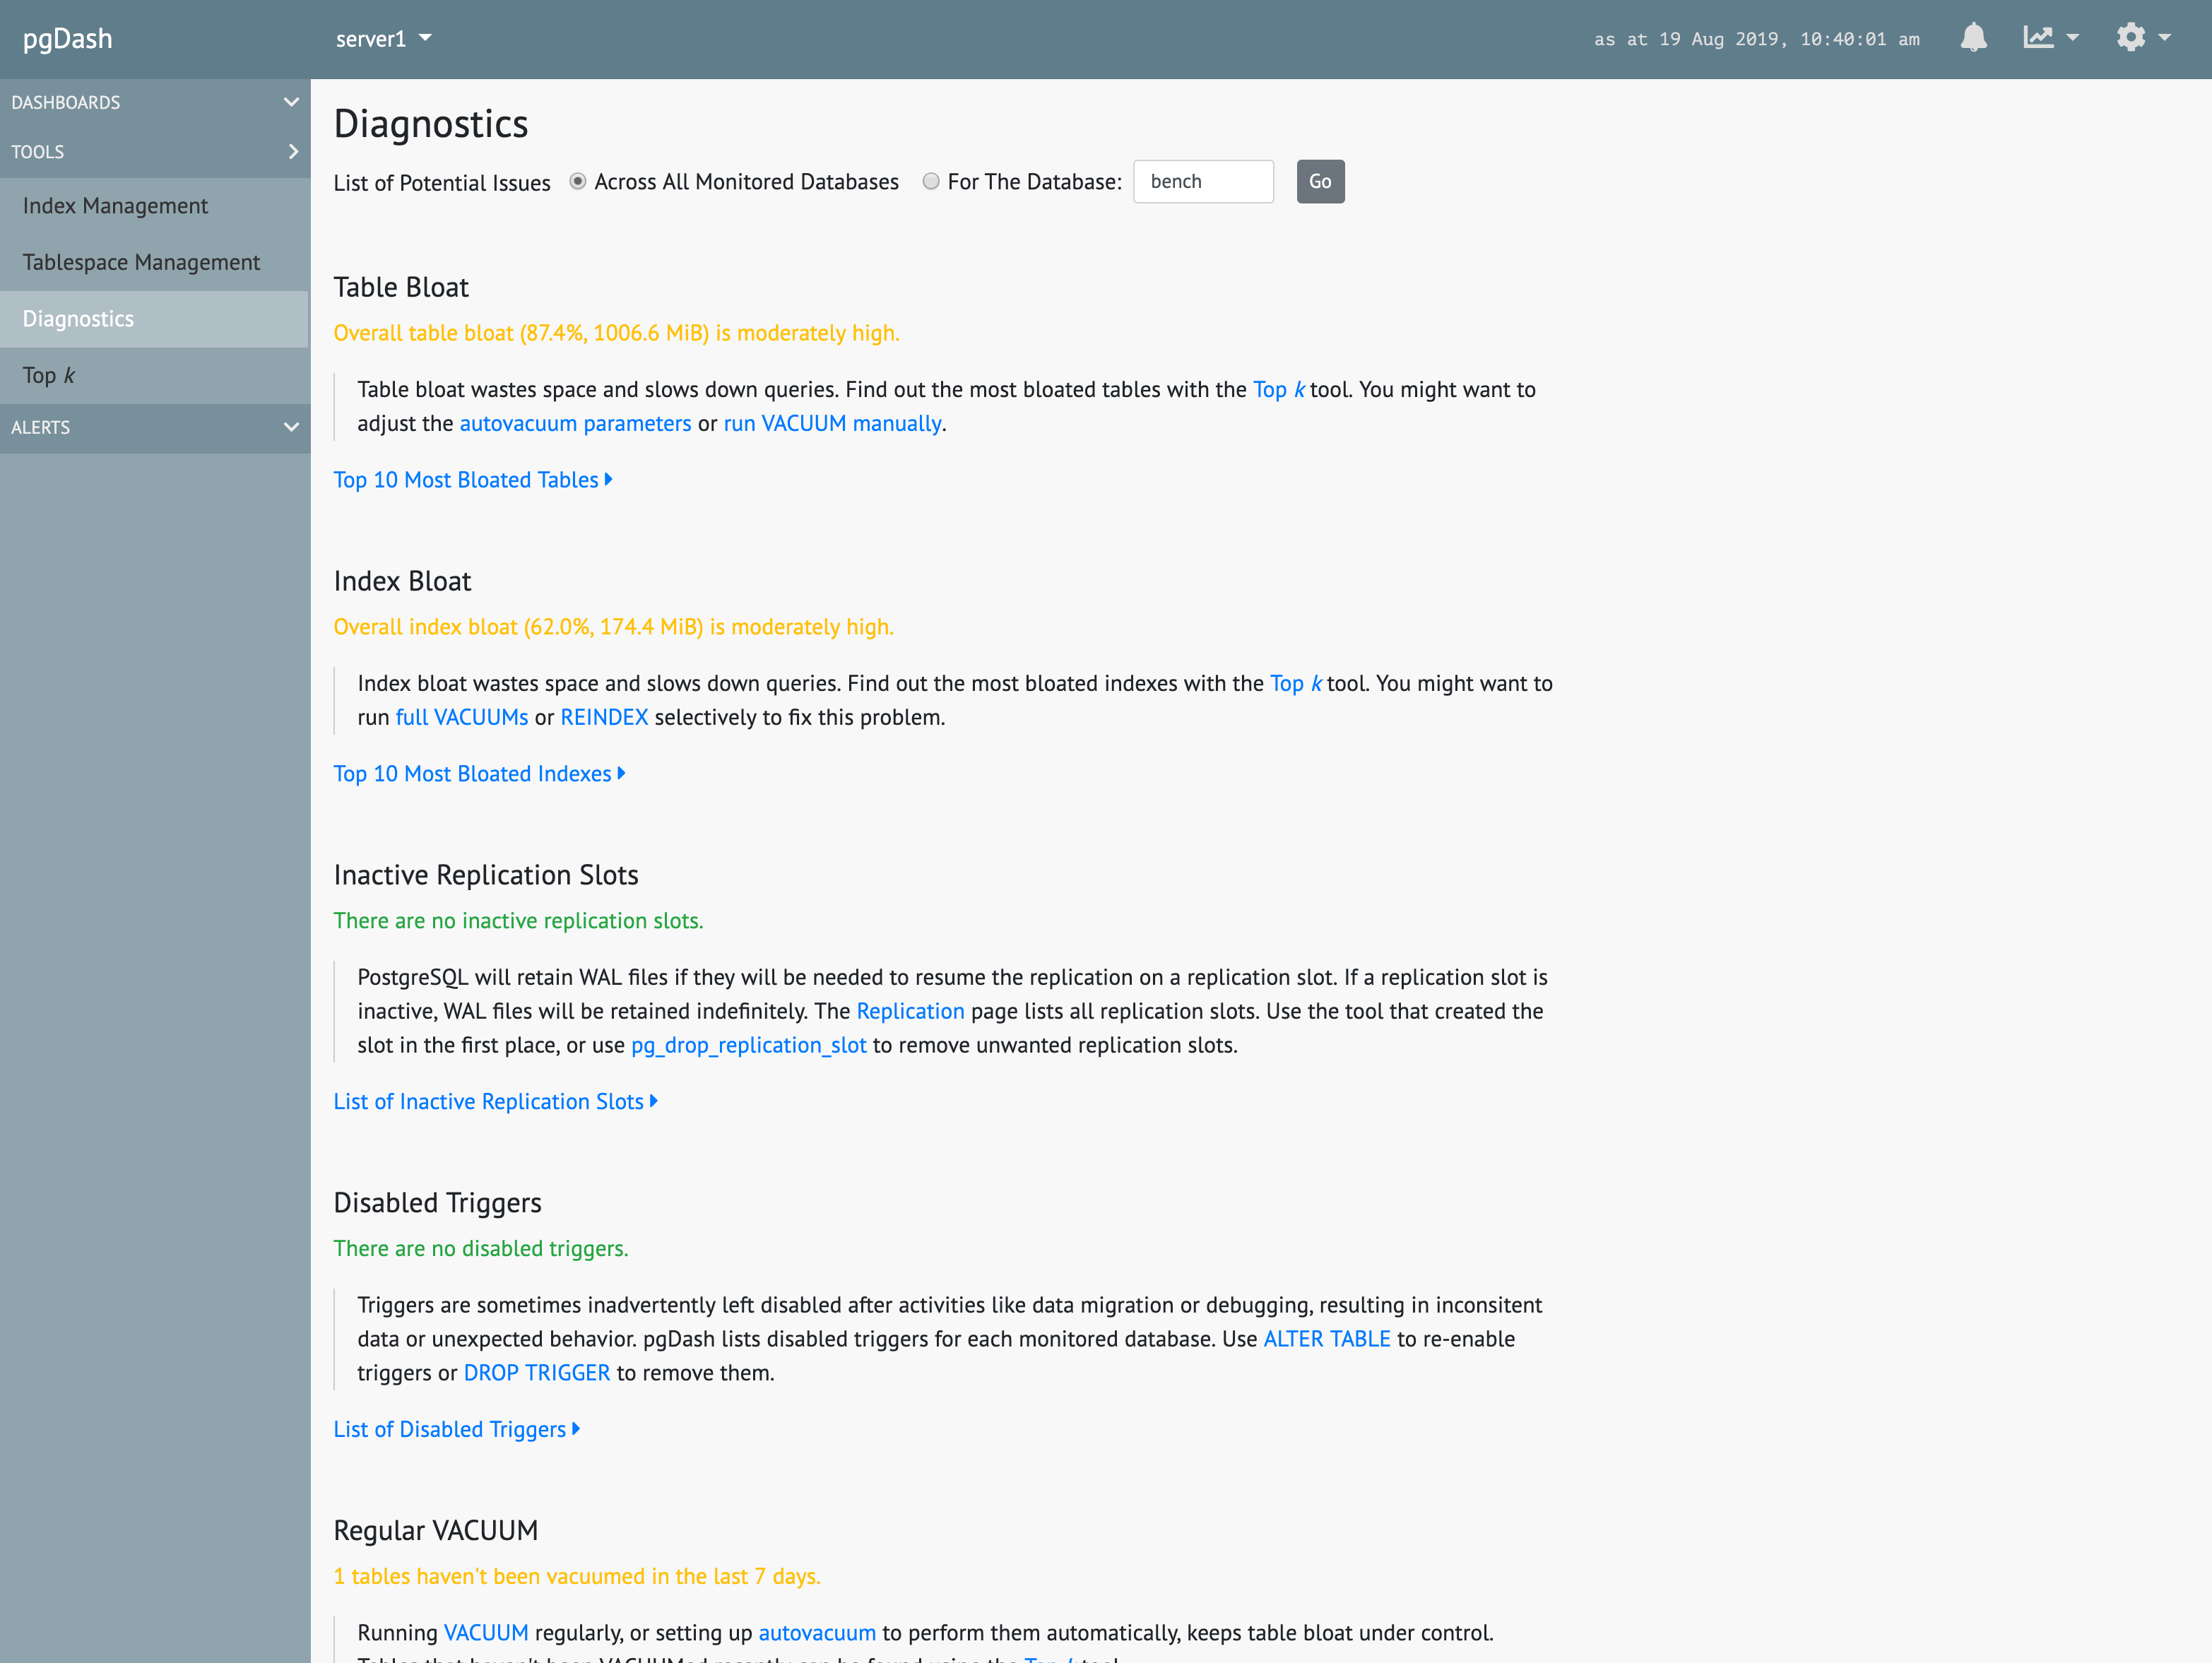
Review automatically generated Diagnostic reports that examine your PostgreSQL servers and databases and highlight issues that can impact the health and performance of your deployment.
Locks & Backends
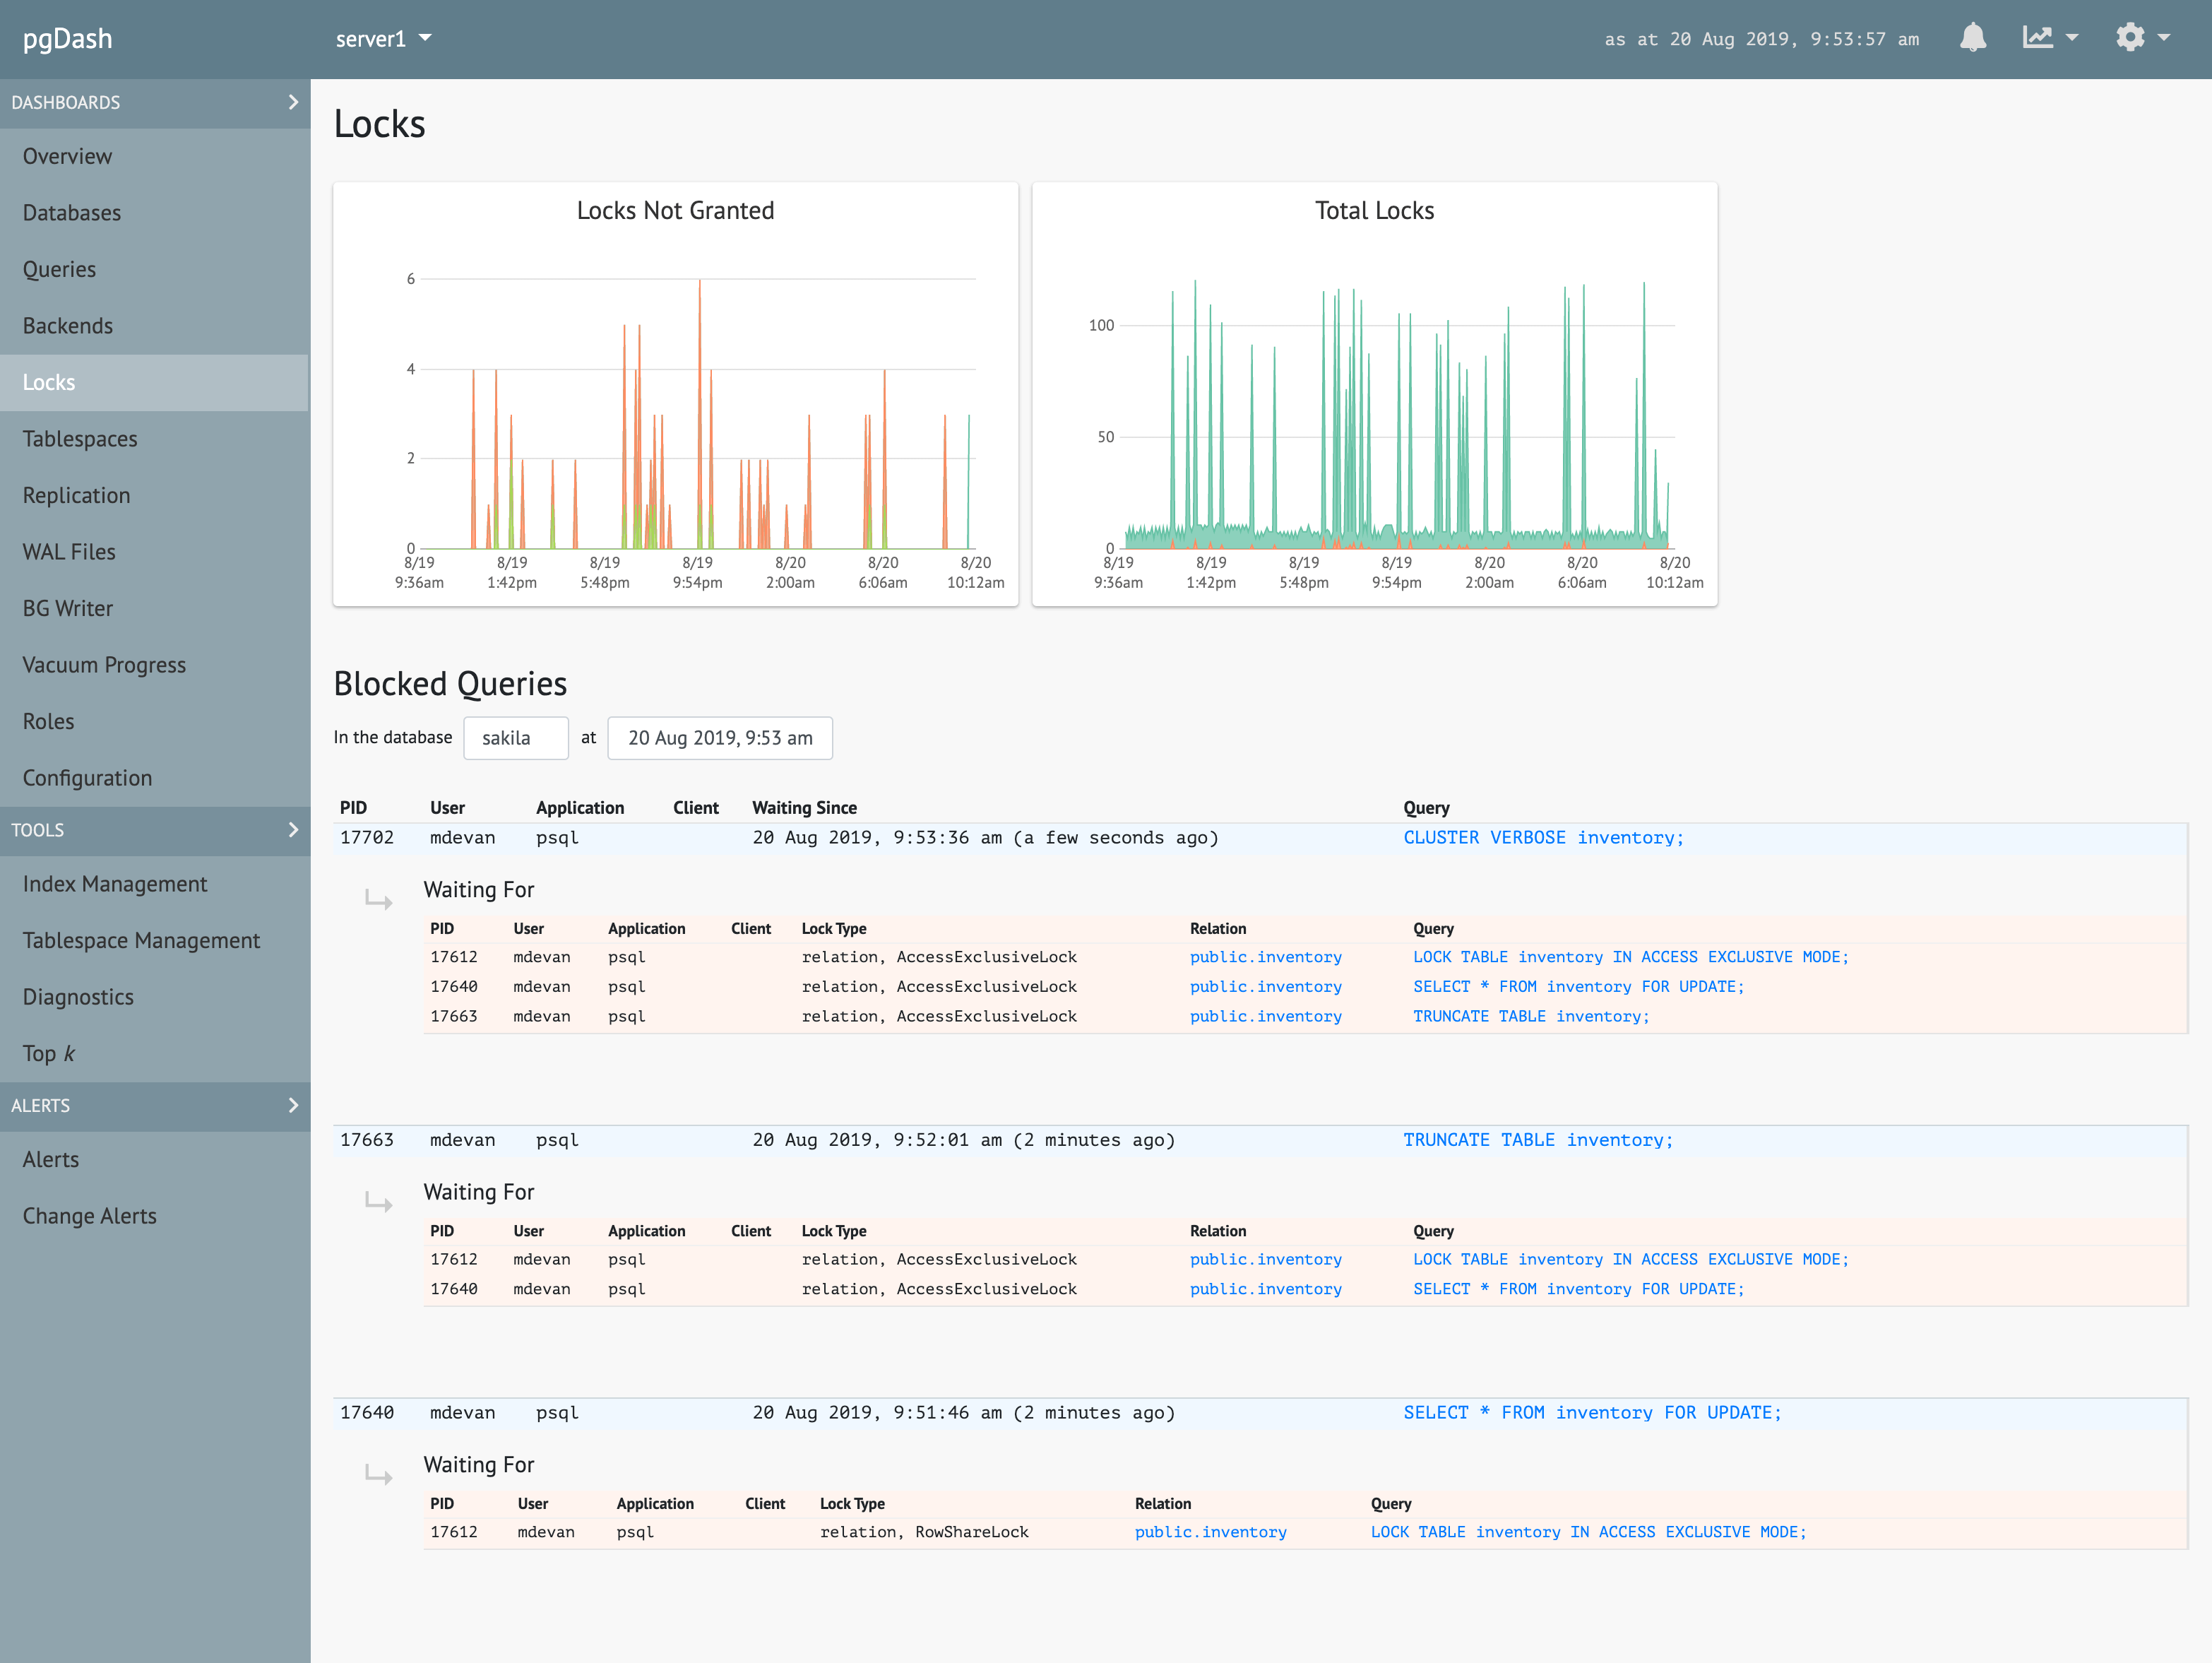
See which queries are waiting for which others. Track backends waiting on locks, transactions that have been open too long and idling transactions.
Queries
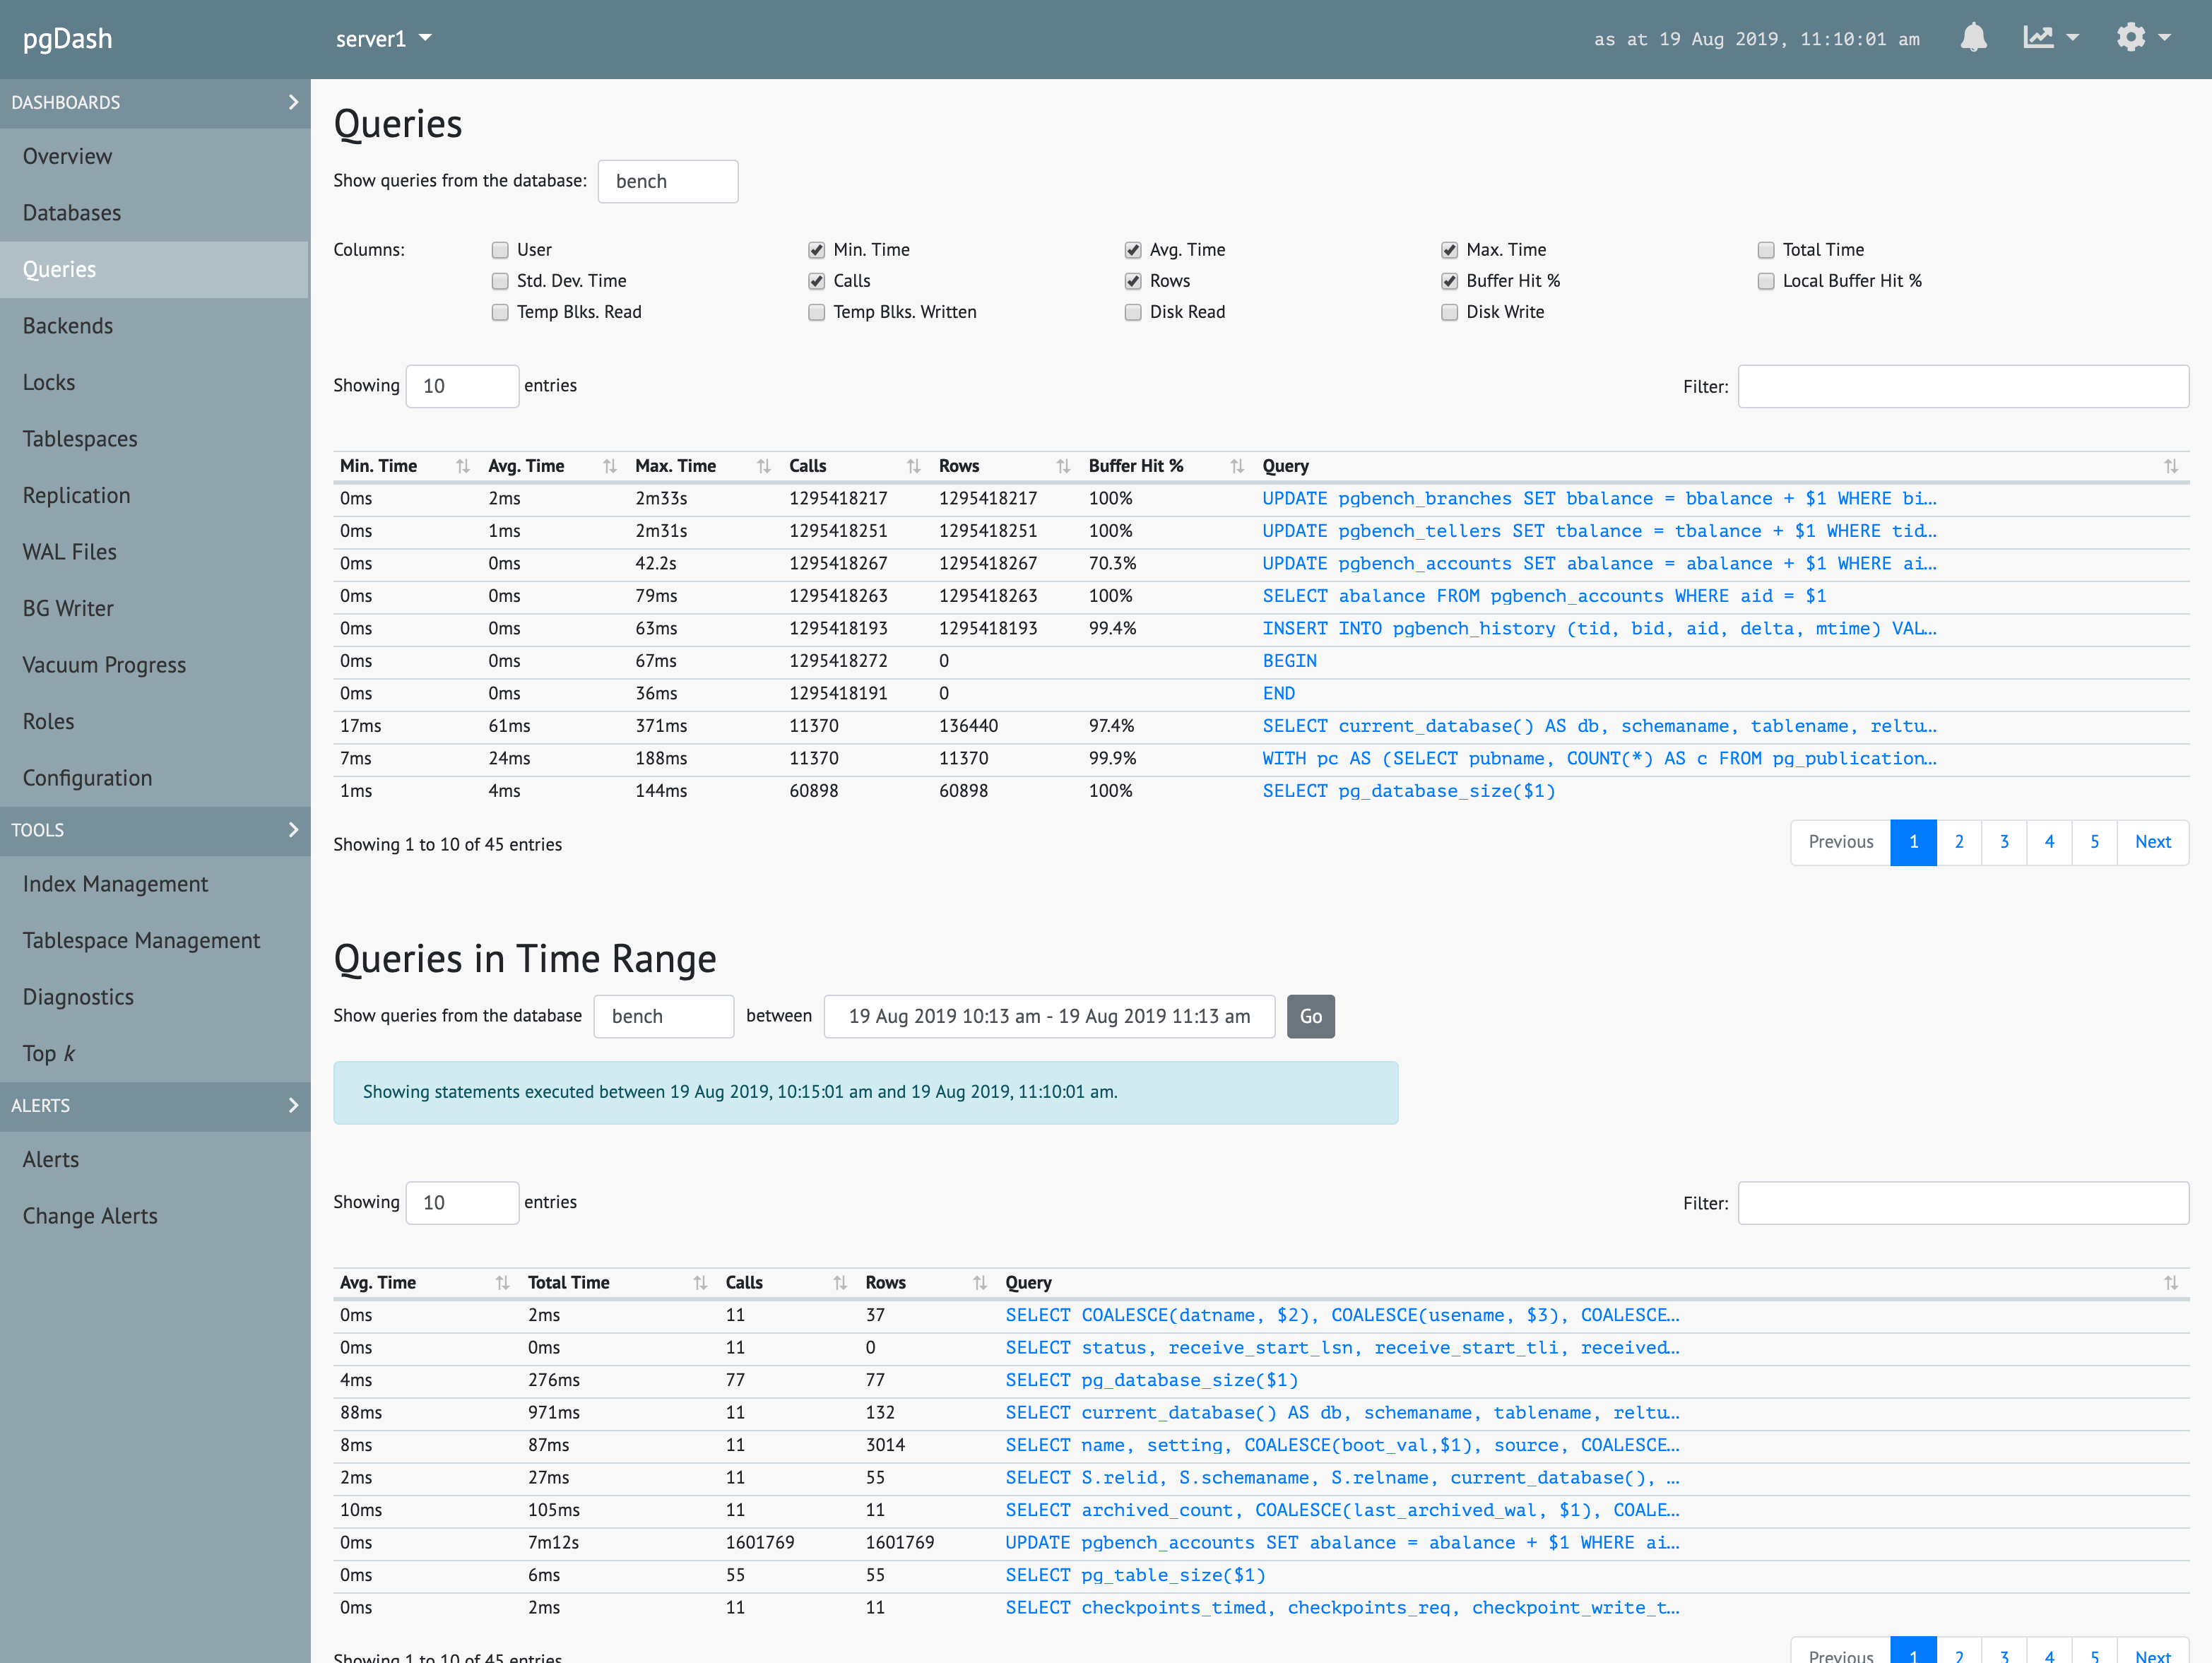
Extensive information about each SQL query executed, including time series graphs, execution plans with visualization, and suggestions to improve query performance.
Top k
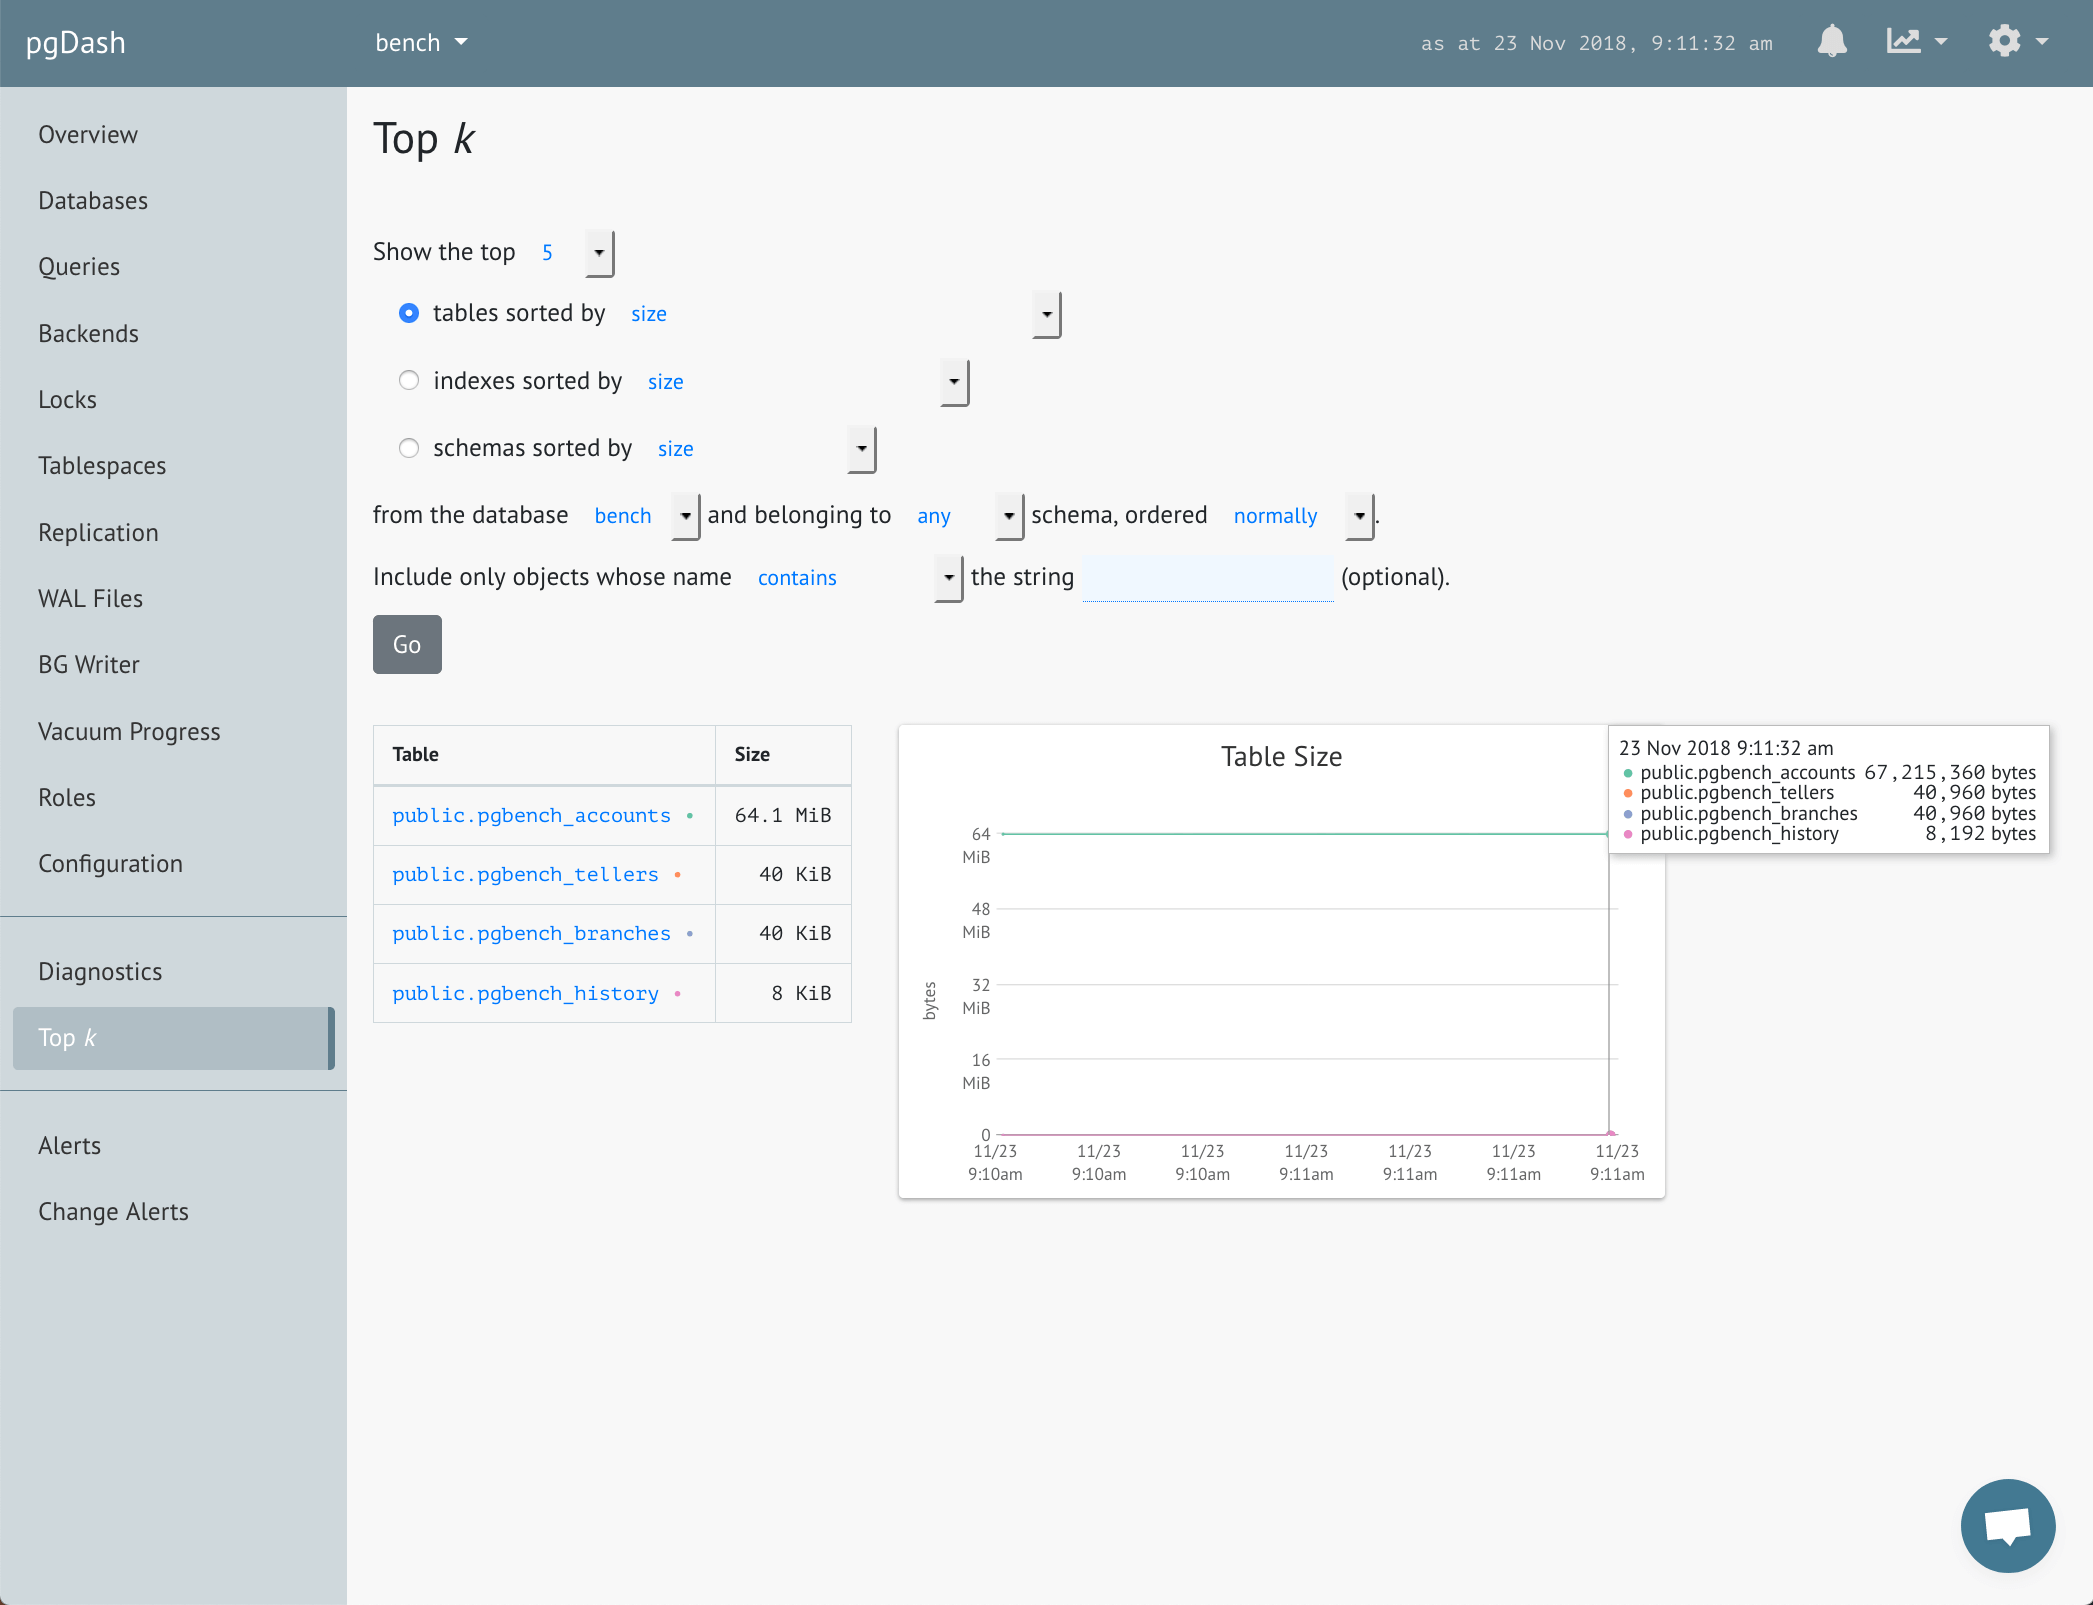
Identify the top tables, indexes or schemas, based on a number of criteria, like size, rows, growth, object counts and more.
Index Management
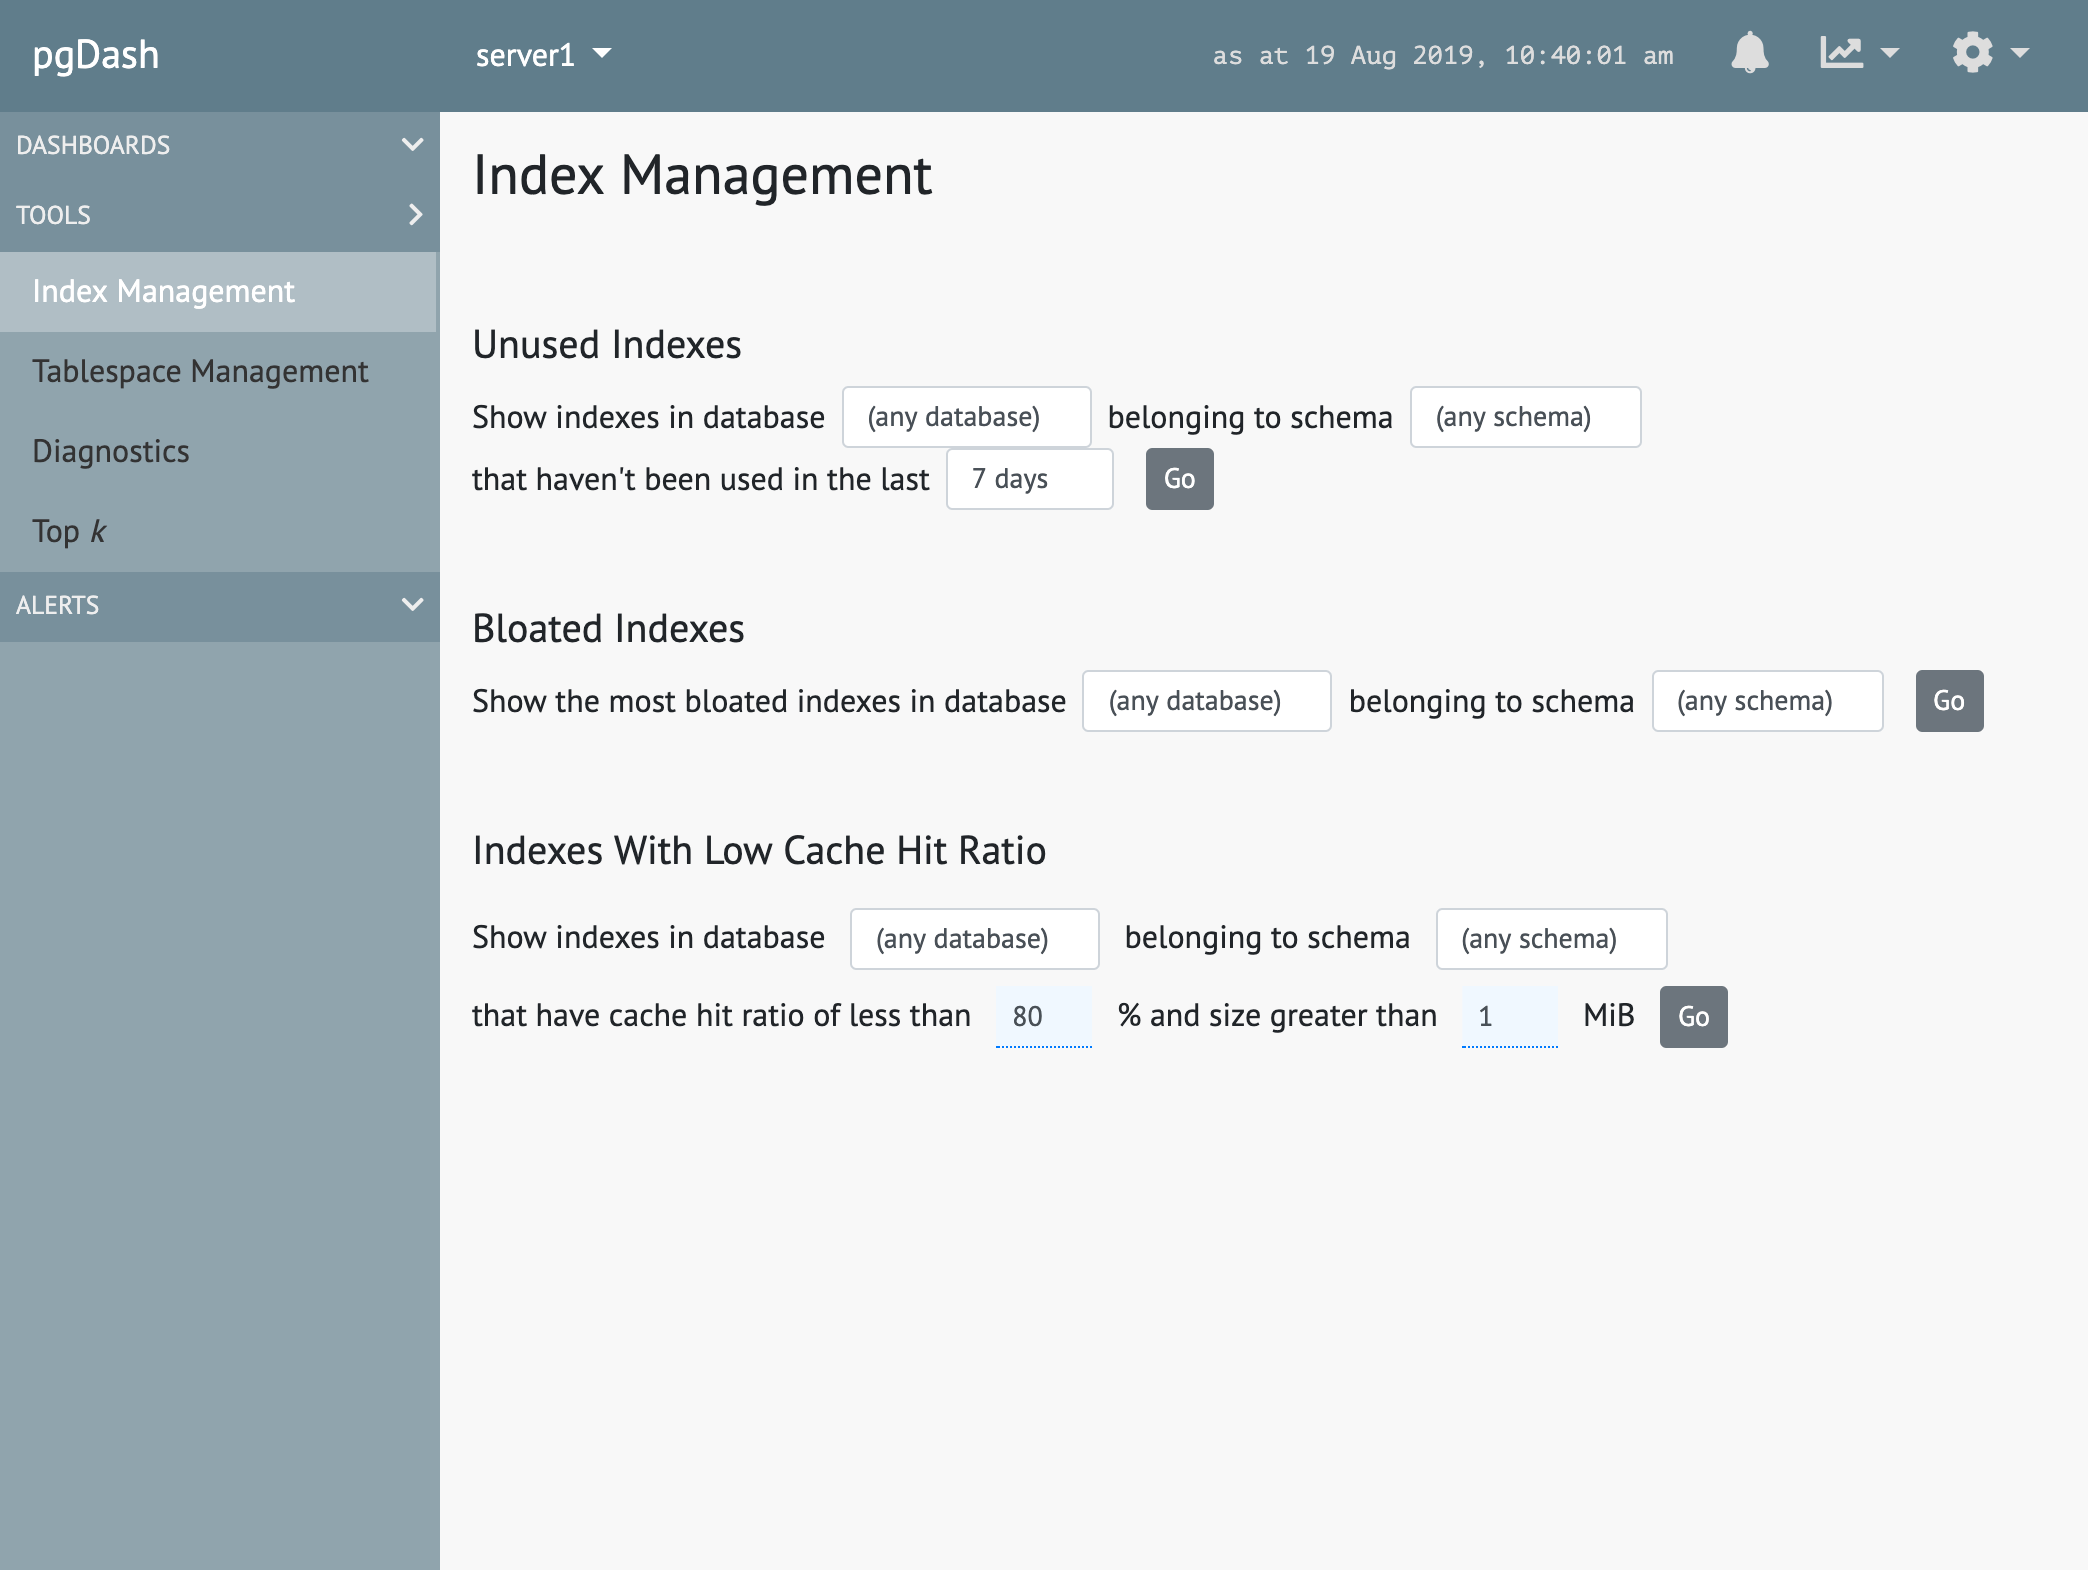
Find indexes that haven't been used recently, that are candidates for dropping. Identify indexes that are too bloated and need reindexing.
Tablespace Management
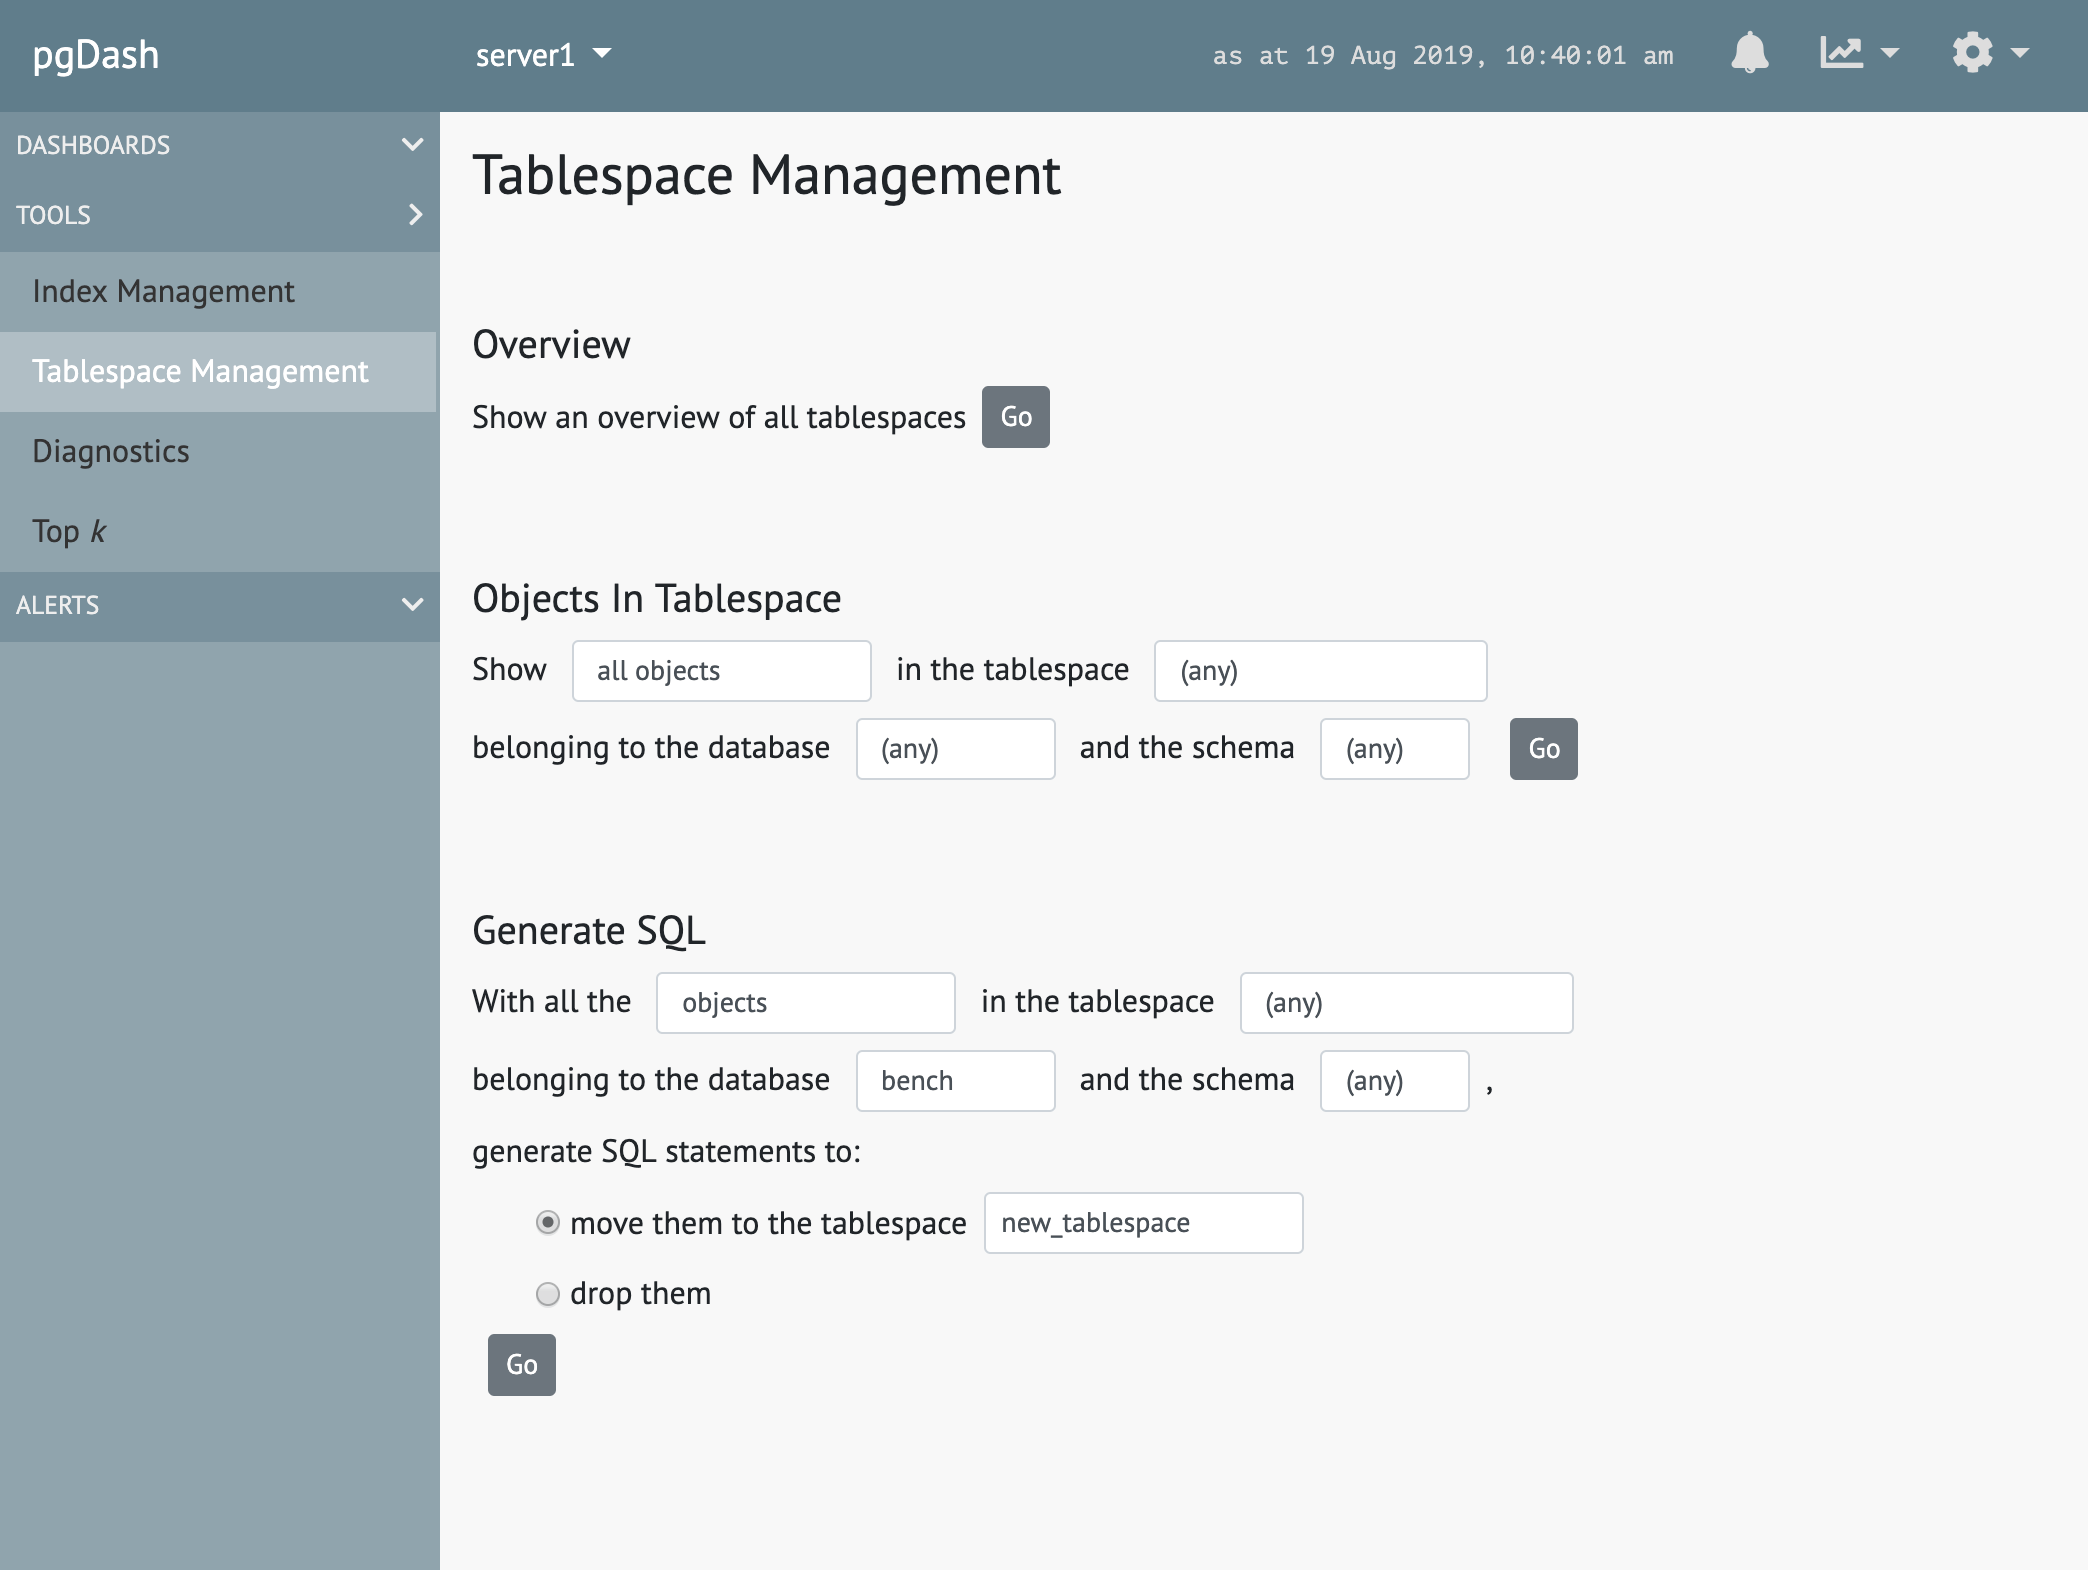
Figure out which objects in your tablespaces are taking up the most space and generate SQL statements to move them around or drop them.
Keep an Eye on Core PostgreSQL Functions
pgDash provides insight into core PostgreSQL functions so that you can monitor activity and take corrective action before issues become critical.
Tables & Indexes
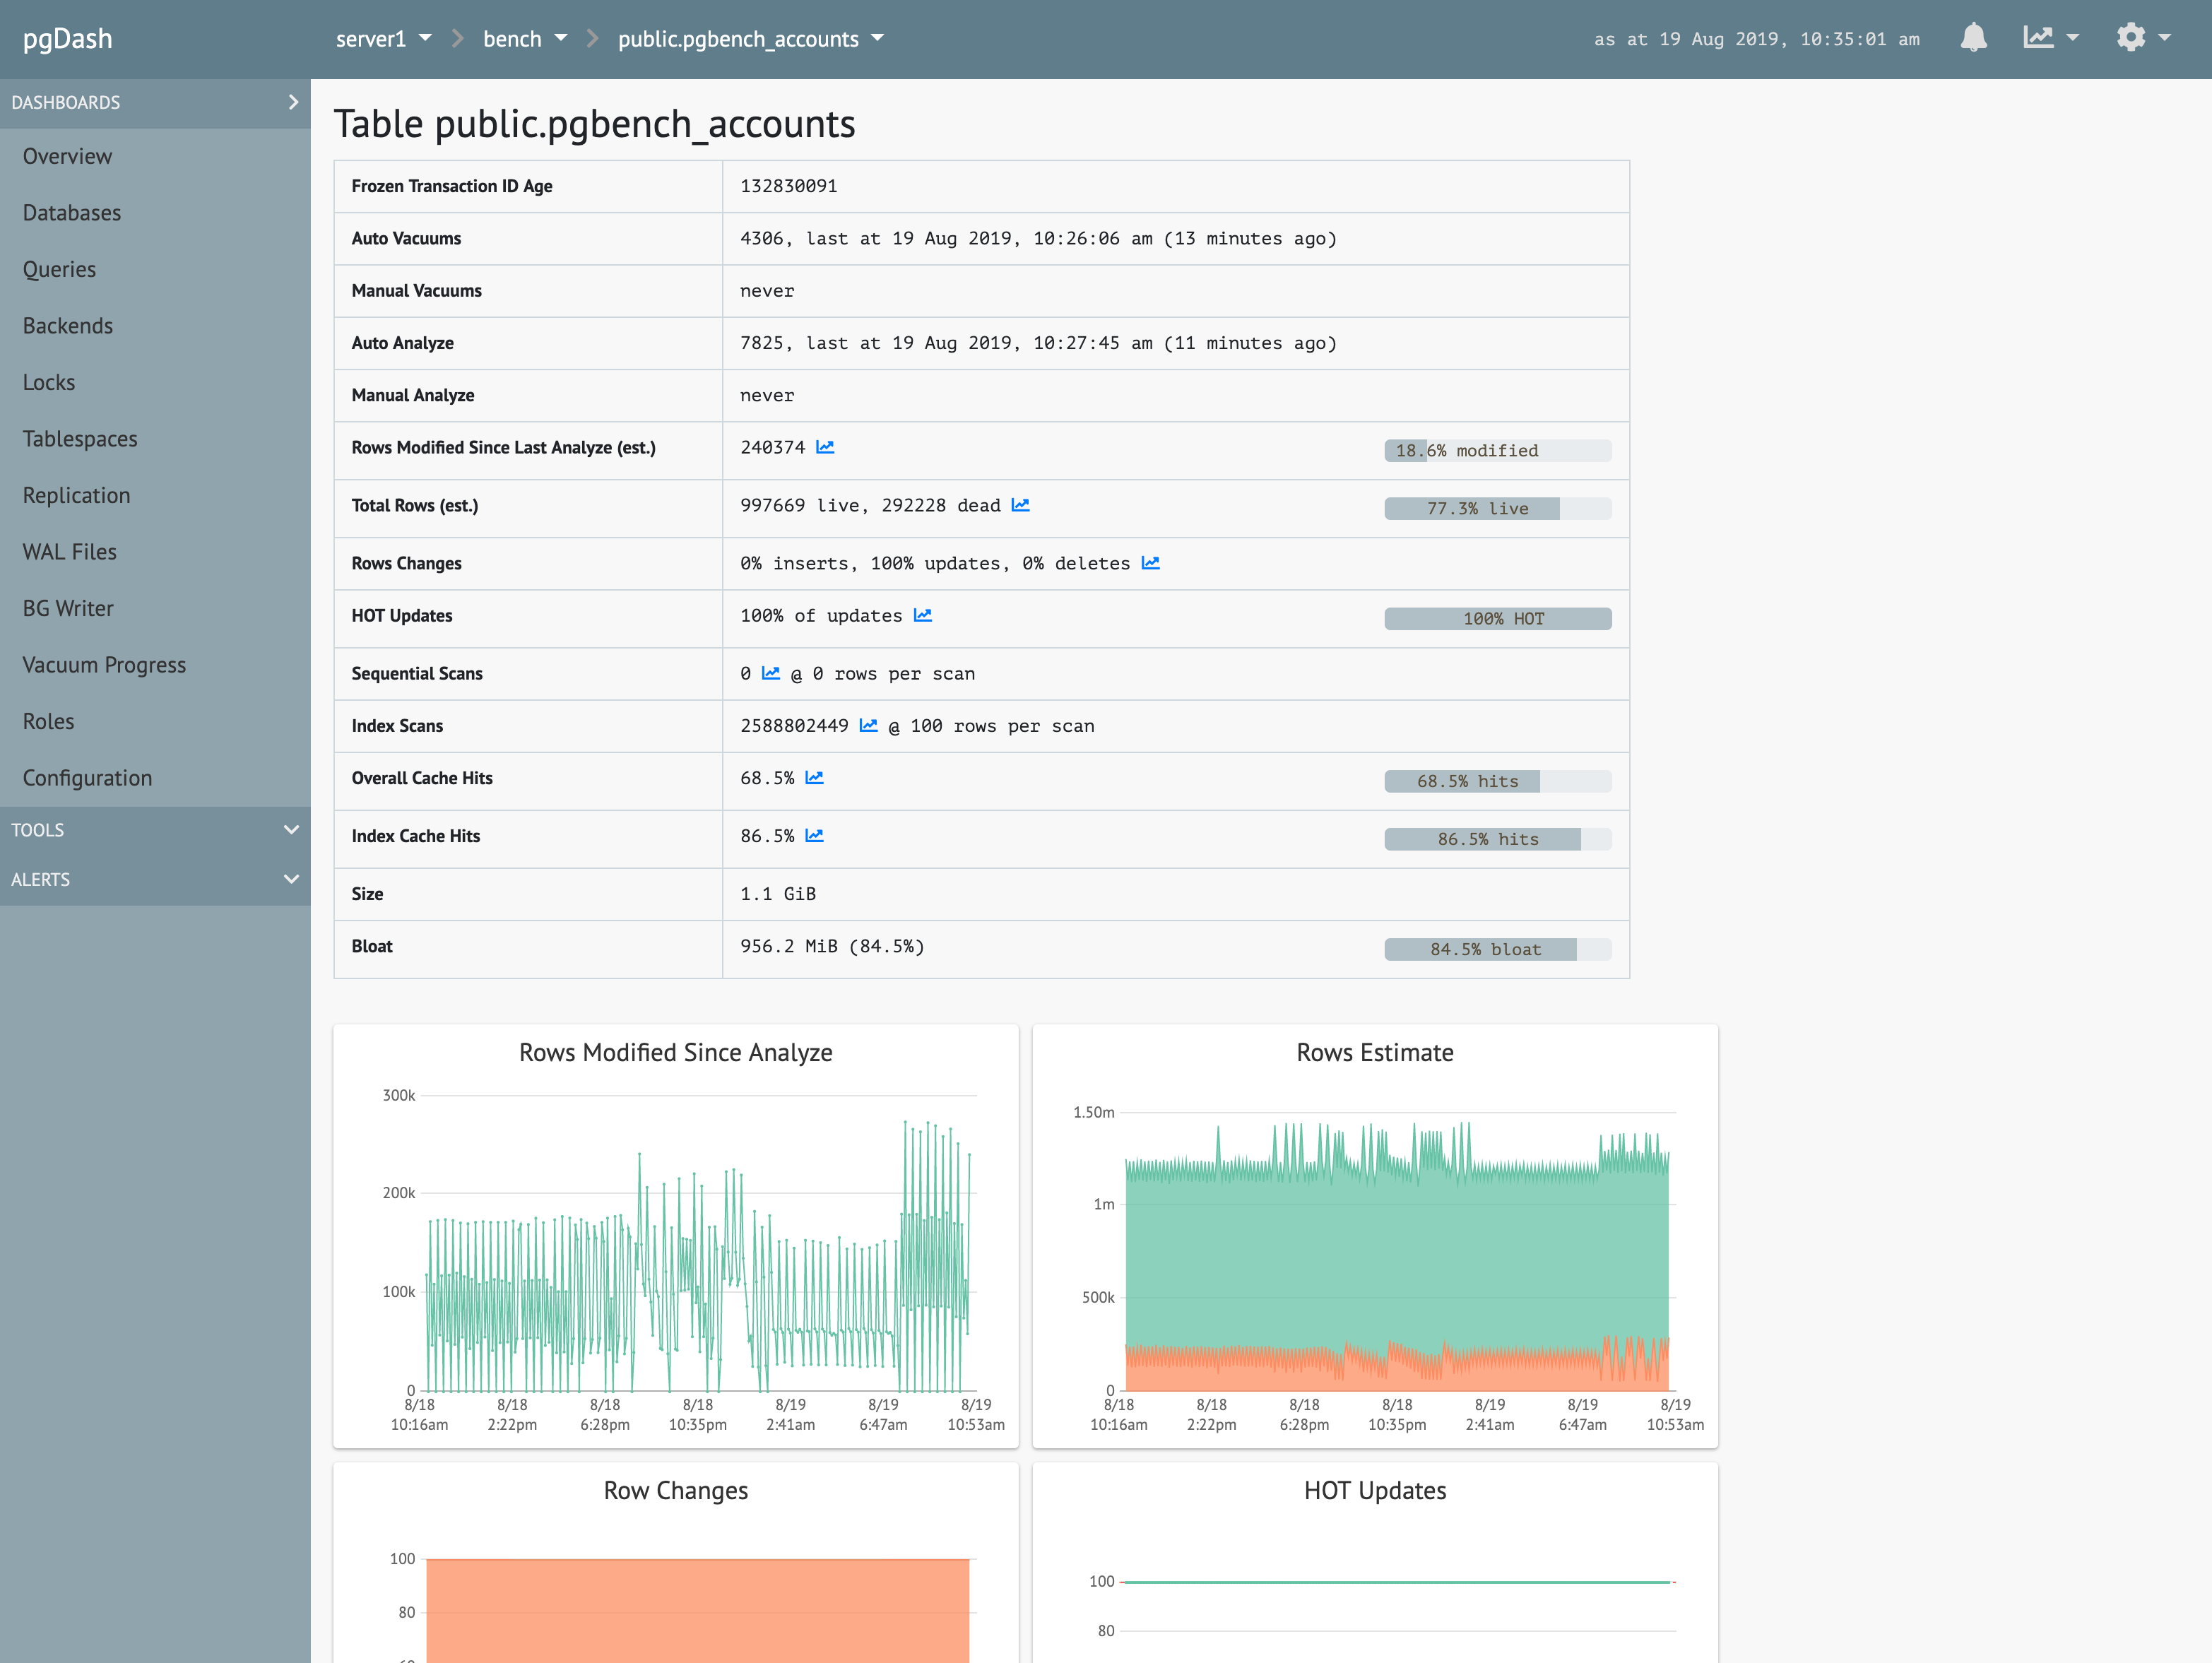
Review information about each table and index, like size, bloat, activity, vacuum and analyze information, cache efficiency and more.
Databases
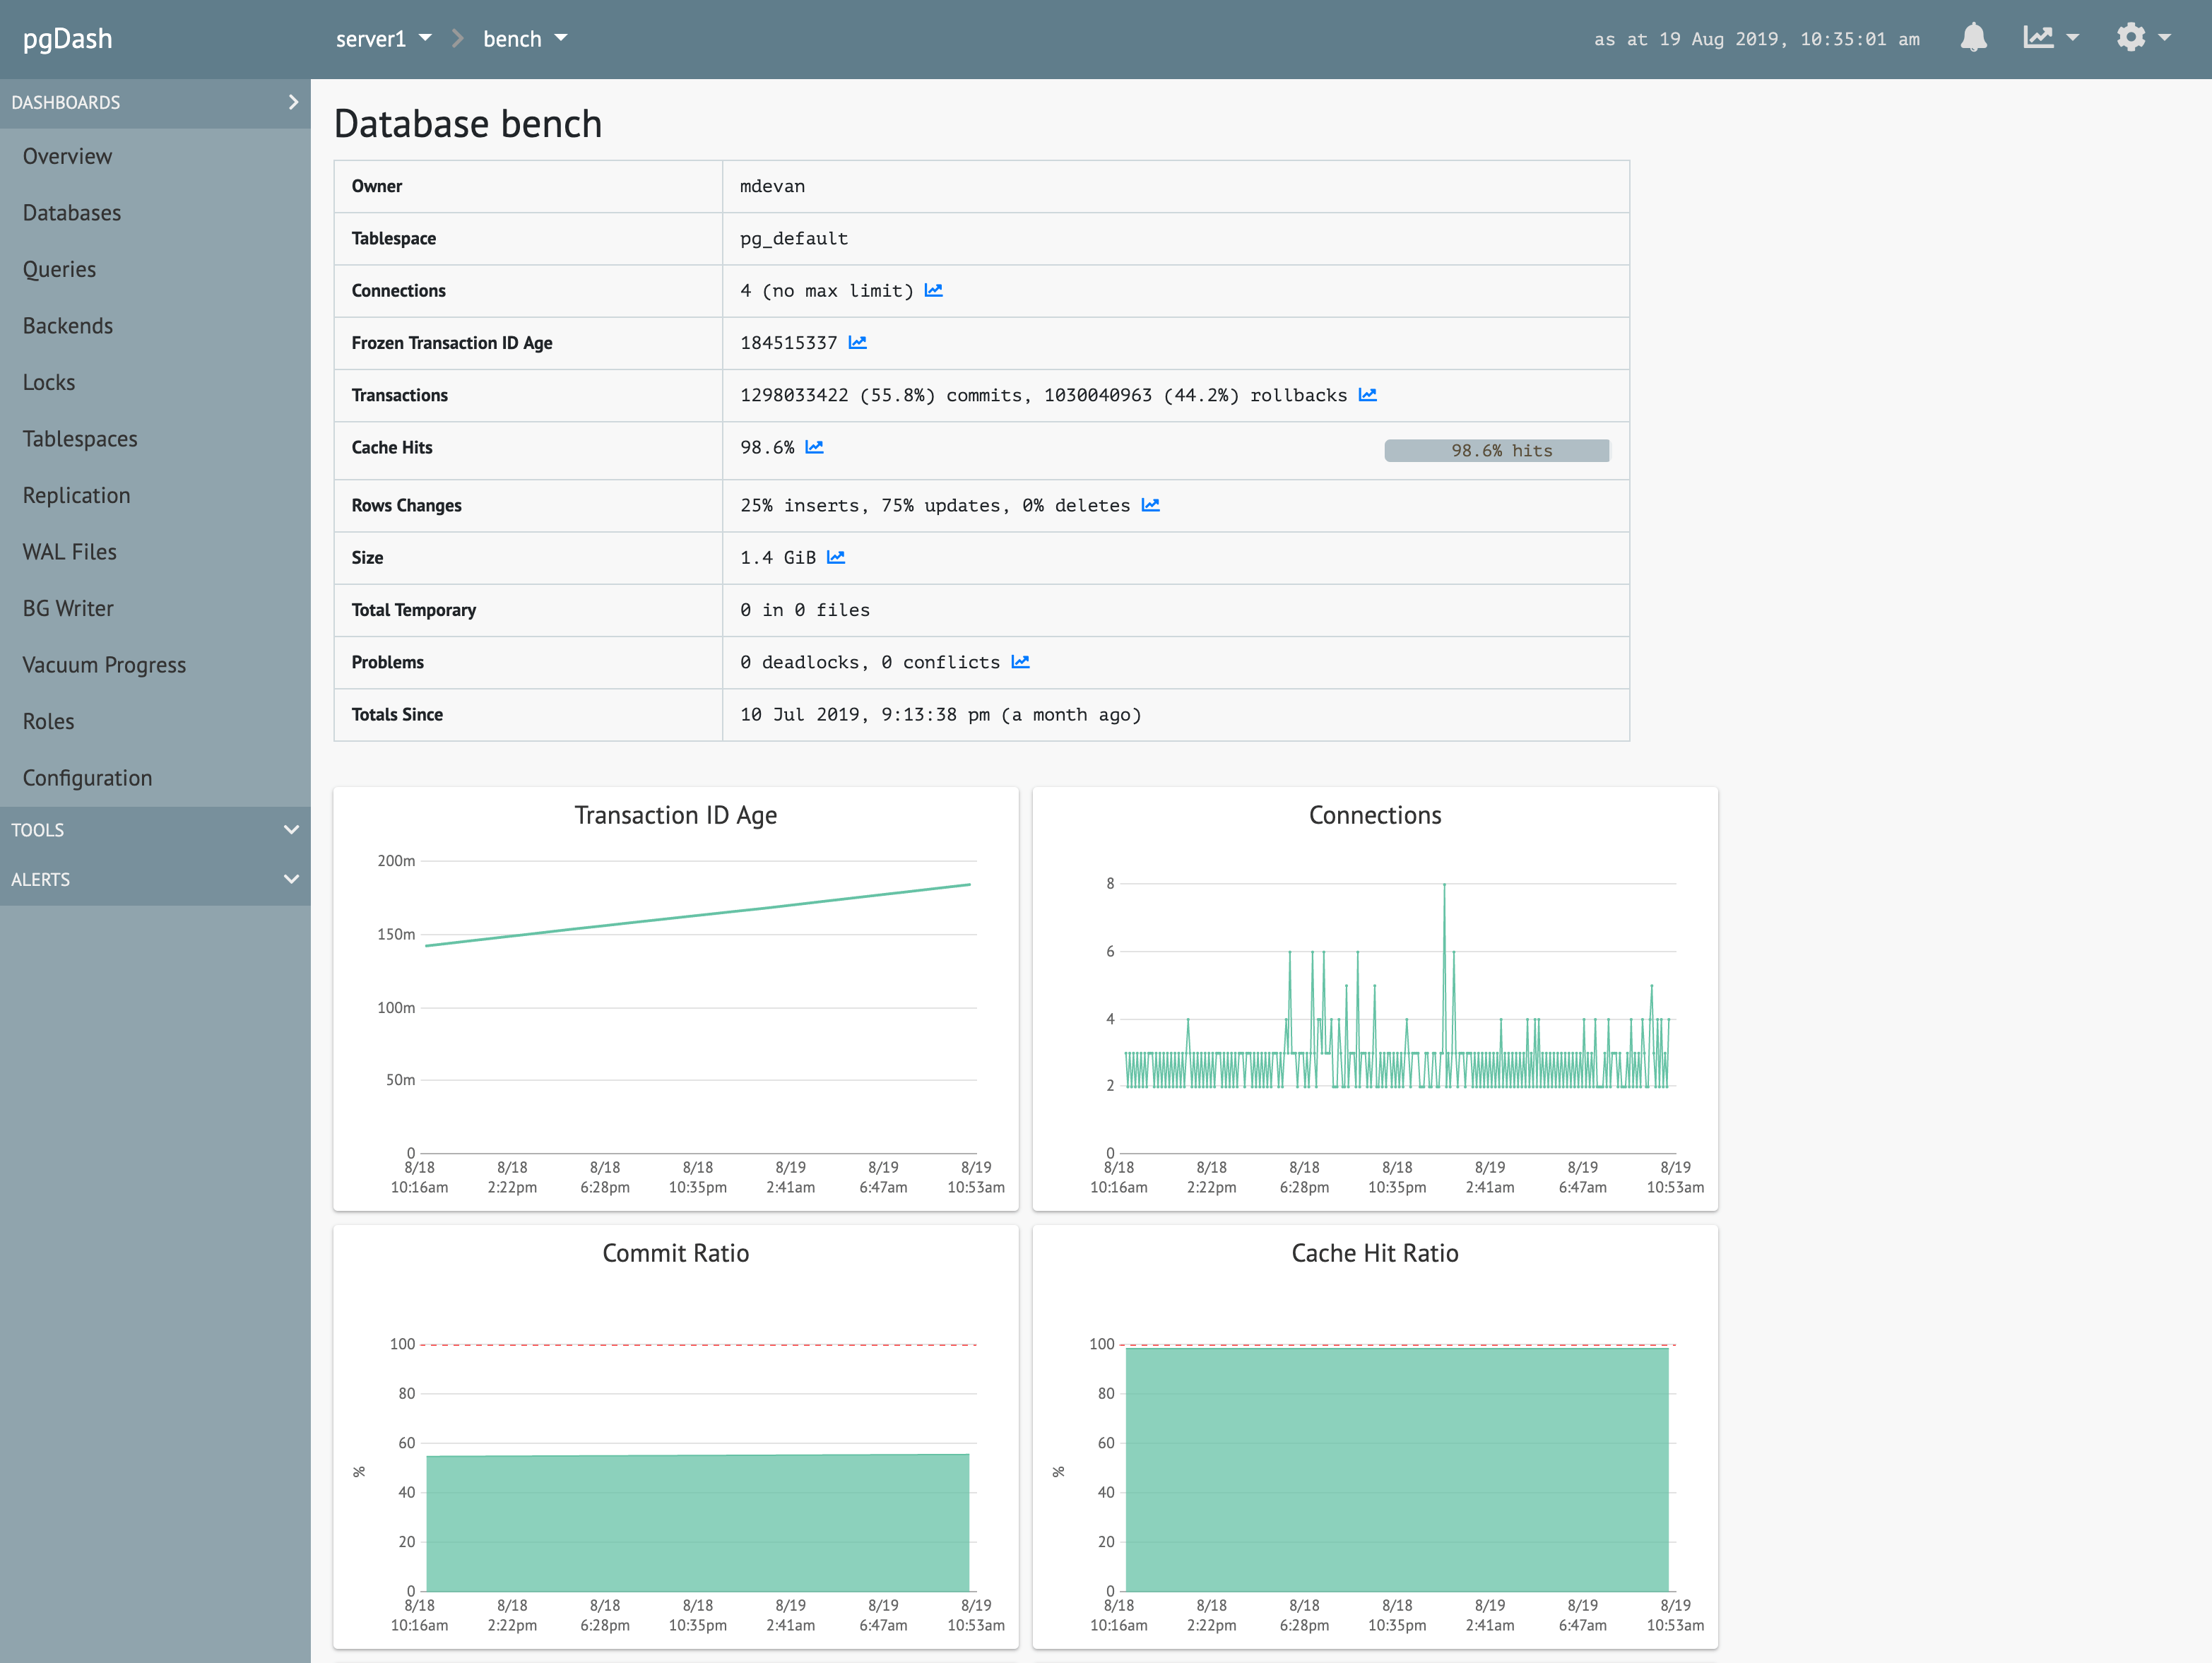
View and monitor database-level metrics like commit ratio, cache efficiency, frozen xid age and more. Identify extensions that need to be upgraded.
System Information
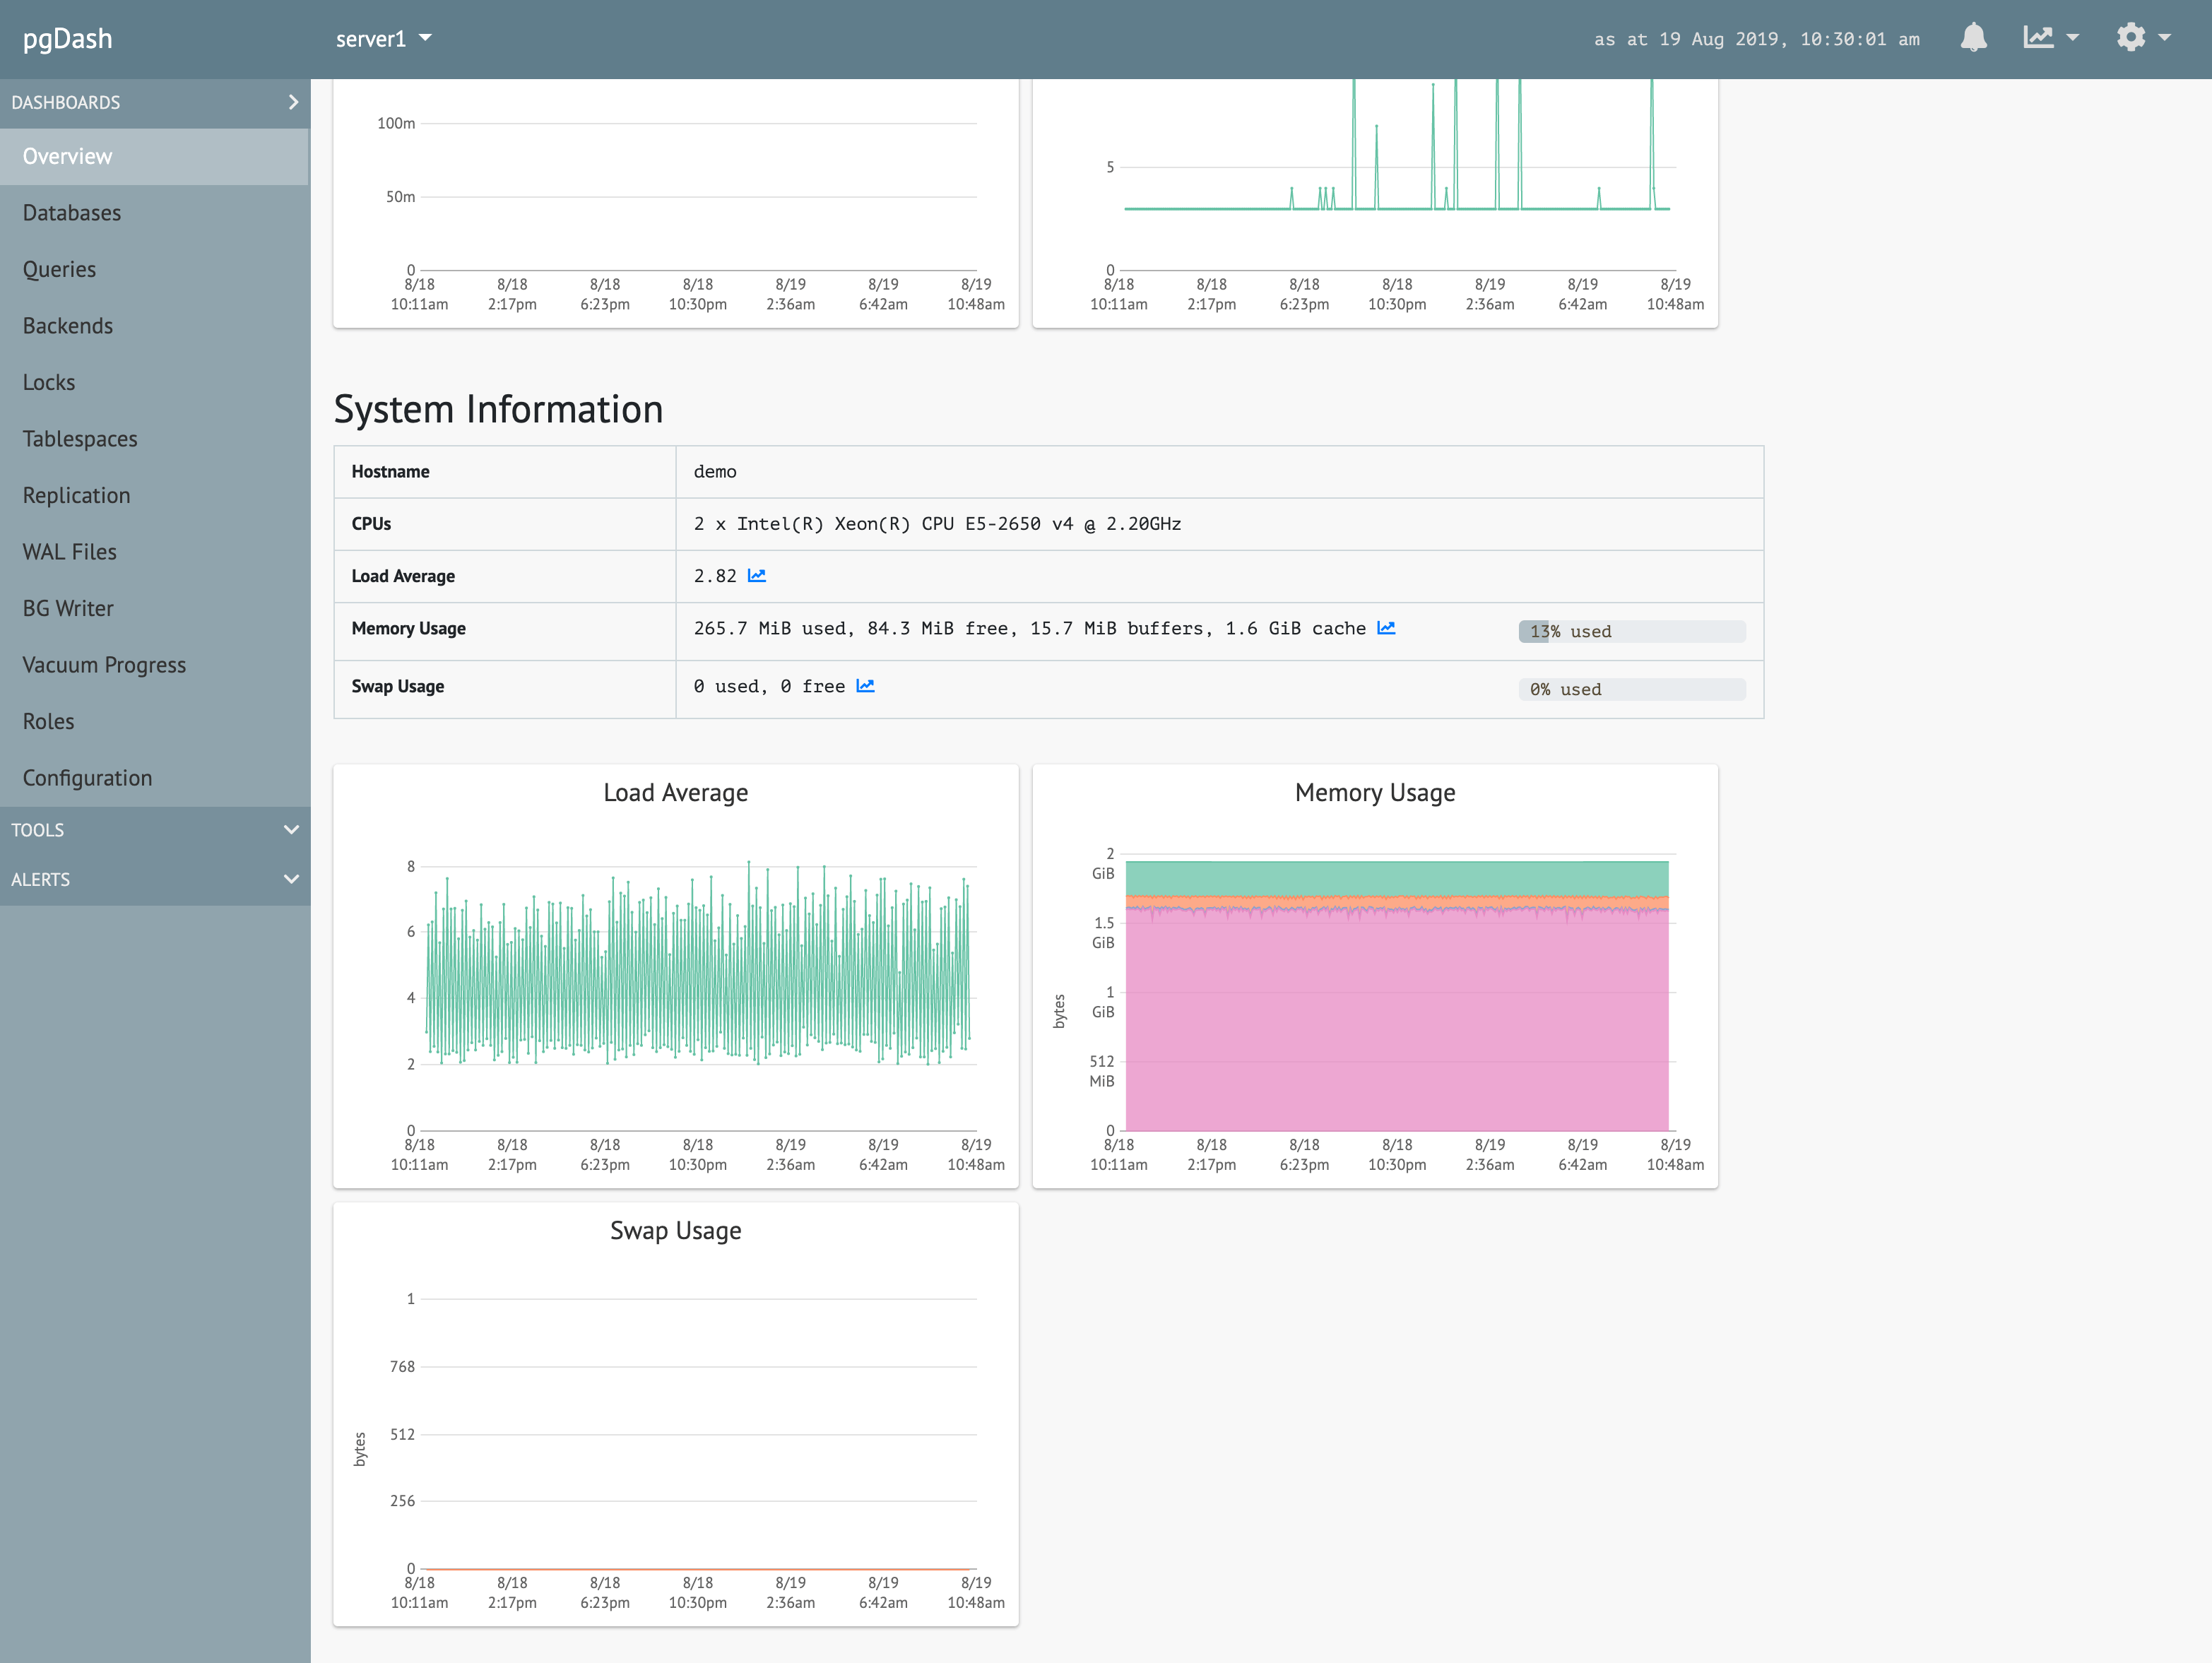
Collect and monitor important system information including load average, memory usage and swap usage as well as tablespace-wise disk usage.
Backends
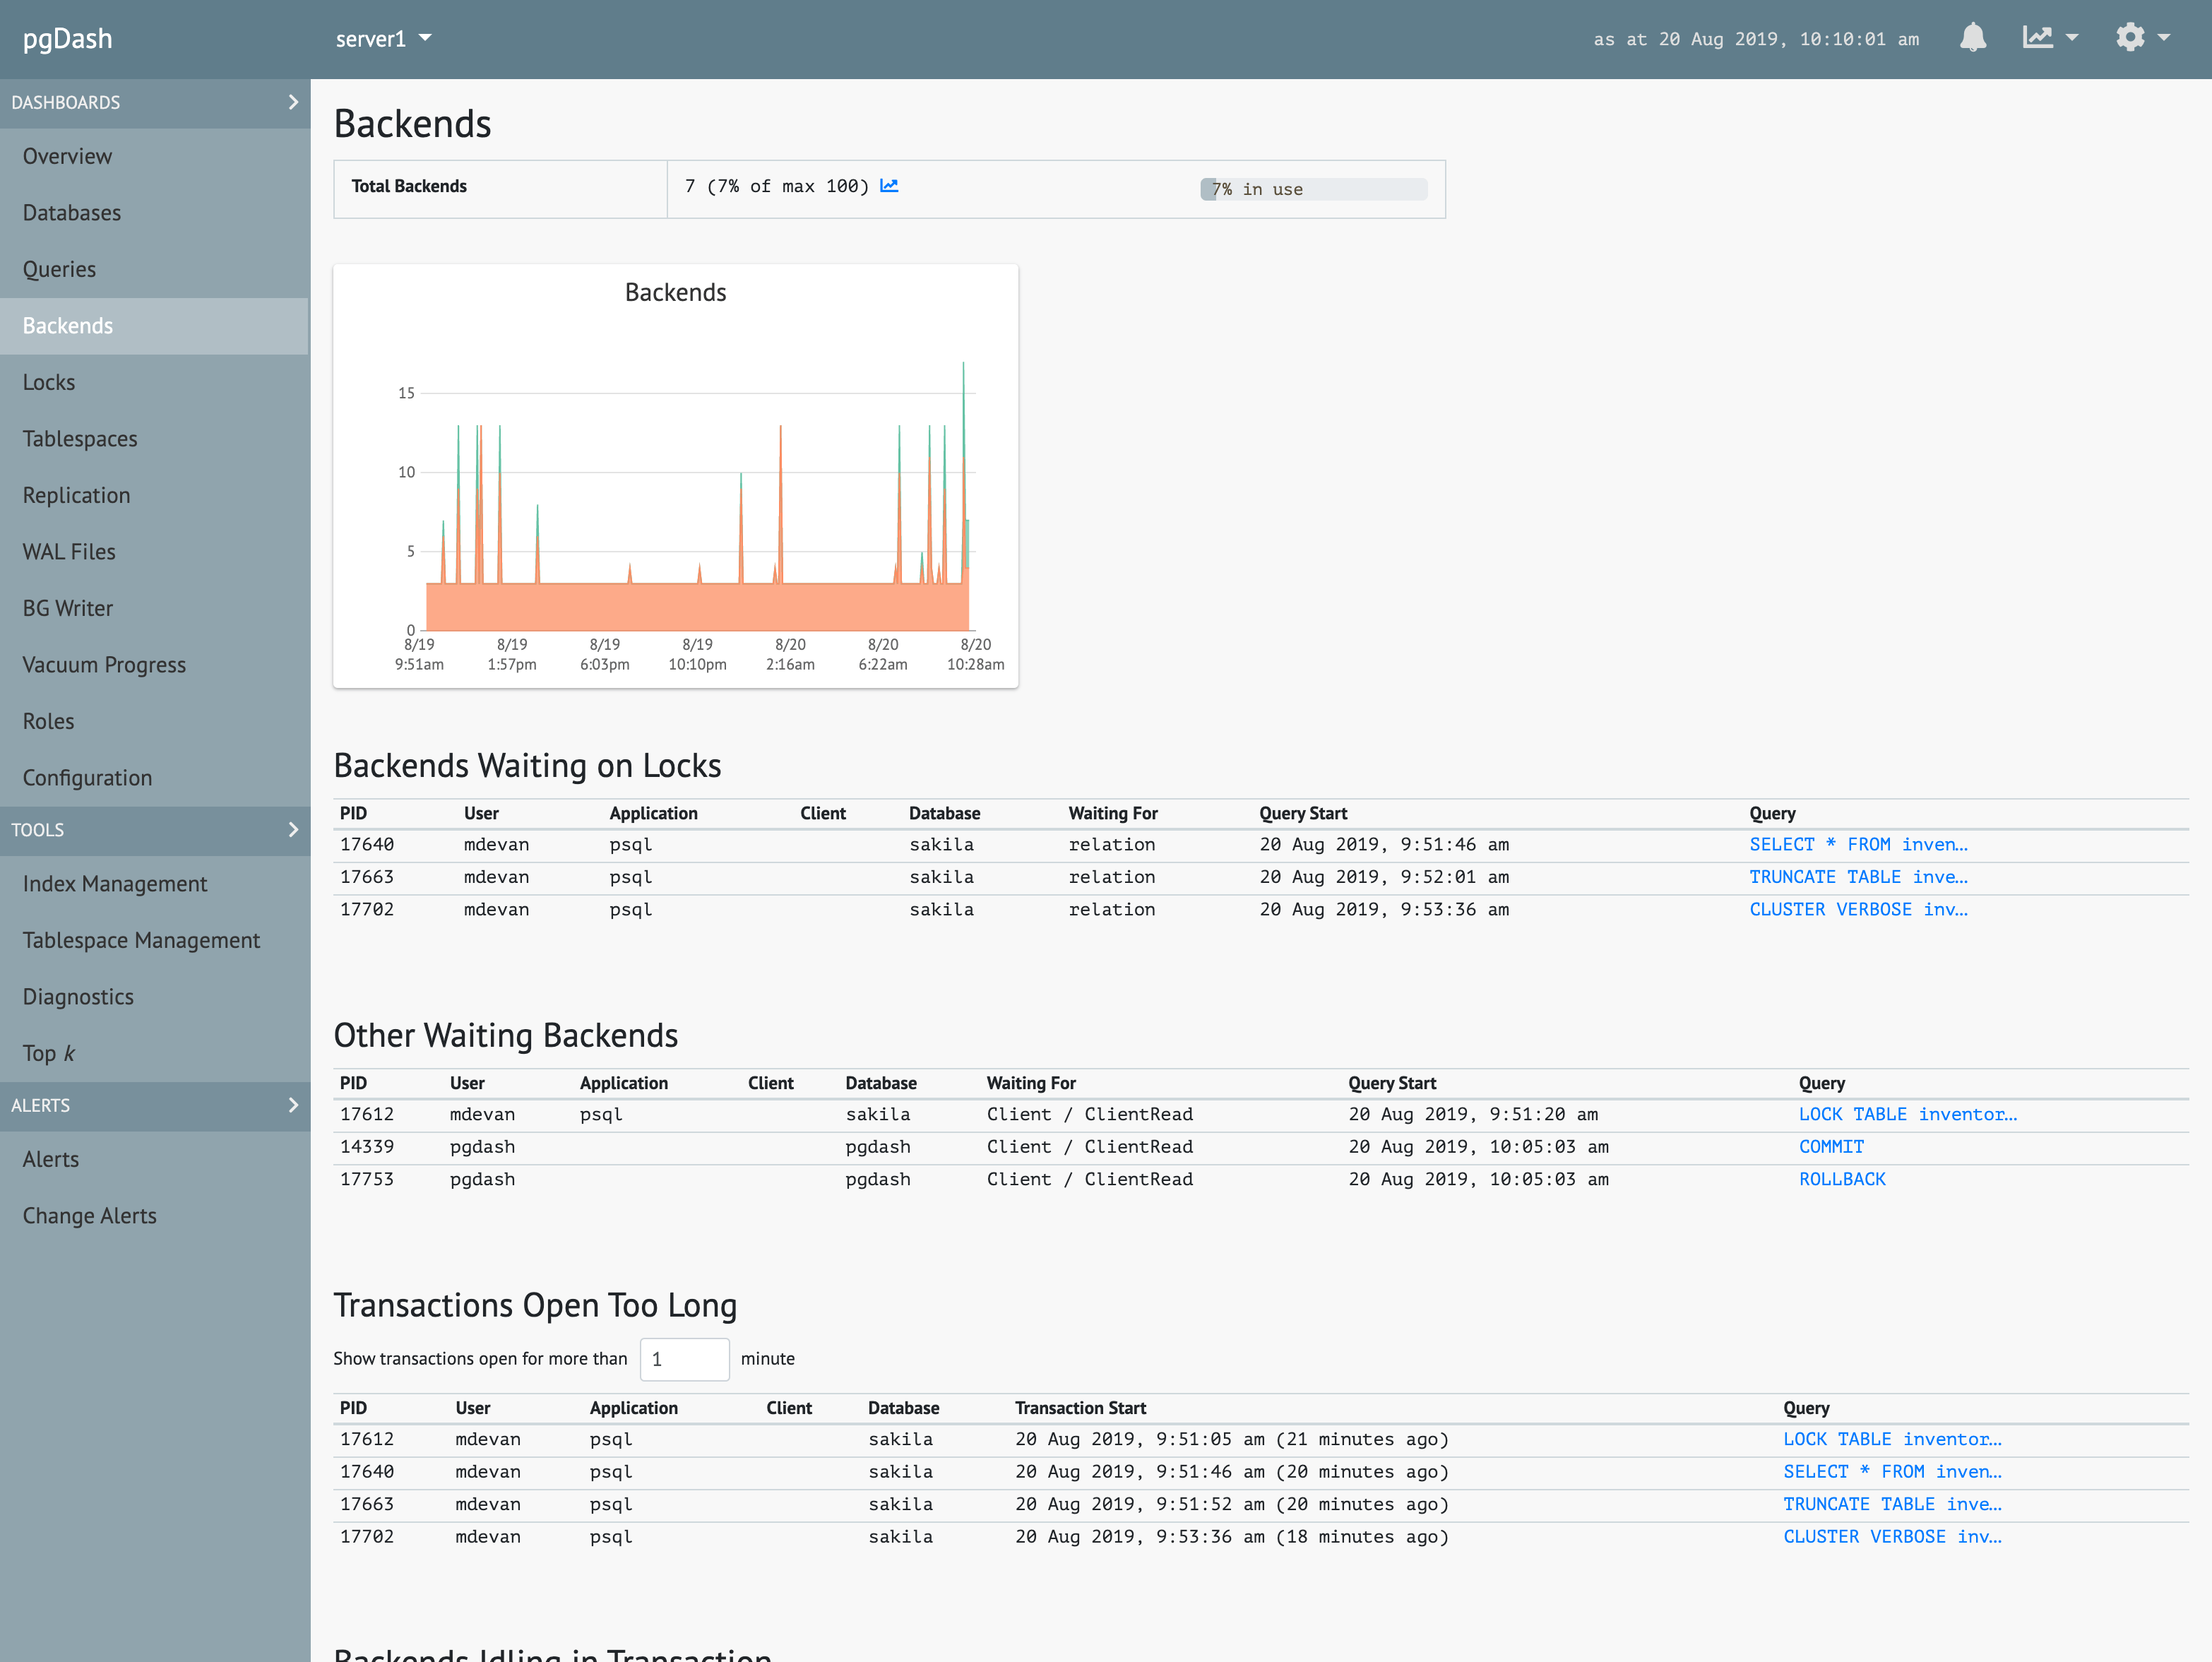
Track backends waiting on locks, transactions that have been open too long, idling transactions. Filter, sort and view all running backends.
Tablespaces
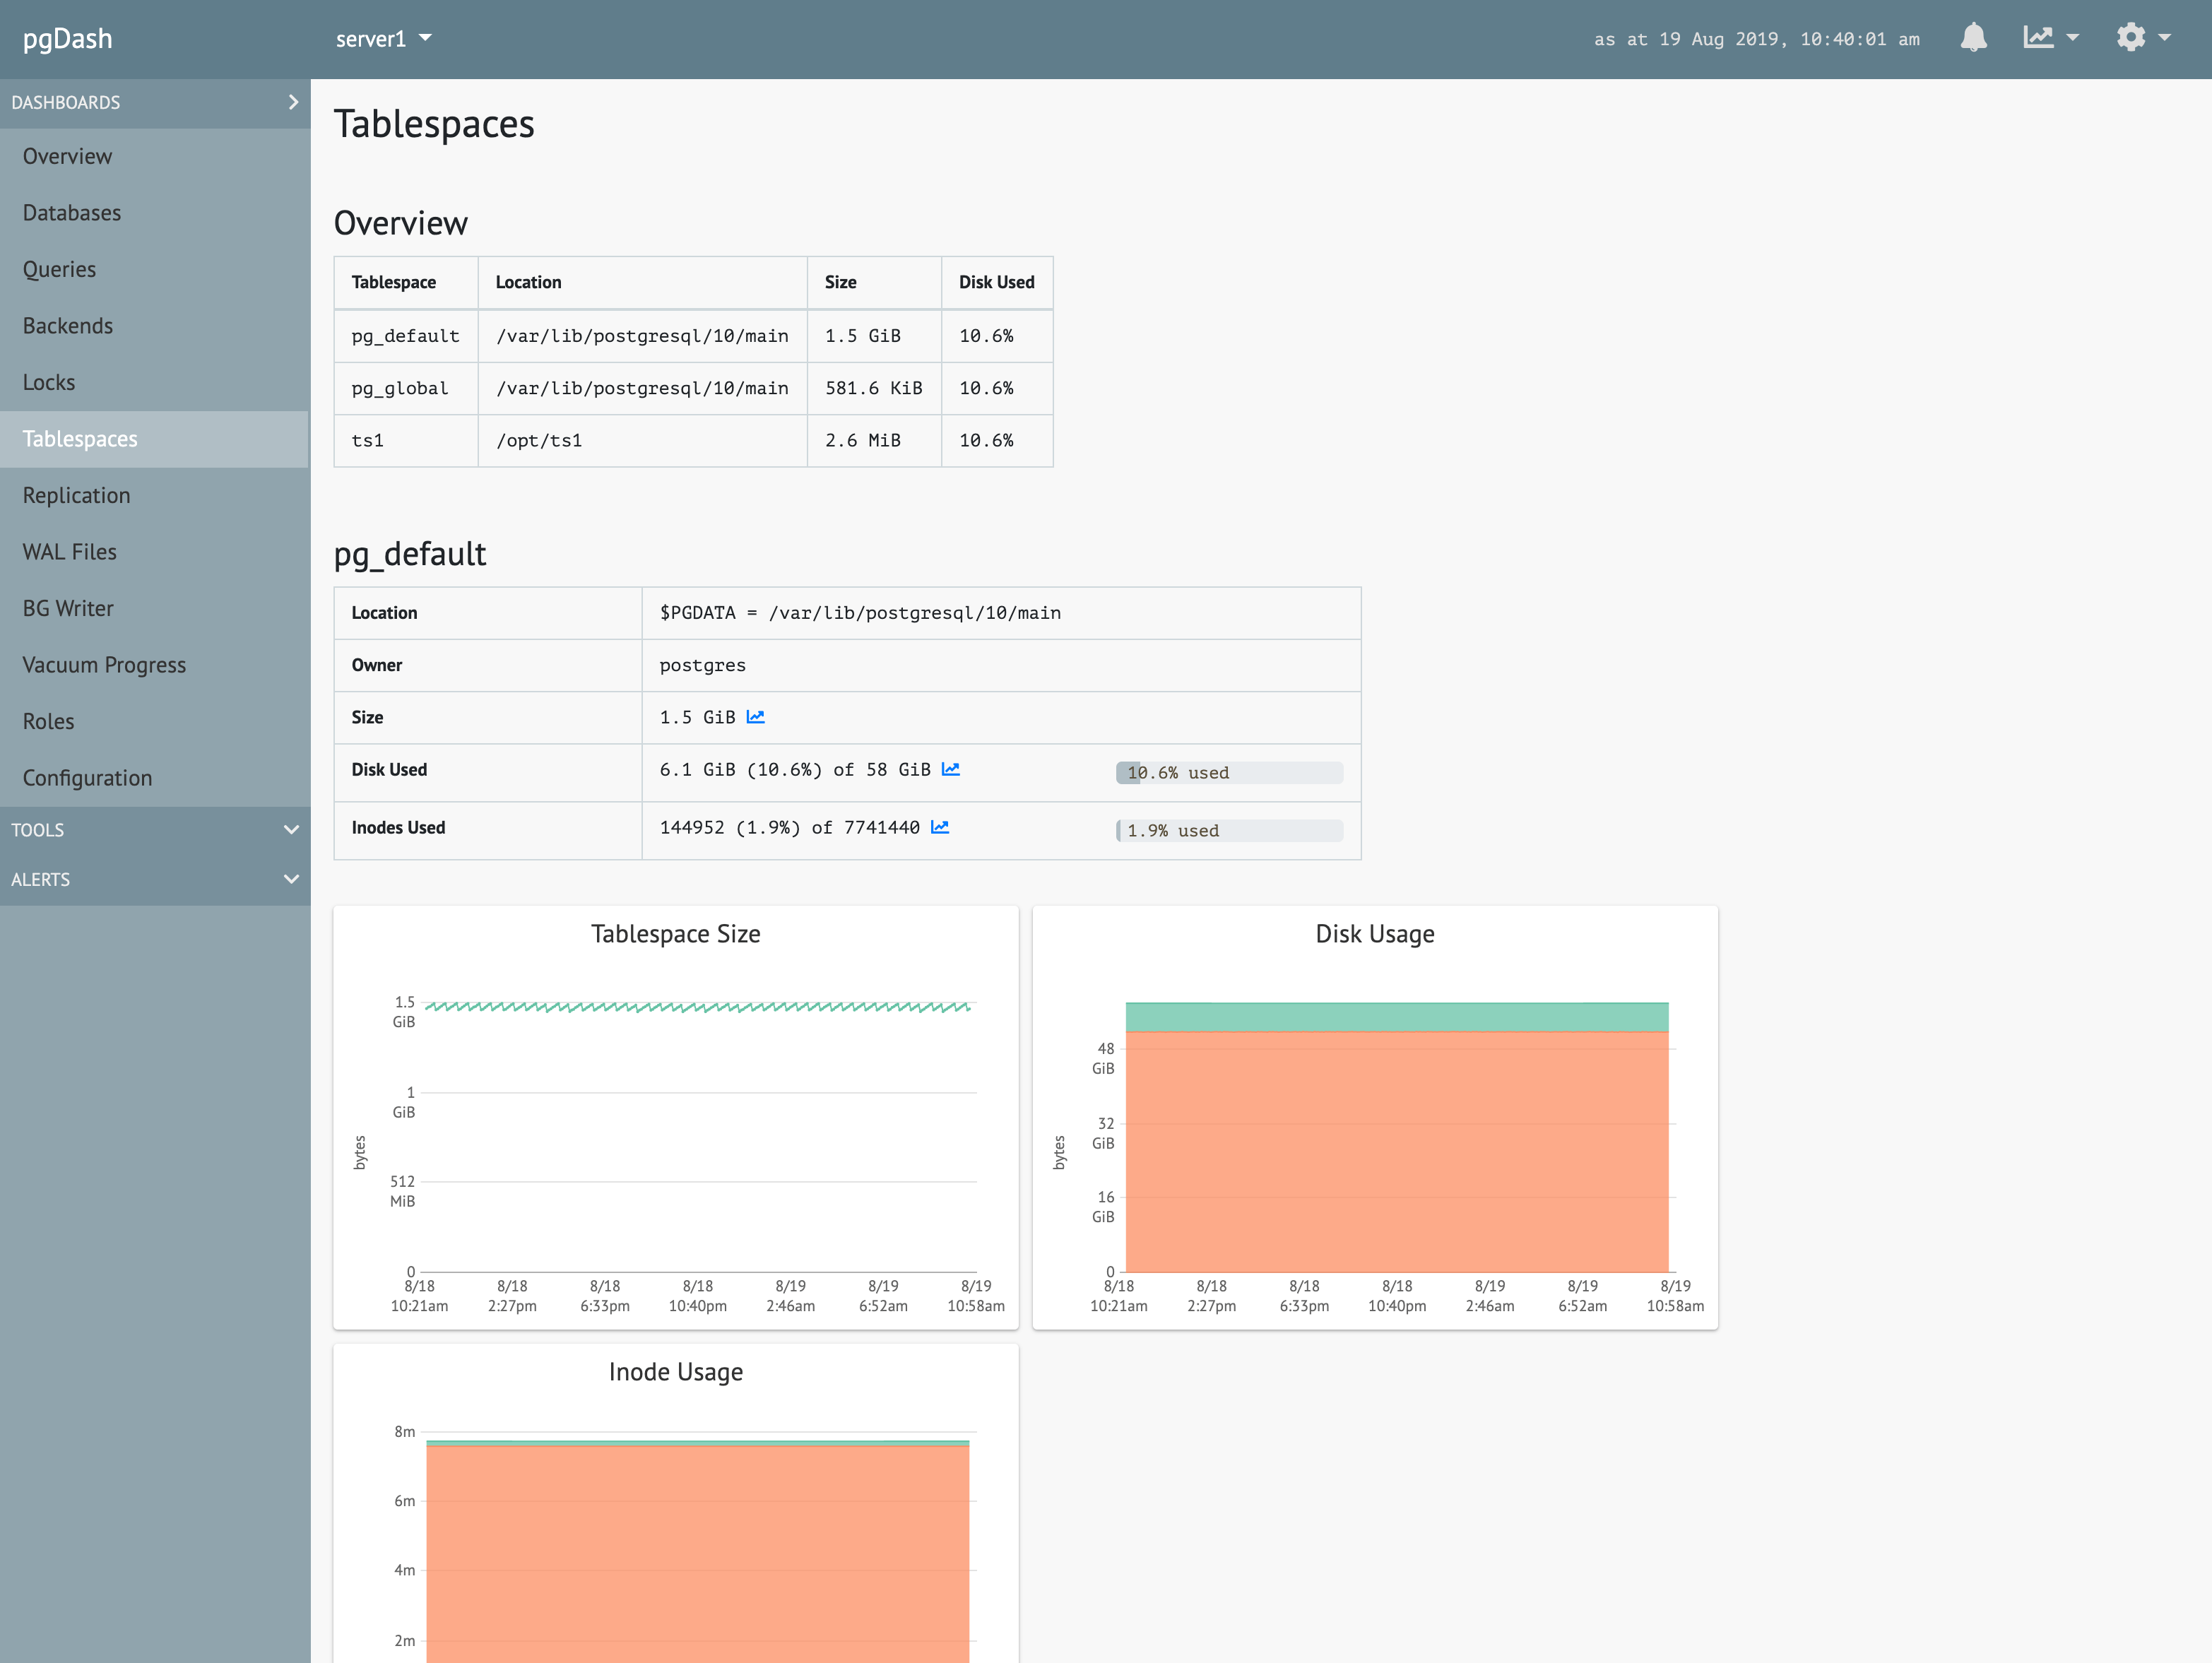
Monitor and track disk usage at tablespace level. Set threshold alerts for high disk usage.
Replication
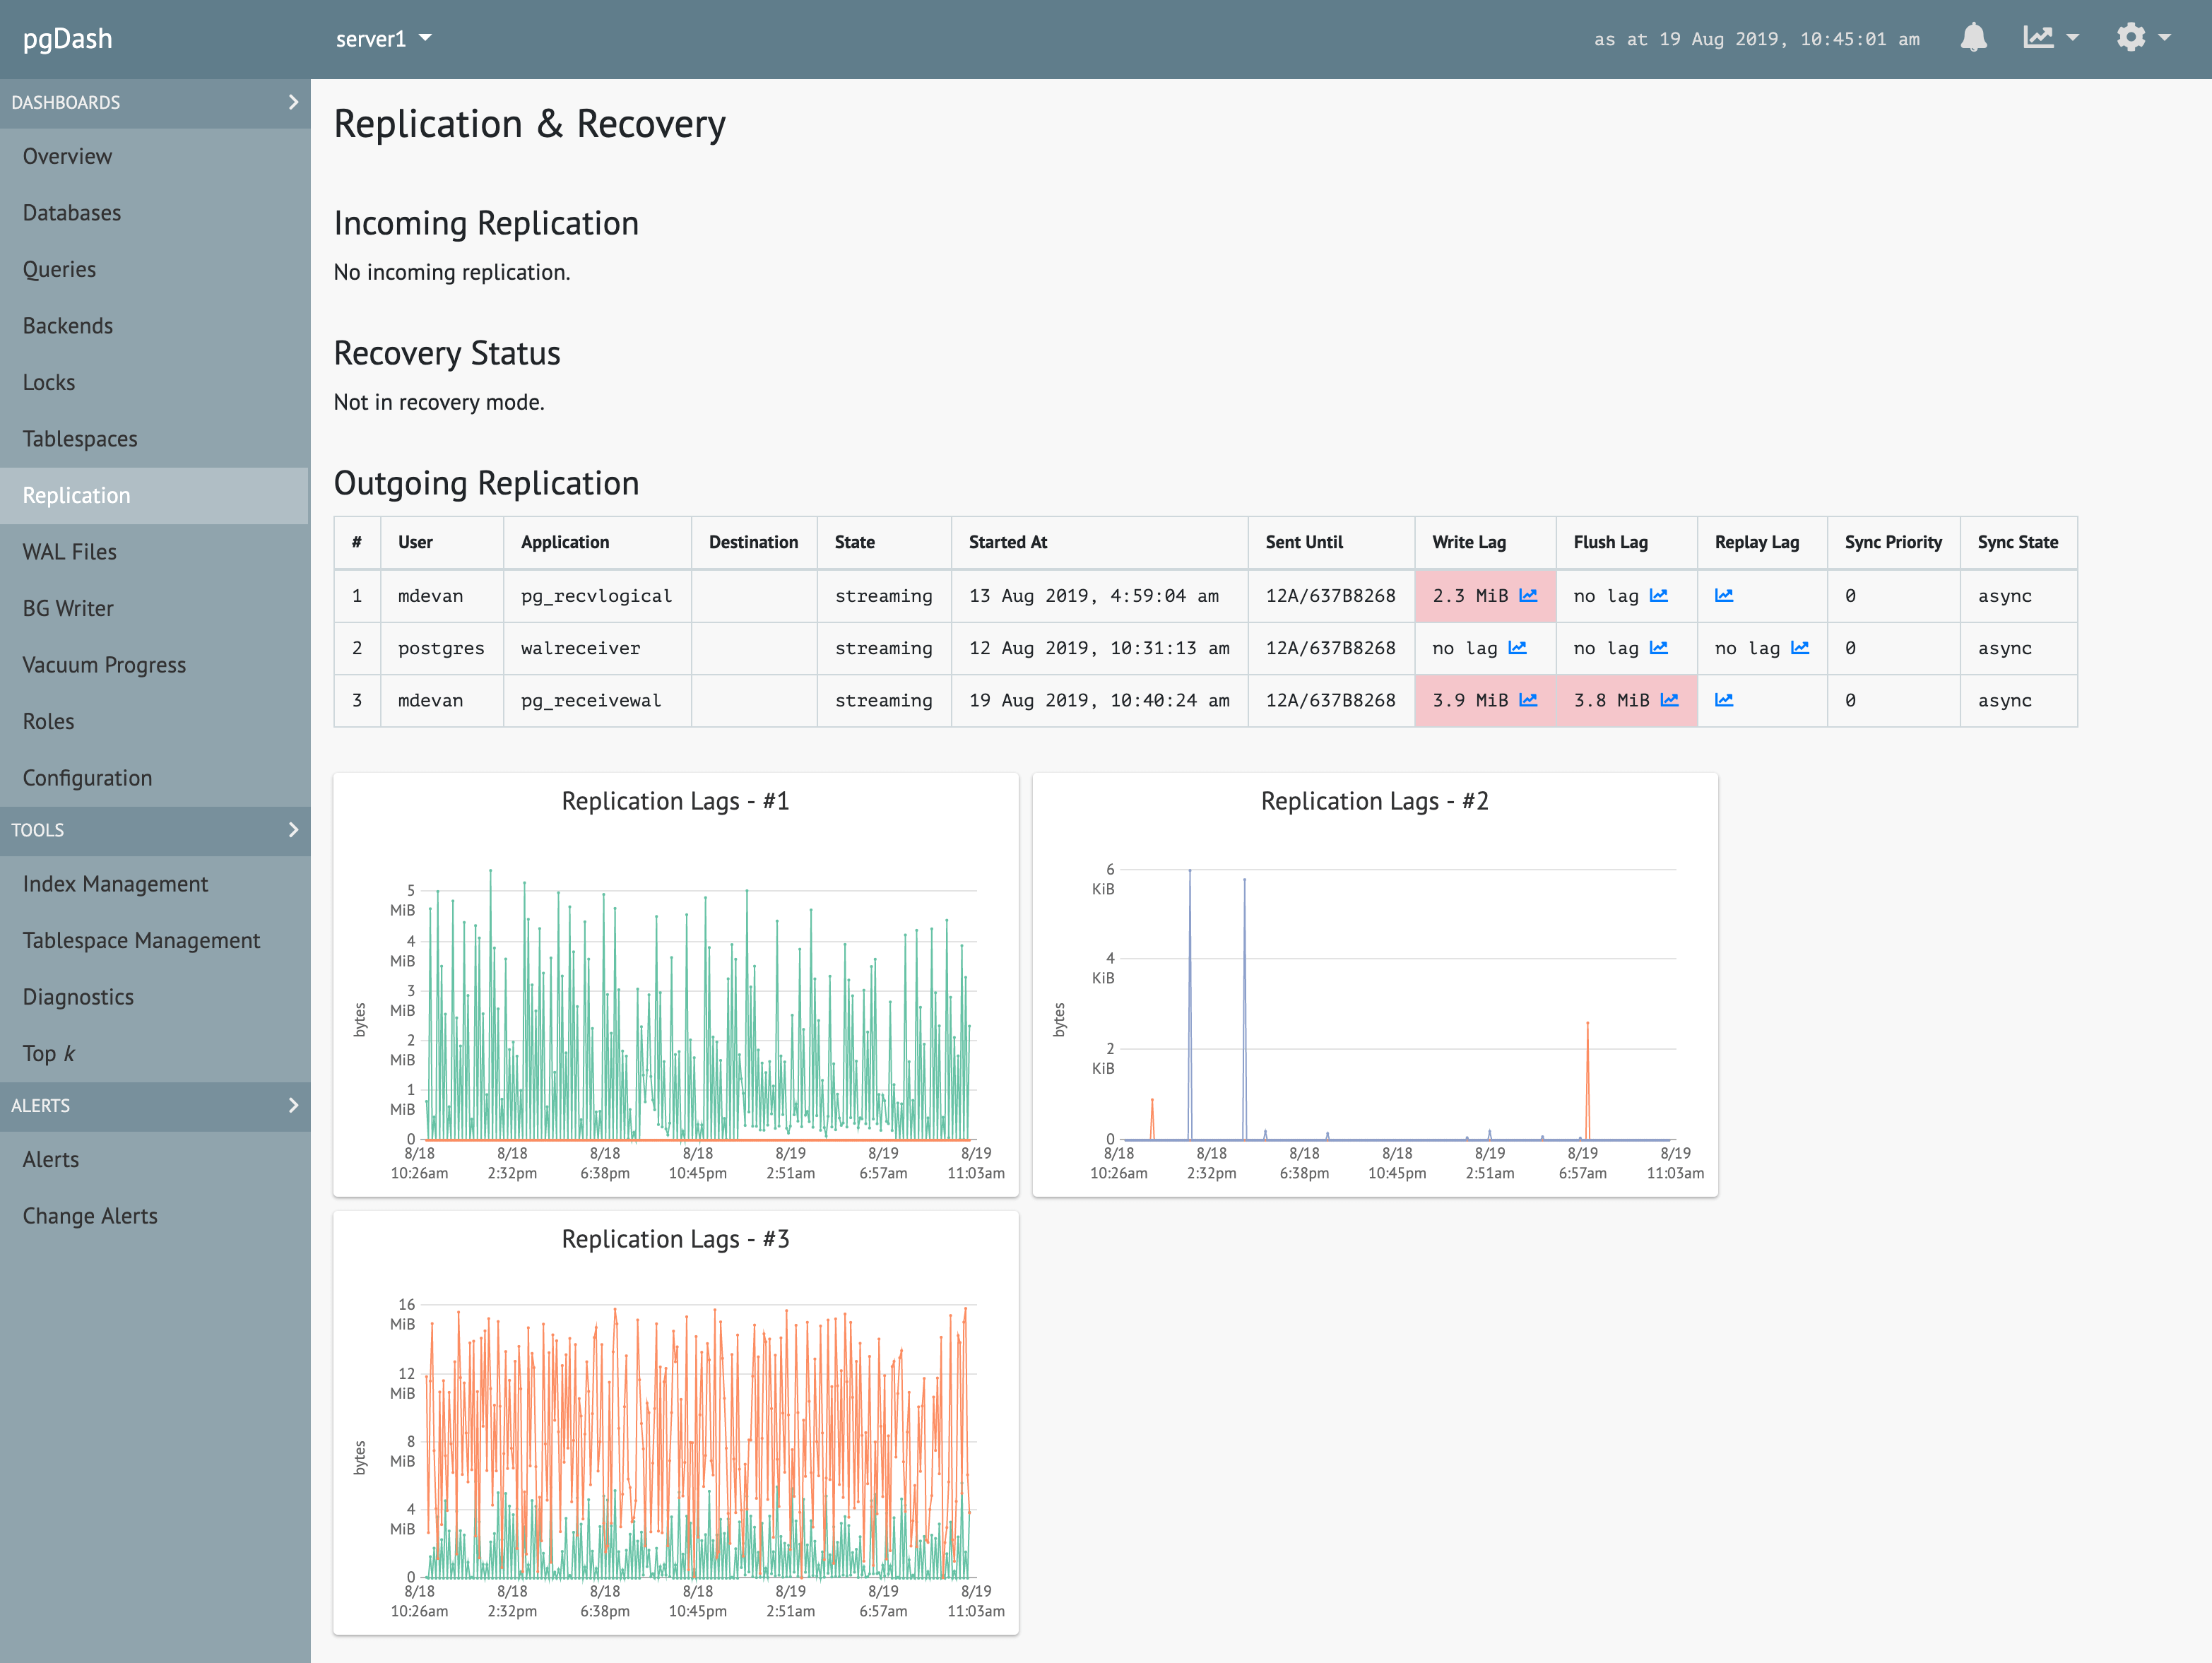
Monitor extensive replication metrics, including lags at primary and standby servers, physical and logical replication slot information, and standby recovery progress.
Deployment Inspector
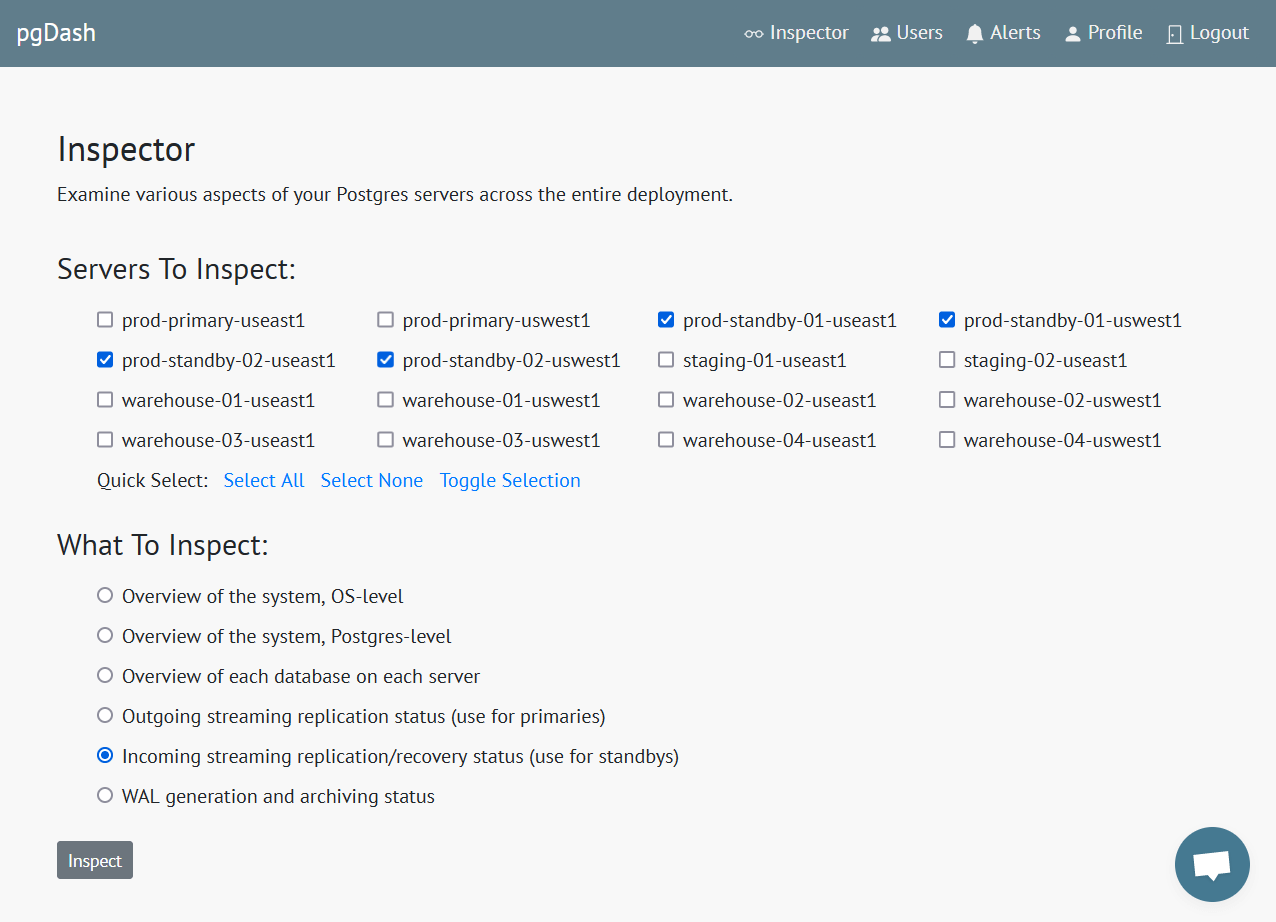
Quickly pull up dashboards for key subsystem health and performance indicators across your entire fleet of Postgres servers and databases.
Configuration Check
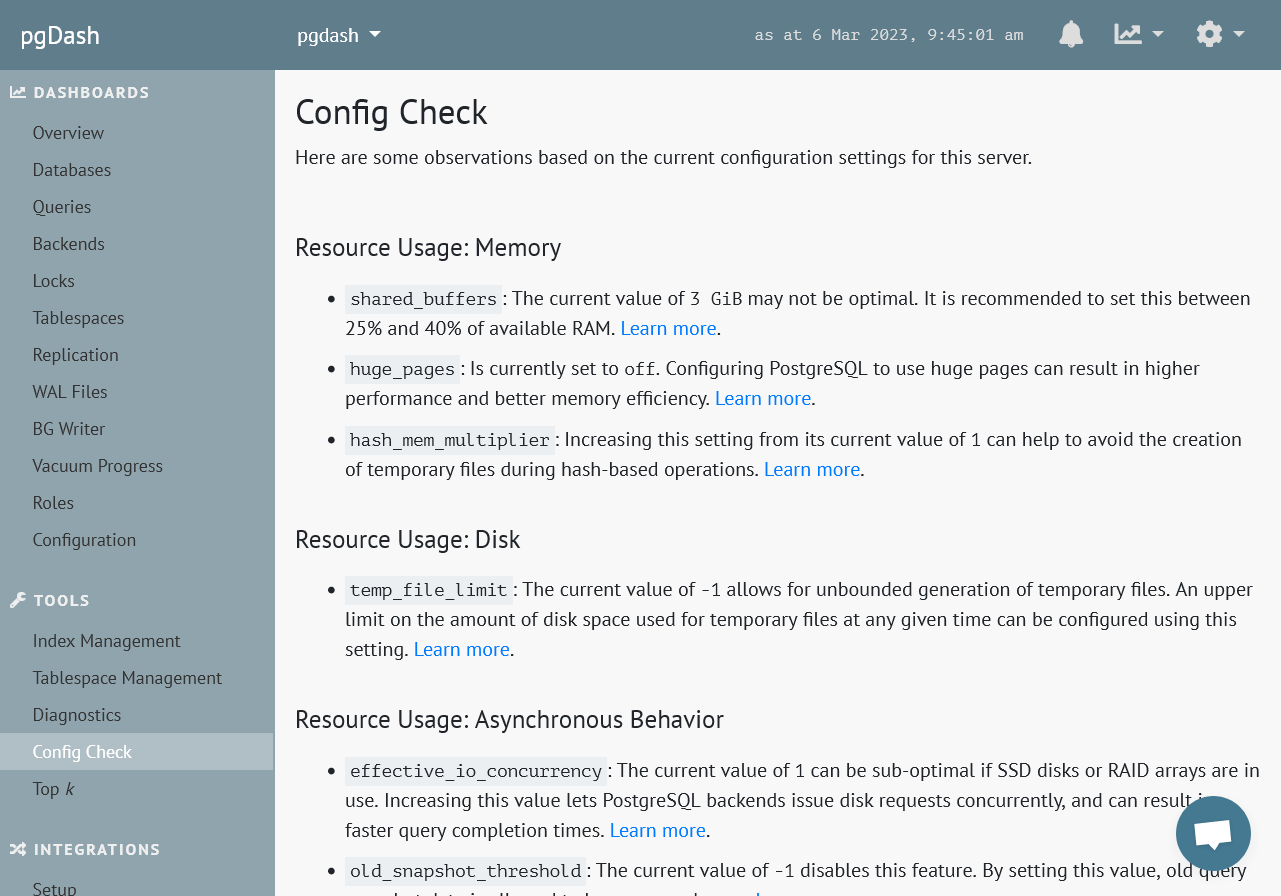
View recommendations on your PostgreSQL server configuration related to security, data safety, performance tuning and reliability.
Make Sure Everyone is in the Loop
From alerting to team sharing, pgDash provides features to assist in making sure that you and your team are on top of crucial information about your PostgreSQL deployment.
Alerts
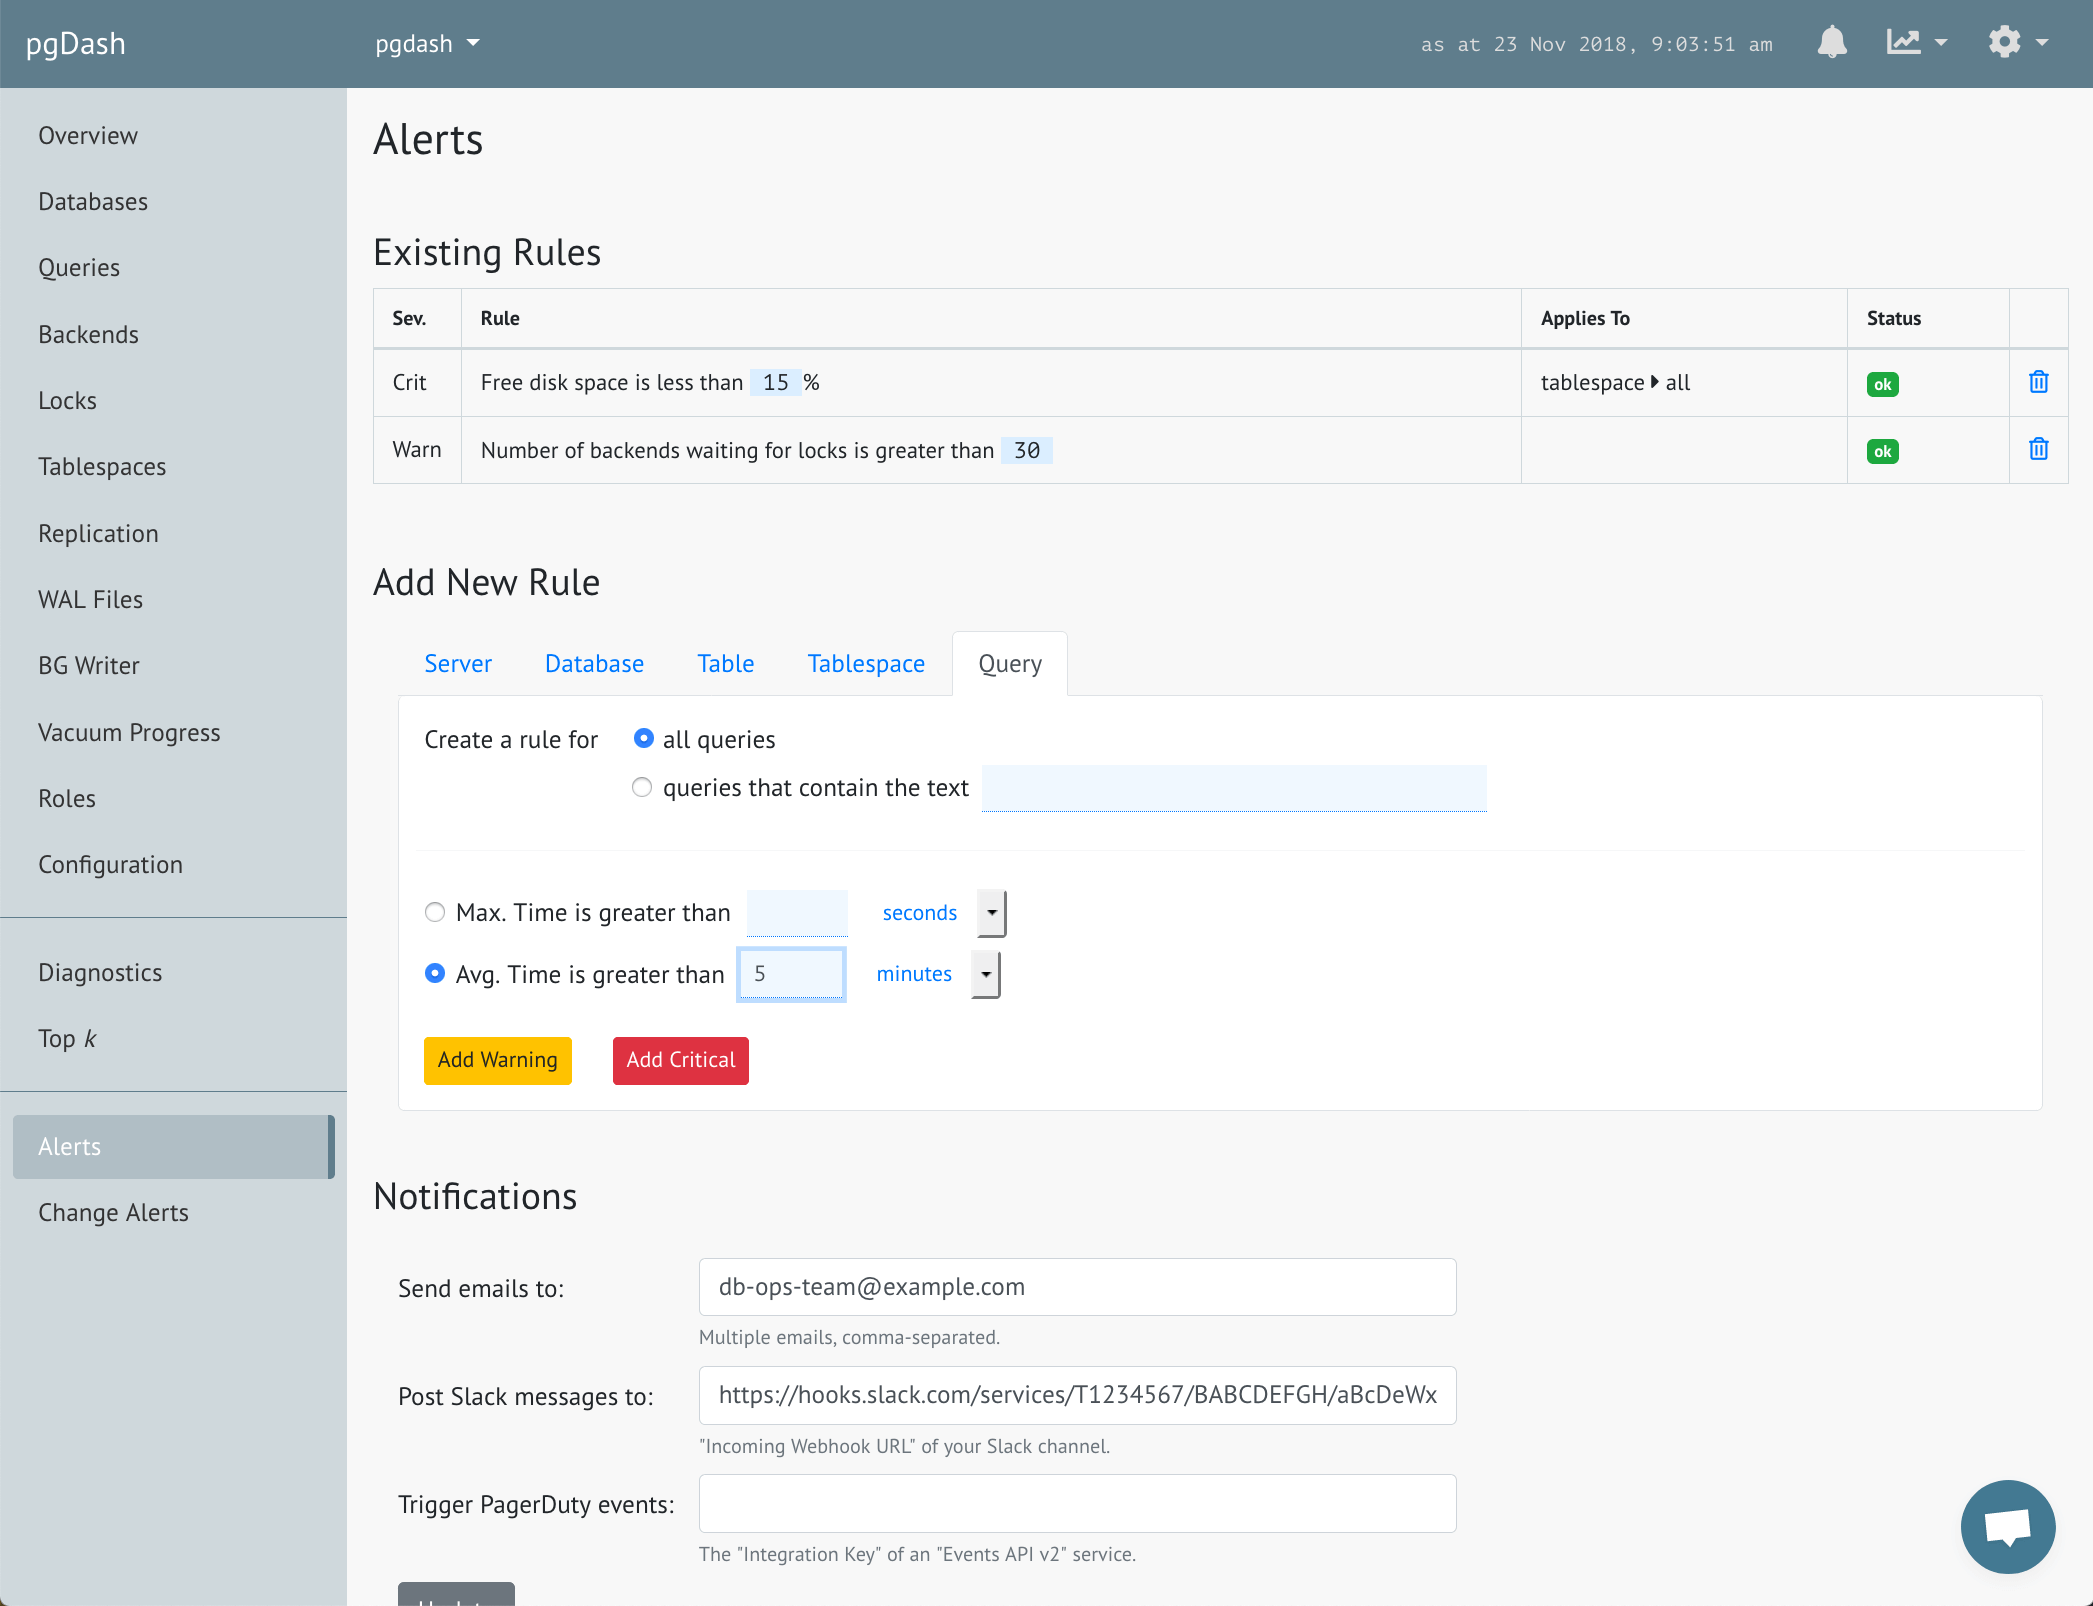
Set meaningful alerts, like “Commit Ratio of mydb is less than 80%”, “Number of backends waiting on locks is greater than 30”, and get notificatied via email, Slack, PagerDuty and more.
Change Alerts
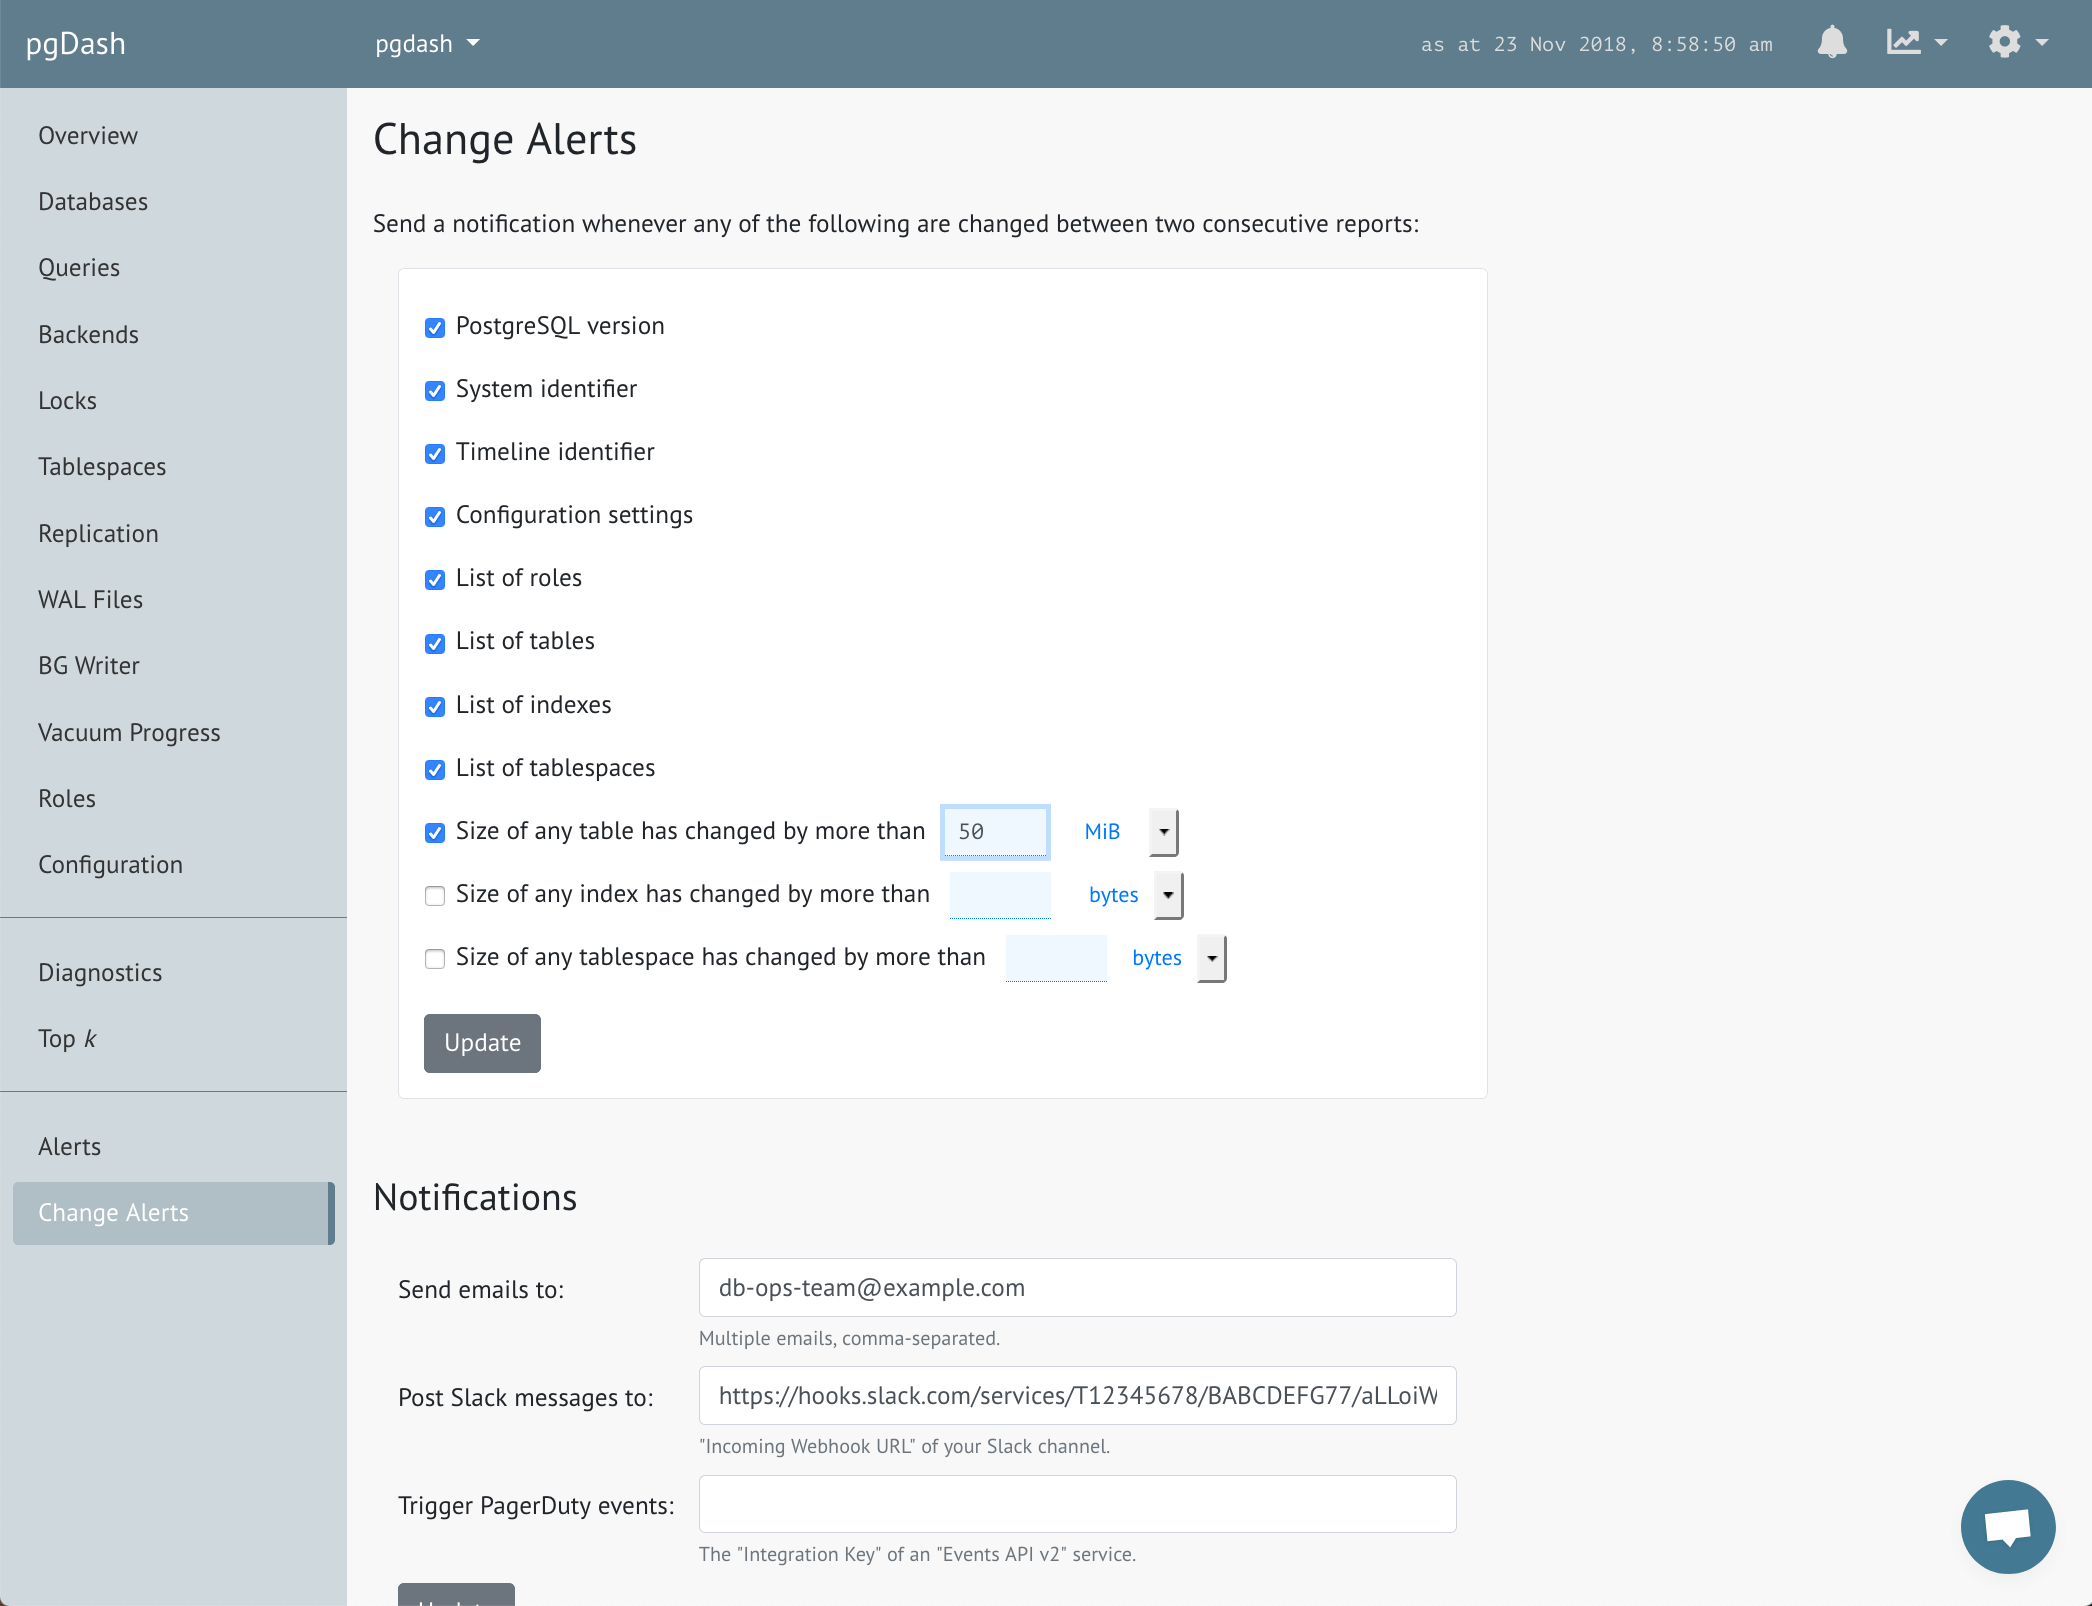
Get Change Alerts automatically and stay on top of important changes to your PostgreSQL databases, like addition or deletion of users, tables, indexes, or abrupt increases or decreases in table size, and more.
Team Sharing
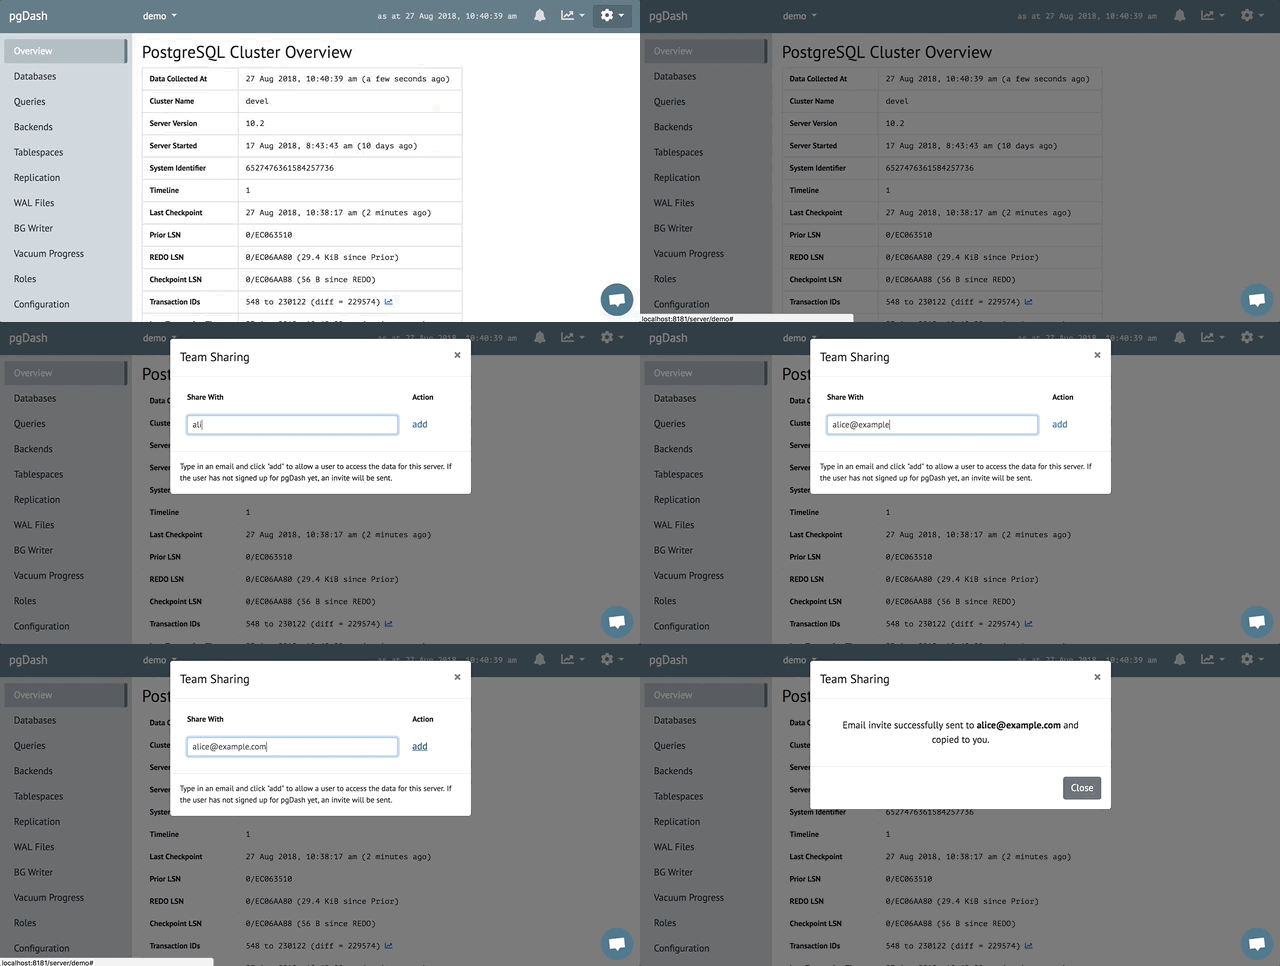
Share access to particular databases with Team members who need to stay in the loop. The team members you're sharing with can view all information, metrics and graphs about the shared database, but will not be able to delete any server data.